

These Are The Best (And Worst) Leading Indicators
Not all economic indicators are created equal. Here are the best (and worst) for recession forecasting.

There is a common belief that tracking the economy simply means watching GDP growth or the monthly unemployment rate. But, as we’ve discussed in several previous posts, most of the economy doesn’t contract - even in recessions.
All economic fluctuations come from a few narrow sectors, and if you want to anticipate major changes or downturns, you need to focus on these smaller sectors that actually drive them.
The question is: which sectors lead the most and which are the most reliable?
Before moving on, make sure you are subscribed to our email list. This will keep you notified of all our latest posts on all platforms, including YouTube and X.
In this post, we’ll rank the major components of GDP by two critical dimensions: how far in advance each indicator declines before recessions and how deeply each indicator contracts.
A good leading indicator, or a sector with predictive value, is one that contracts early and deeply.
The results of this study serve as the foundation for the EPB Research framework and our approach to analyzing business cycles.
What Makes A Good Leading Indicator
A good leading indicator needs to do two primary things:
Decline early
Decline deeply
An indicator that declines early but only has a very shallow contraction will never provide enough confidence or a clear enough signal for action. An indicator that declines deeply but late is not useful for any predictive analysis. An indicator like this may be useful as a confirmation tool, but not as a leading signal.
The chart below plots 15 major components of GDP across these two dimensions, using data from all recessions between 1955 and 2019.
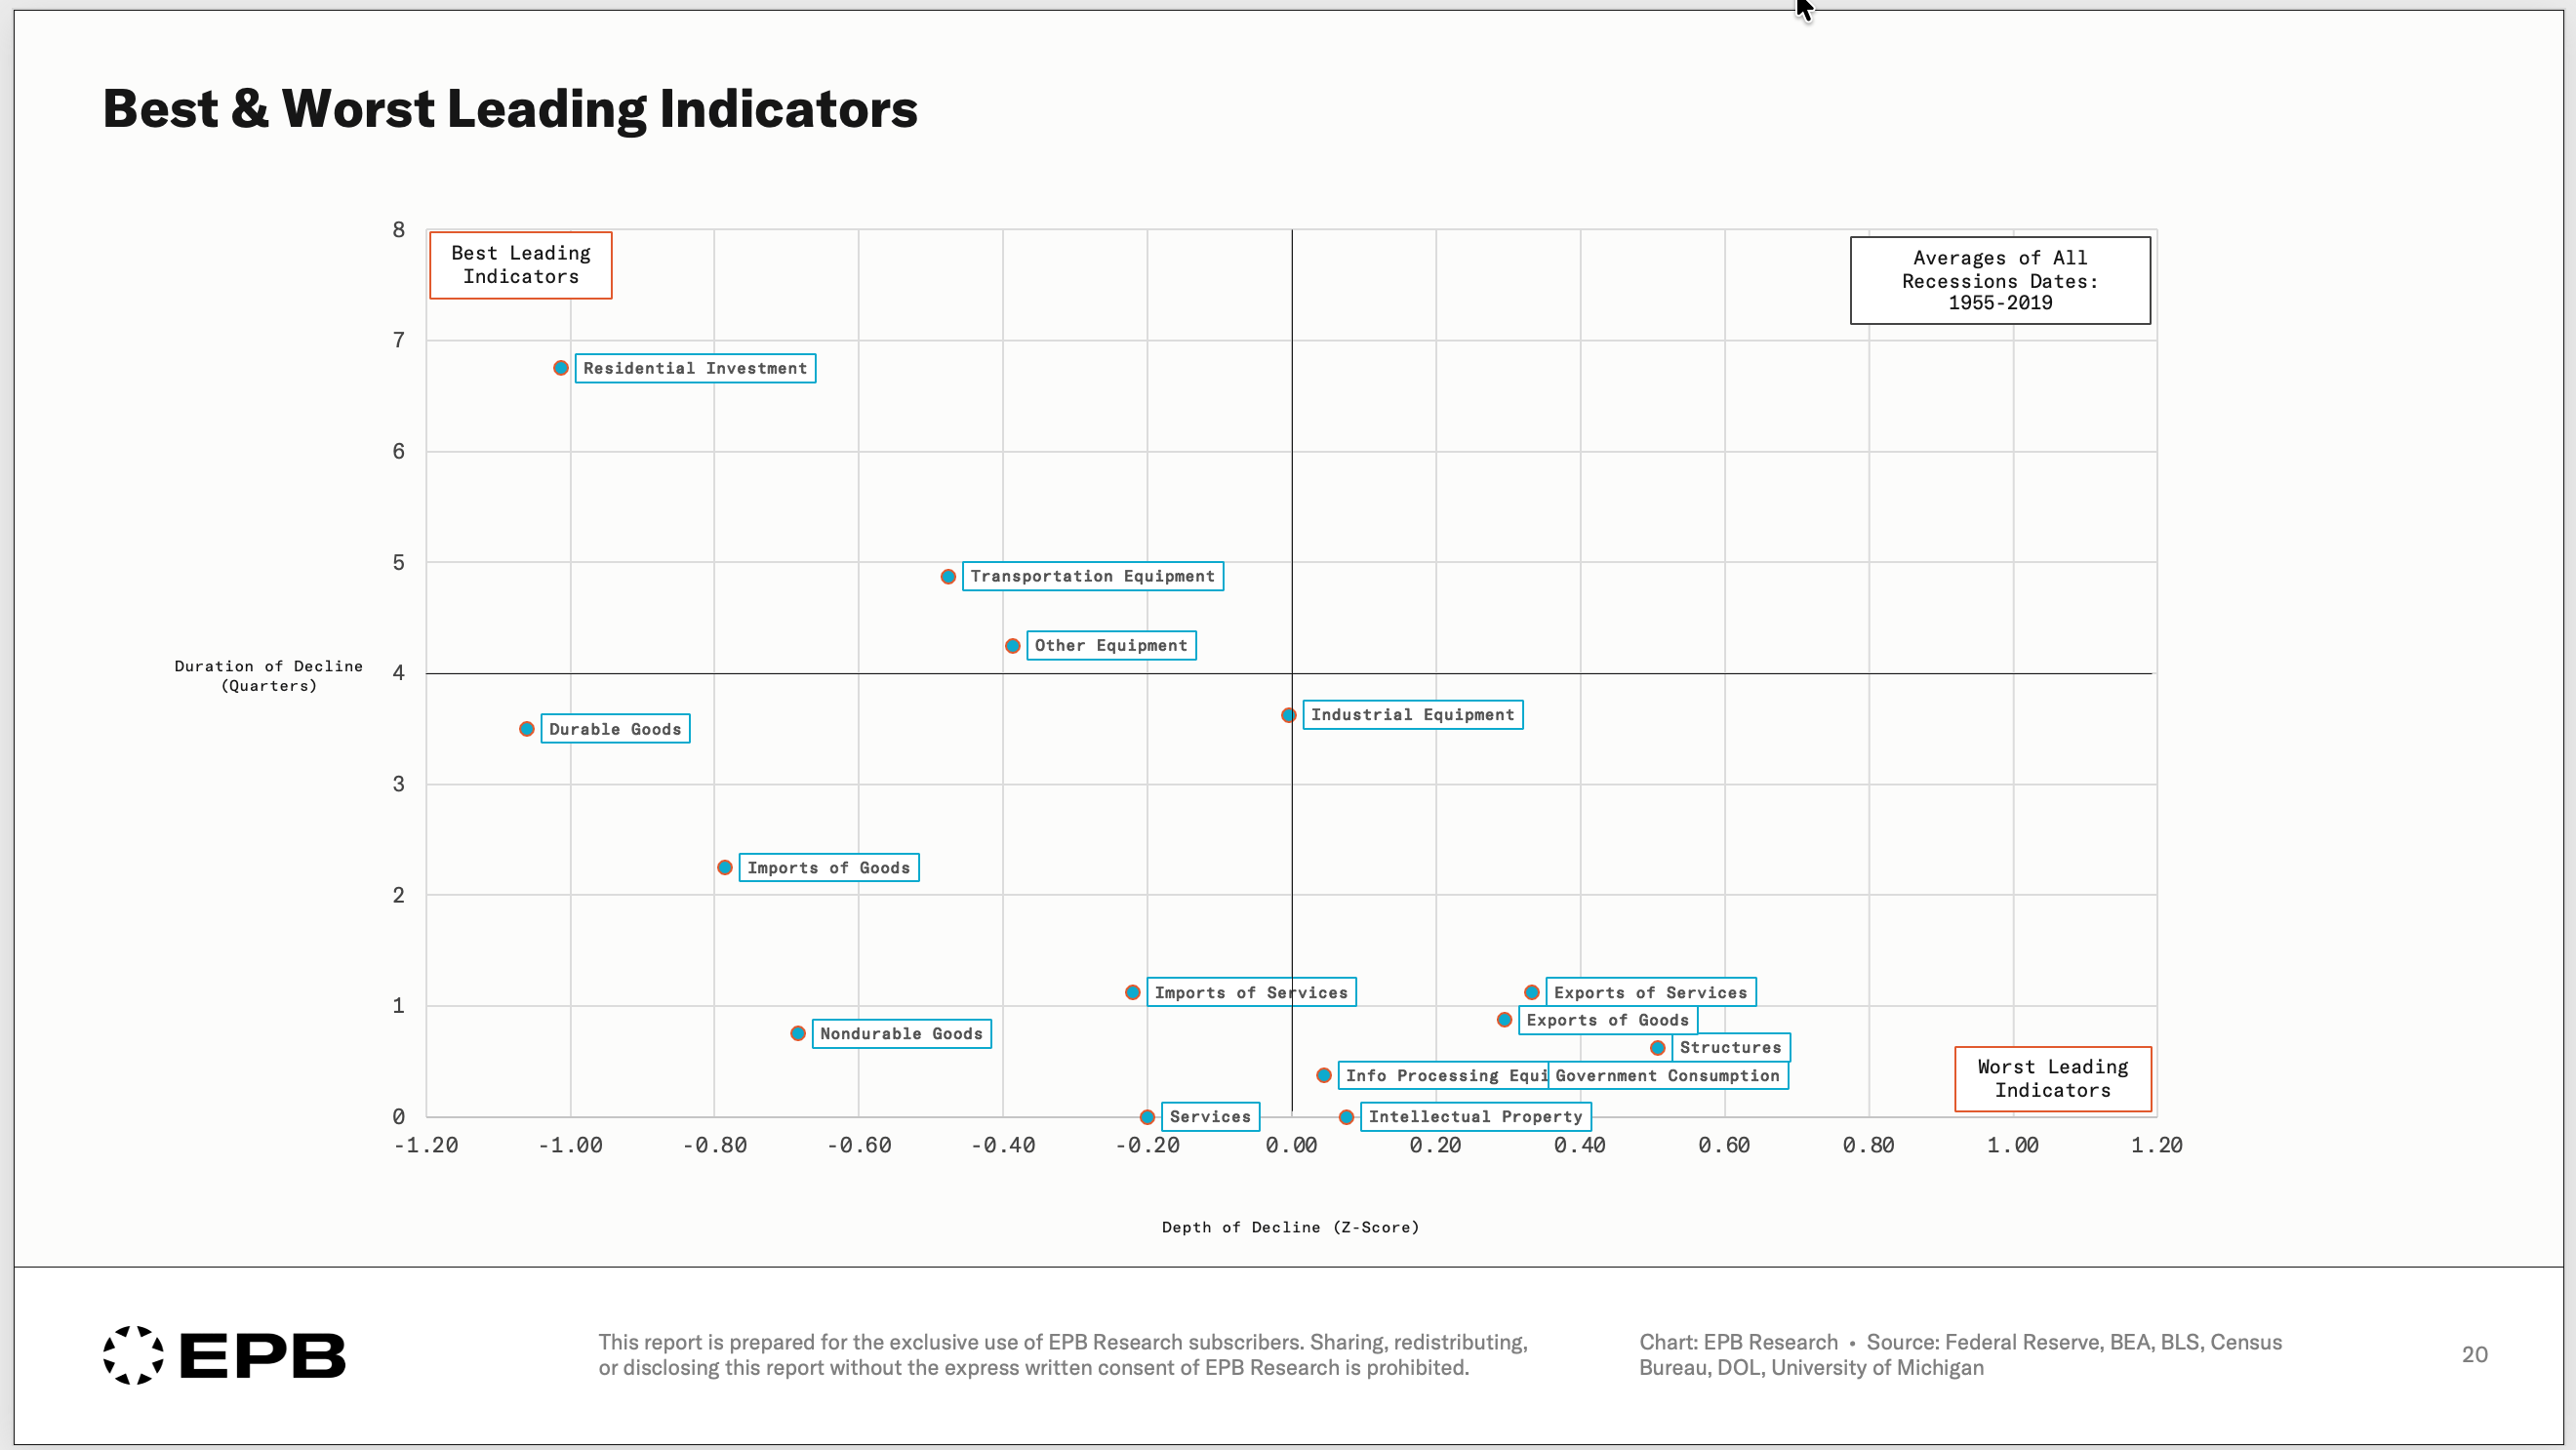
The y-axis shows the duration of decline in quarters or how far in advance each component begins contracting before a recession.
The x-axis shows the depth of decline or how severe the contraction is relative to the component’s historical volatility. Negative Z-scores indicate contractions that are deeper than normal; positive Z-scores indicate components that barely contract or even grow into recessions.
The upper-left quadrant contains the best leading indicators: components that decline both early and deeply.
The lower-right quadrant contains the worst leading indicators: components that decline late, barely at all, or not until well into a recession.
The Best Leading Indicators
In the chart above, a few components of GDP stand out as the best leading indicators.
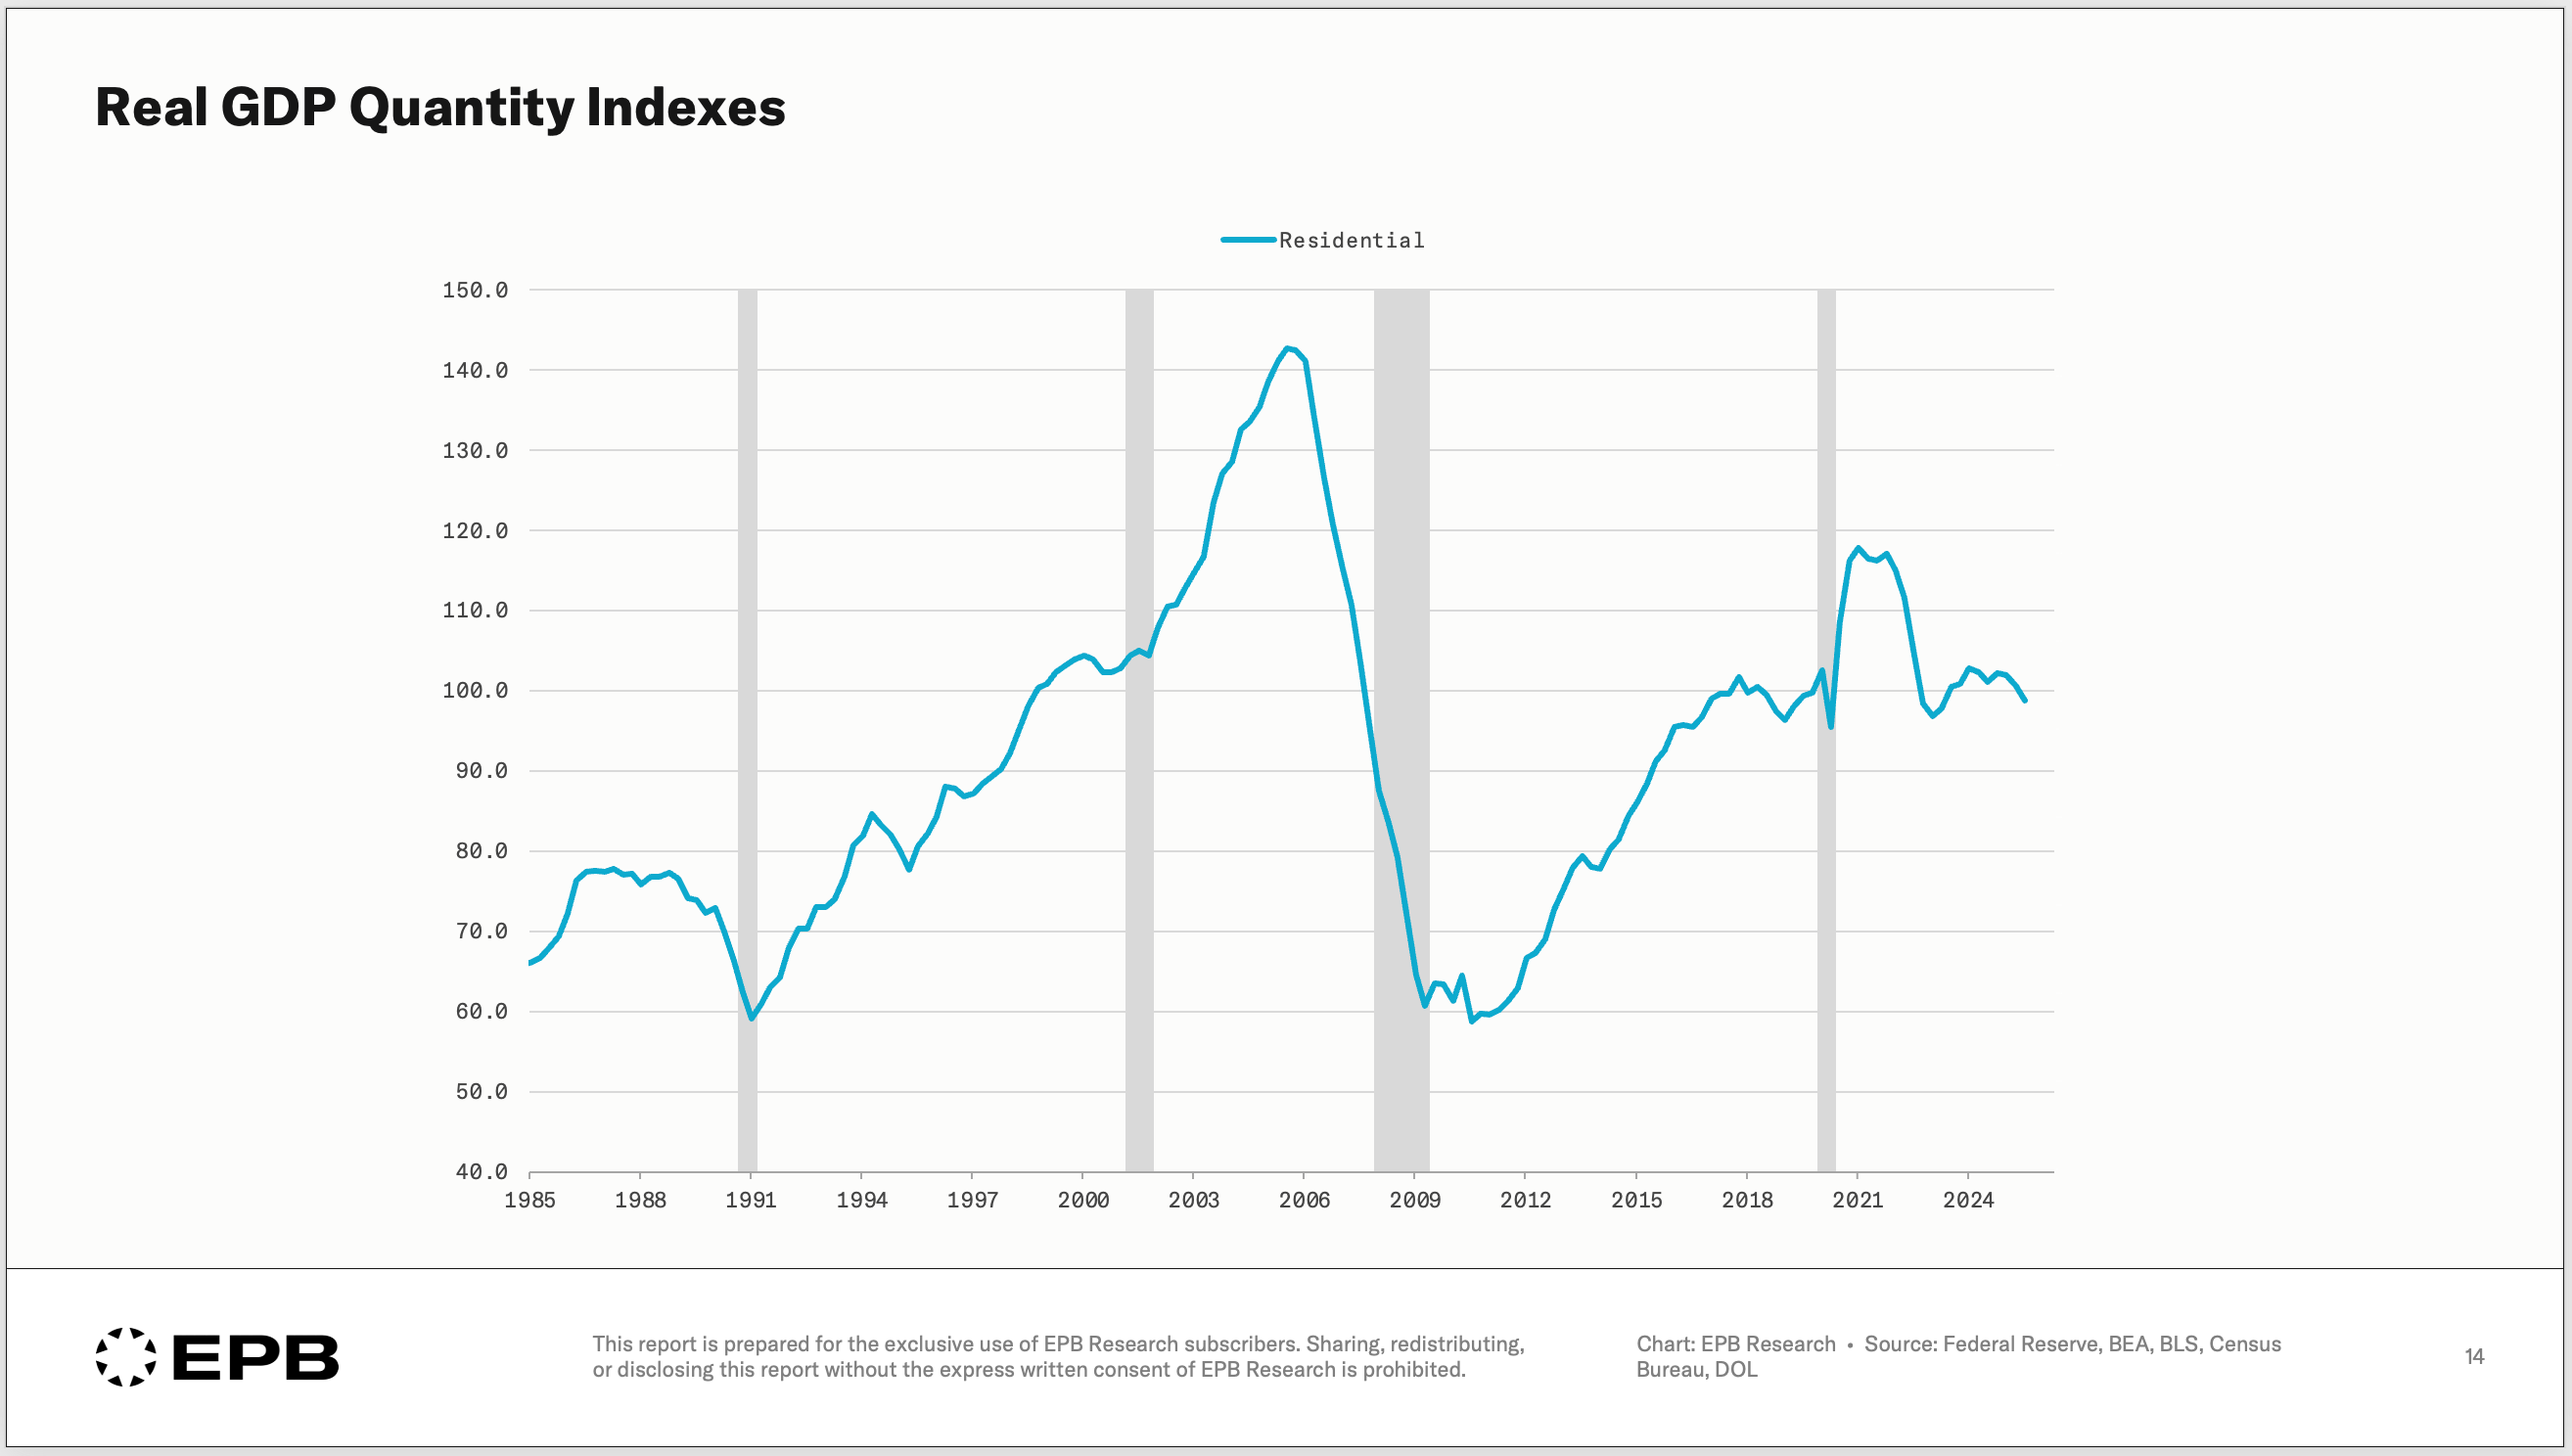
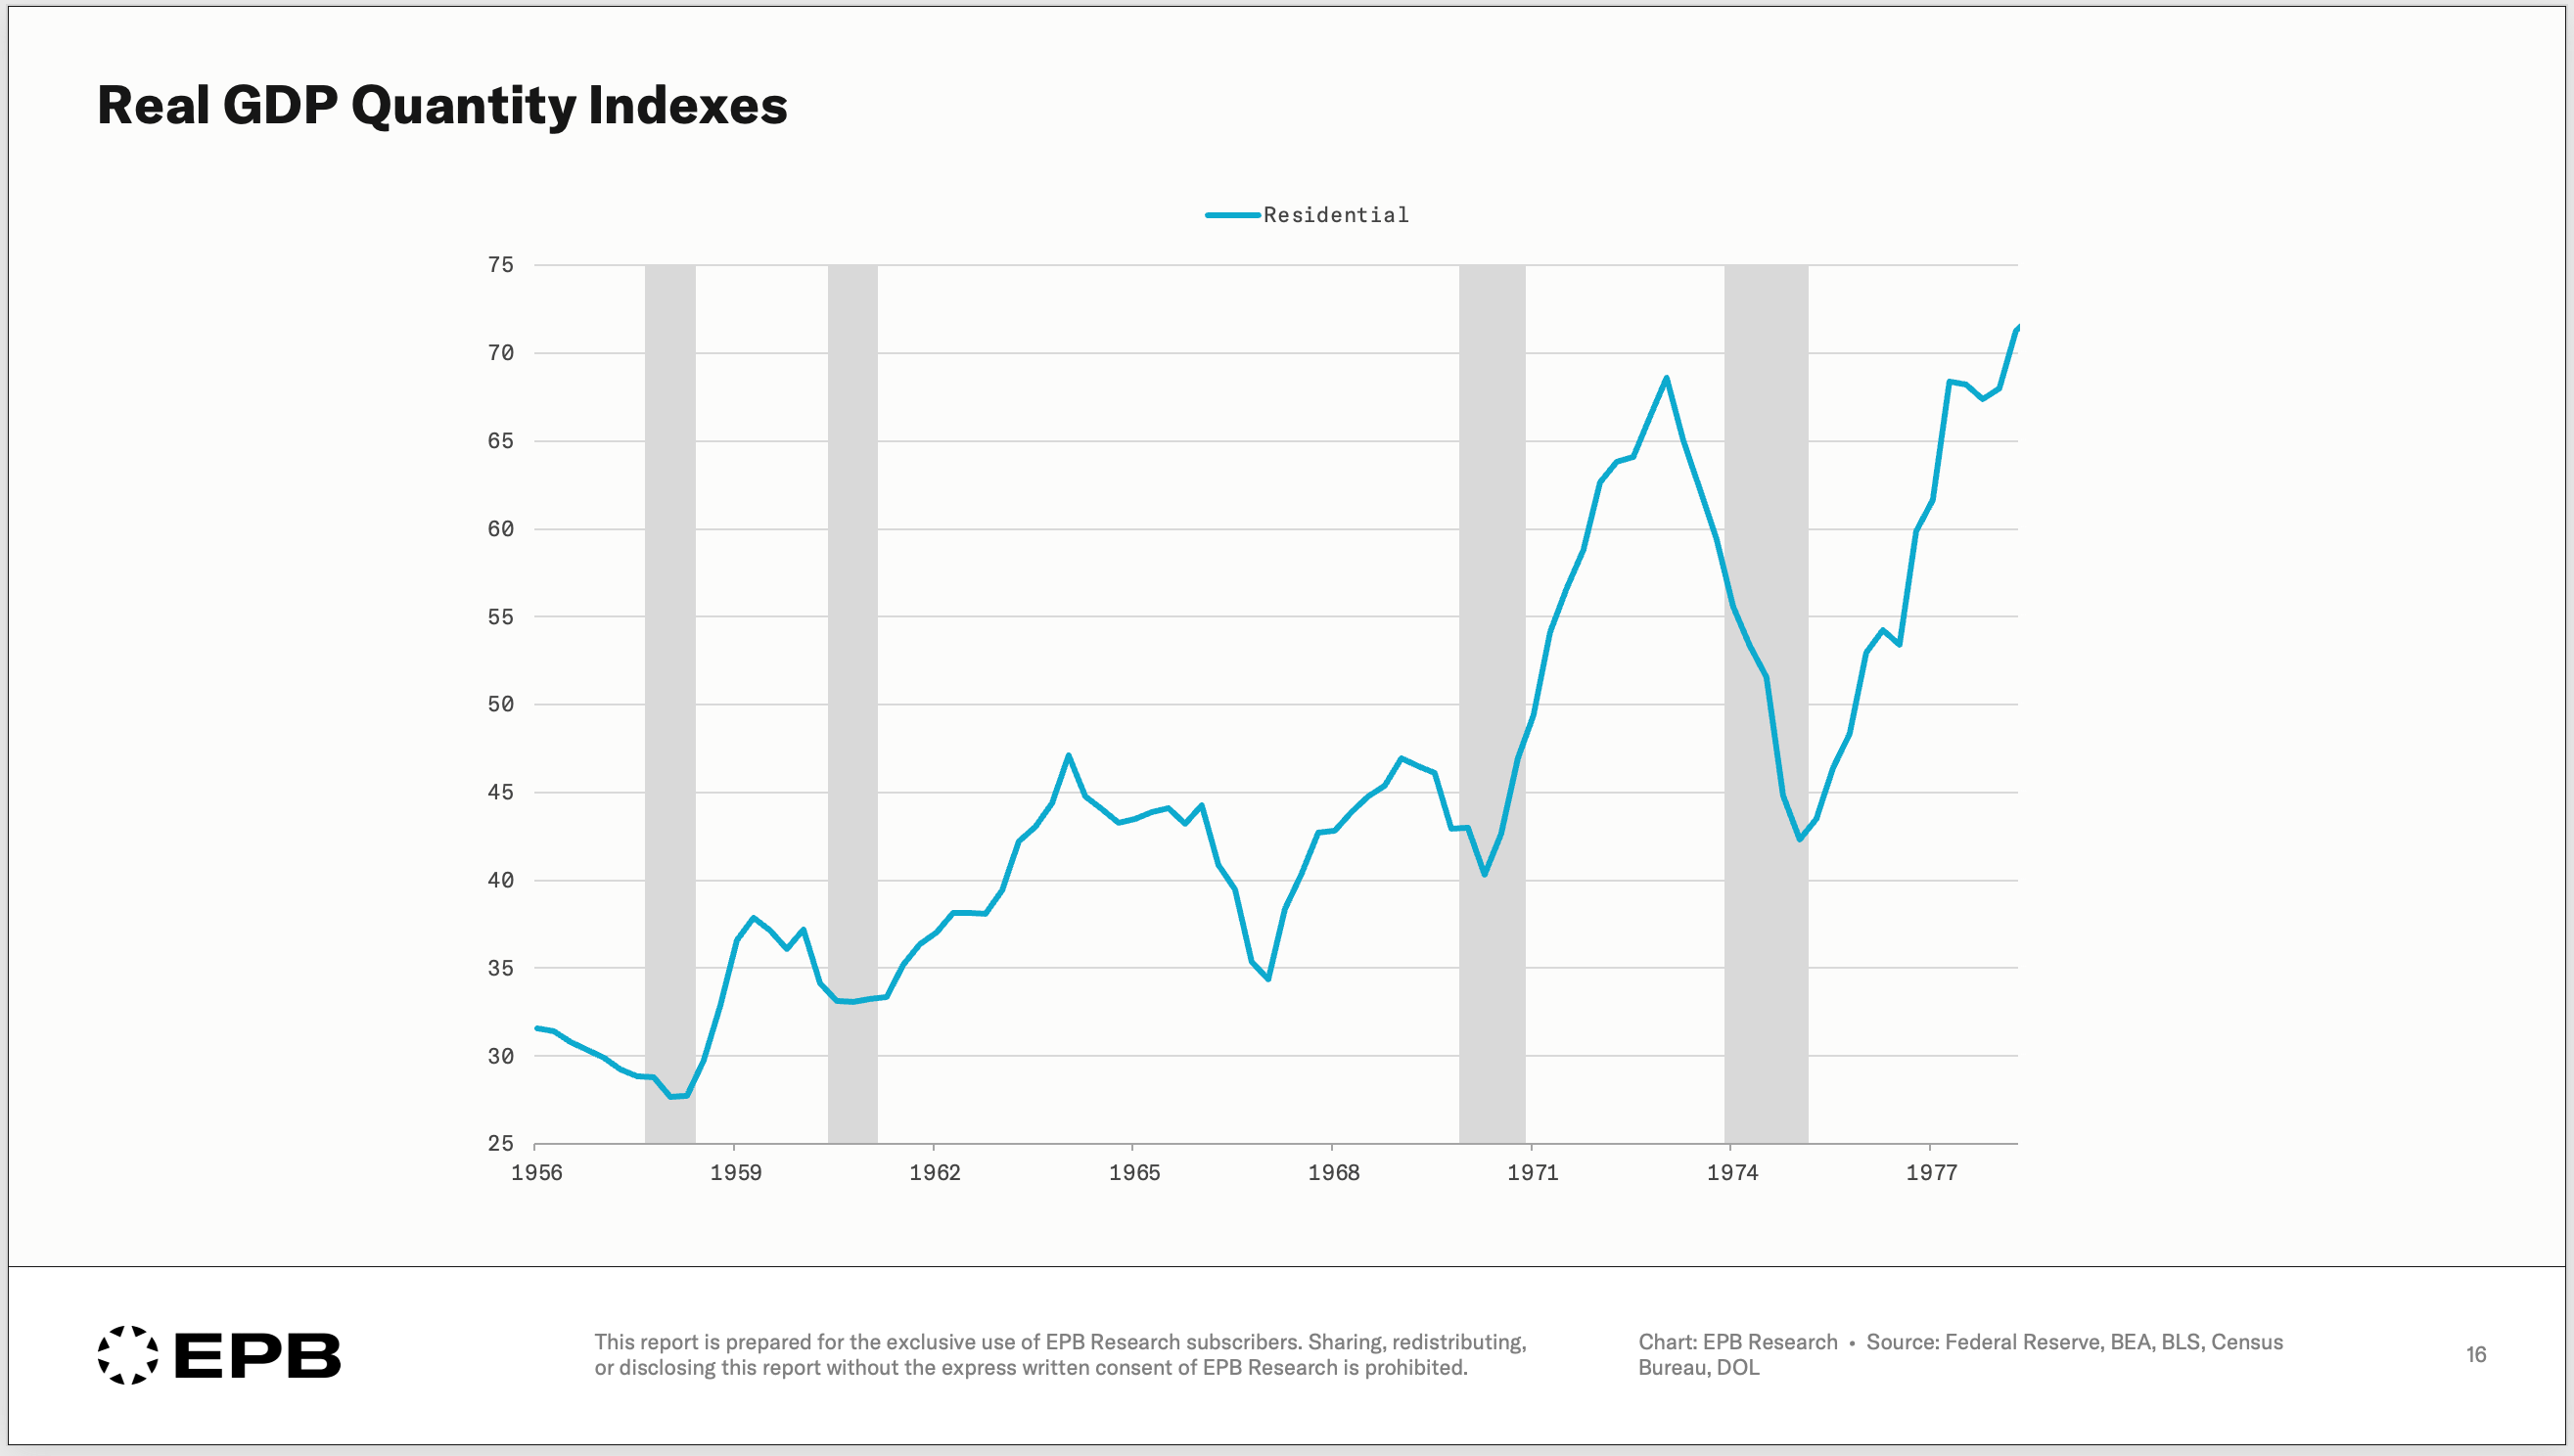
Residential investment: leads by roughly 7 quarters on average and also holds the deepest average contraction heading into recessionary periods. Housing investment is the clear standout as the best leading segment of the economy. It’s often said, “housing is the business cycle,” for this reason.
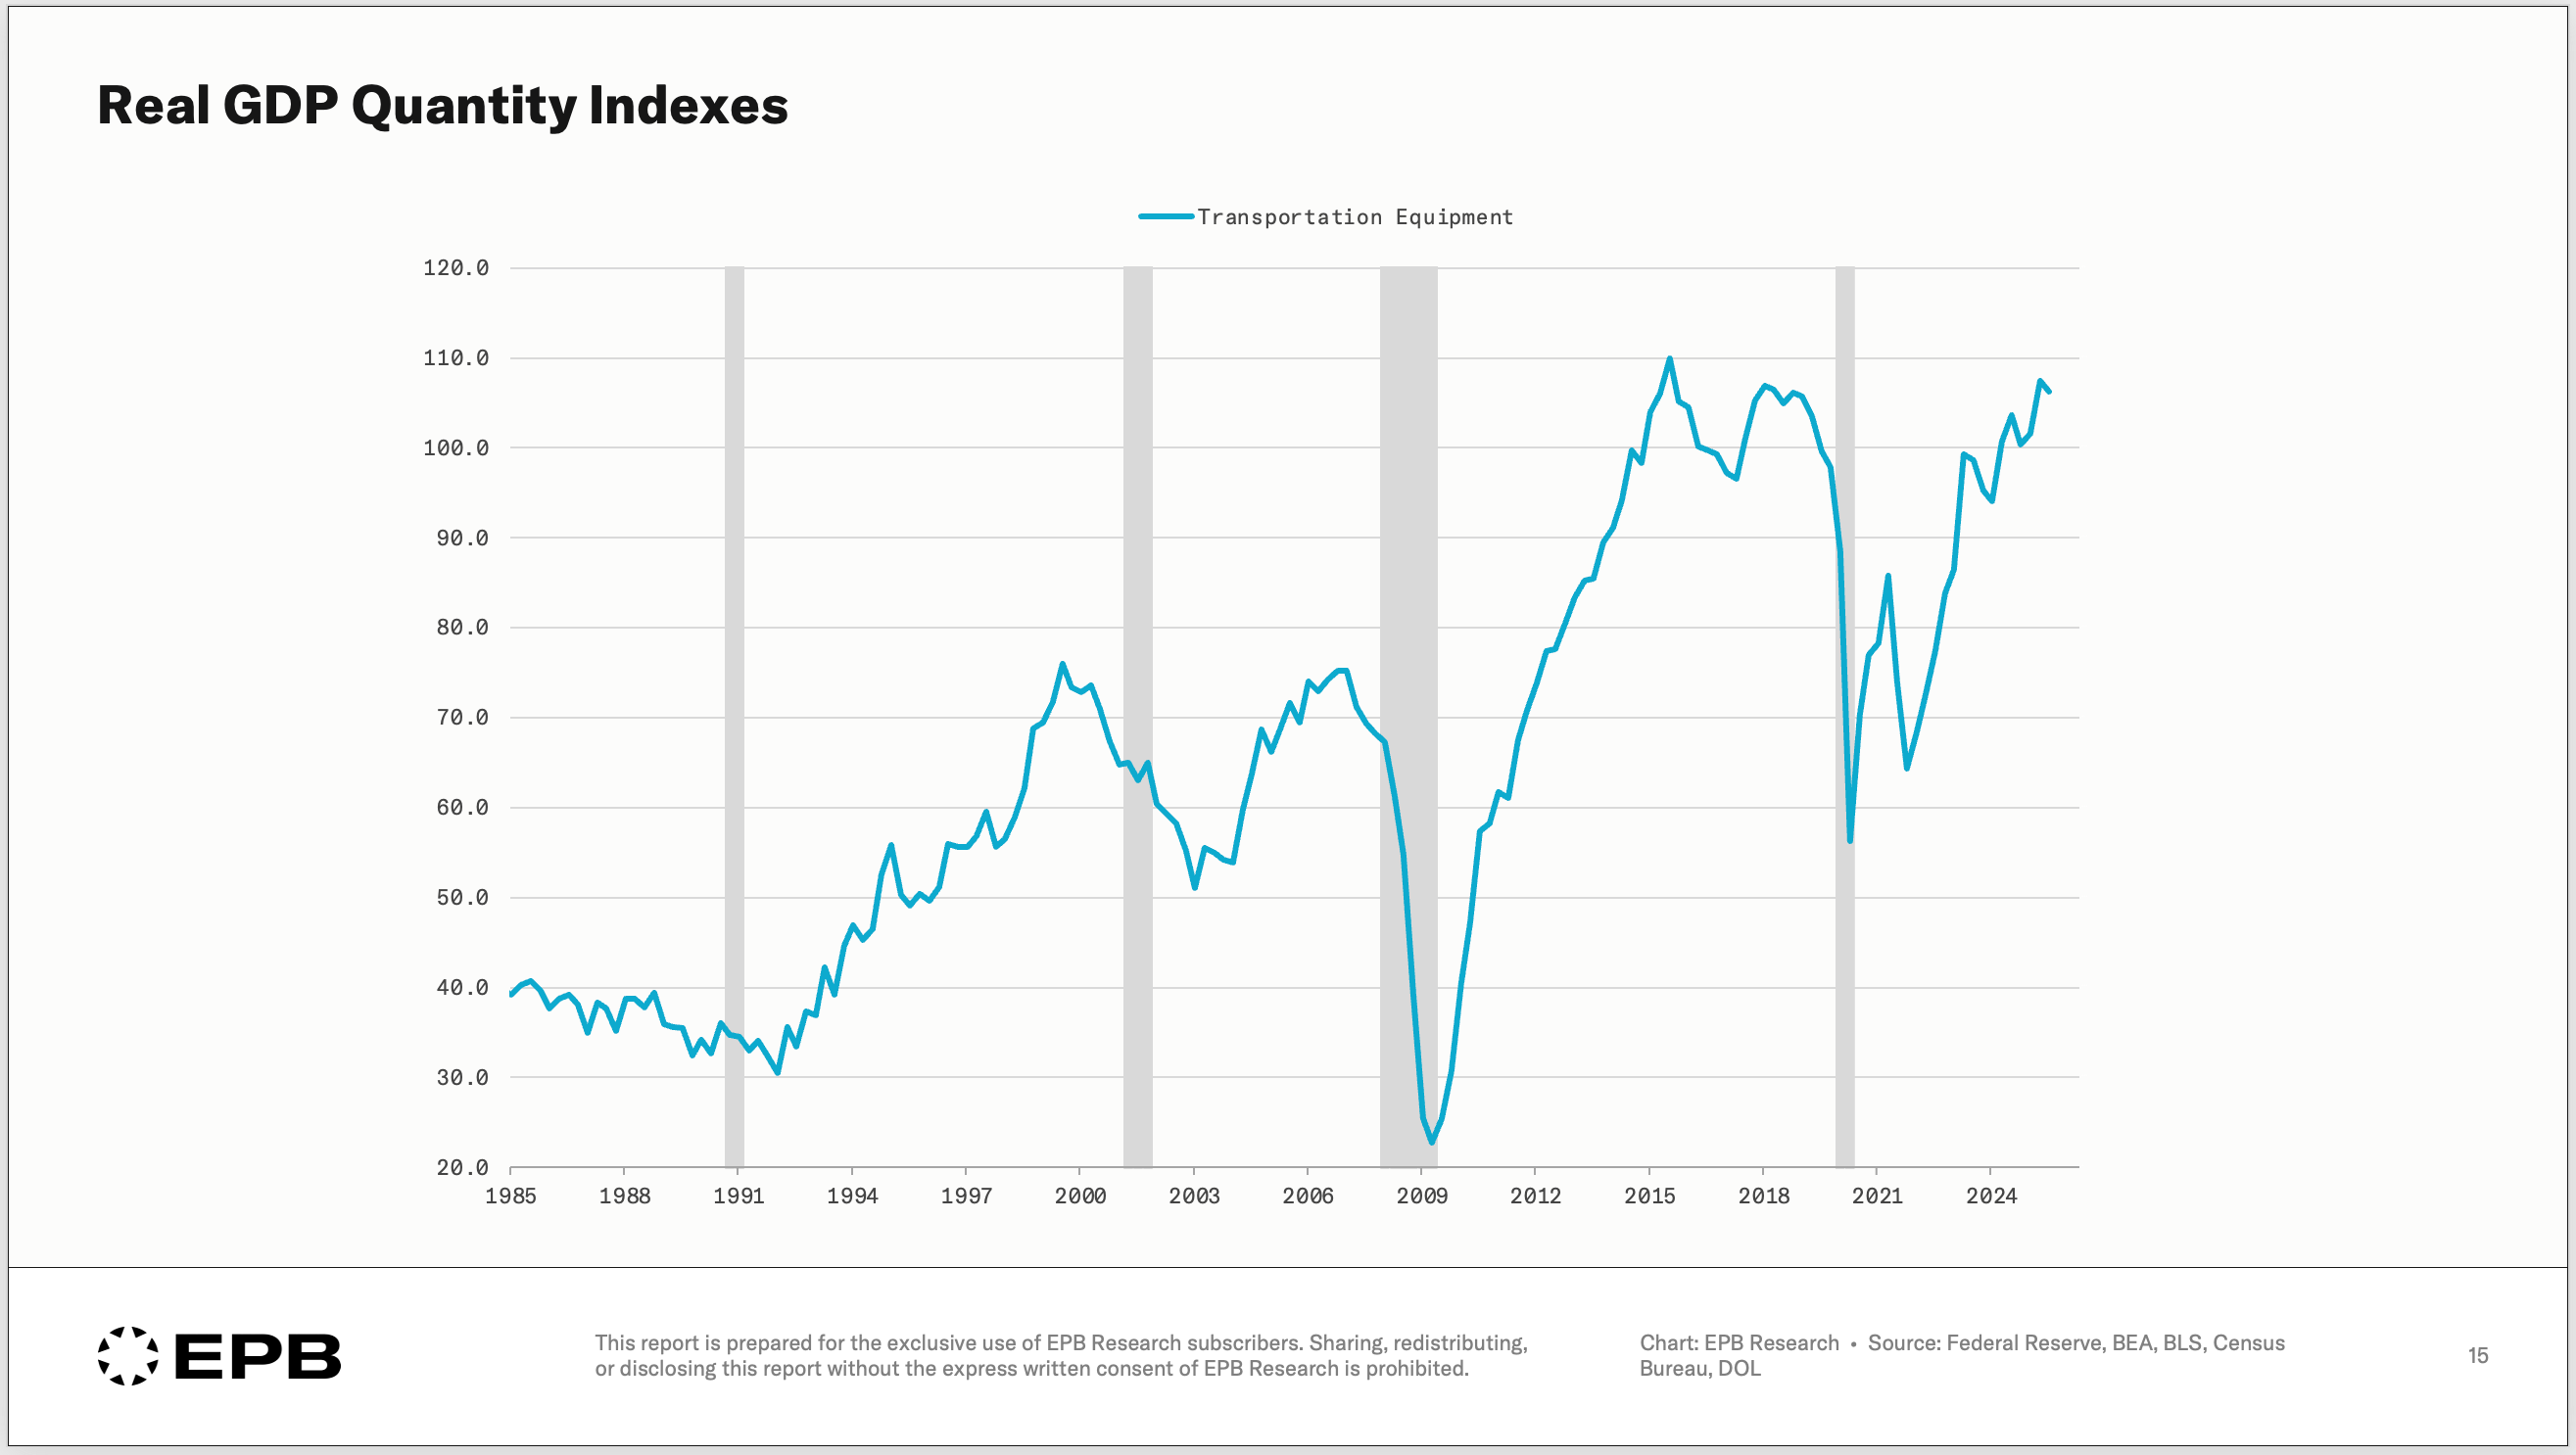
Transportation equipment: leads by roughly 5 quarters on average. The contraction ahead of recessionary periods is not as deep as residential, but the combination of depth and duration still ranks business investment in transportation equipment as the second-best component of the economy for recession forecasting.
Other equipment: this is another component of business investment, declining about 4.5 quarters on average ahead of recessions, with a similar depth of decline as transportation equipment.
Durable goods consumption: leads by about 3.5 quarters with a deep average contraction. Cars, appliances, and furniture are all durable goods items, and these big-ticket consumer purchases are financed with credit and are highly sensitive to interest rates and consumer confidence. Durable goods consumption doesn’t always contract early, but sharp declines are common at the onset of a recession.
These components, residential investment, business equipment investment, and durable goods consumption, are all interest rate sensitive, generally lean more discretionary, and are big-ticket items that are financed.
These three components of GDP are interconnected and empirically the best segments of the economy to watch for early cyclical movements. They are the earliest and deepest movers ahead of recessions. In a previous post, “The 20% of the Economy That Drives 100% of Recessions,” we highlight why this is where investors and economy-watchers should focus. This data provides even more supportive evidence.
The Worst Leading Indicators
Everything in the bottom right corner of the first chart is a poor leading indicator, and these are often the largest segments of the economy.
Non-residential investment in structures is an example of a poor indicator.
Investment in non-residential structures like hospitals, education buildings, and office buildings is a bad indicator because it generally peaks after a recession has already started, unlike residential investment, which offers a 7-quarter lead-time on average.
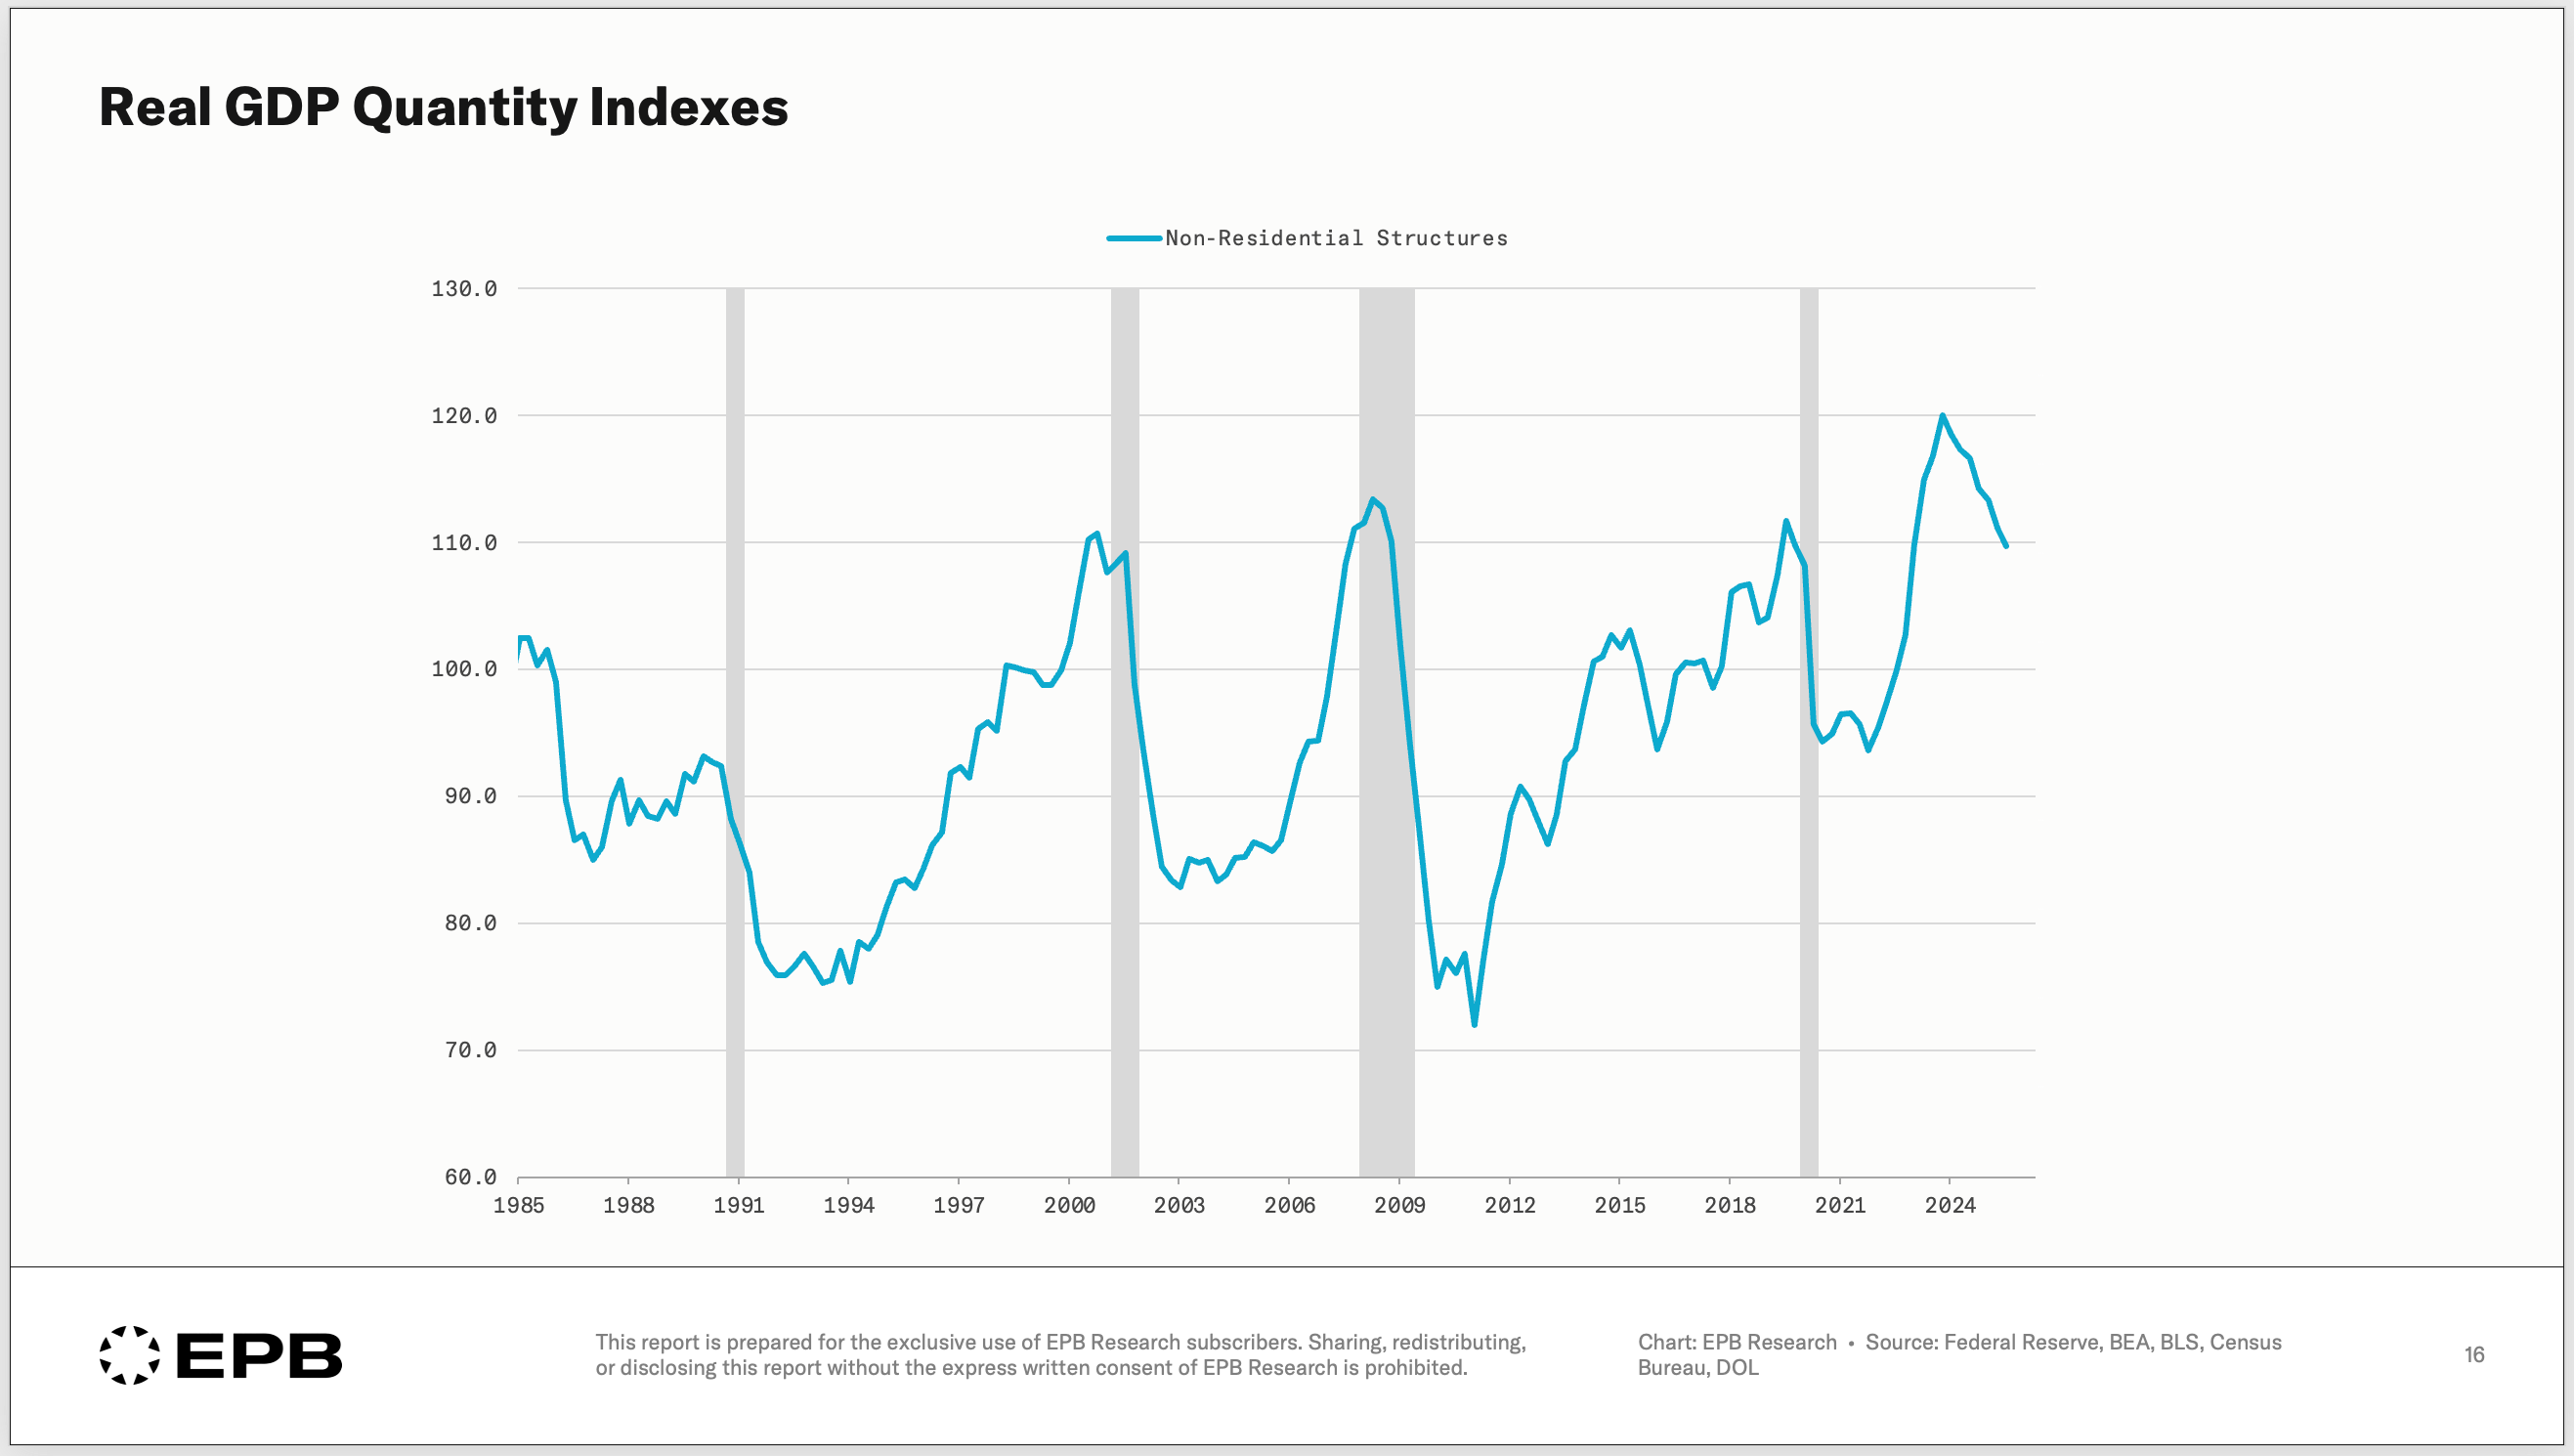
Non-residential investment is a volatile component of GDP and can ultimately make a recession mild or severe, but it is not an early warning sign.
Today’s boom in data center investment falls into this category.
Why This Matters for Economic Analysis
The implications of this ranking are extremely important for those watching the economy and looking to forecast changes in corporate profits or monetary policy.
Make sure you are subscribed to our email list. This will keep you notified of all our latest posts on all platforms, including YouTube and X.
When economic pundits say “the consumer is fine” or “we are a services economy,” they’re pointing to the exact components of GDP that never lead recessions.
These are very large segments of the economy, but when these sectors weaken, the recession is already well underway, and other categories like residential investment or business equipment investment have been contracting for over a year.
This is why conventional economic analysis is always reactive rather than anticipatory.
The important business cycle signal is concentrated in a narrow slice of the economy, the roughly 20% of GDP, that can decline up to 7 quarters in advance. Everything else is noise.
It’s Not All Gravy (Dealing With False Signals)
If residential investment is the best leading indicator with the longest lead time and deepest contraction, why not just watch housing and call it a day?
Because even the best leading indicator comes with false signals.
Residential investment has declined meaningfully outside of recession periods multiple times since 1955.
Take 1967 as an example. There was a big decline in residential investment, but a full recession never transpired. When these false signals occur, it is almost always because profit margins started from an elevated level, and the contraction did not spill over into employment.
In fact, this dynamic is exactly what has transpired over the last 2 years and something we documented in our latest article: Why Leading Indicators Failed This Cycle.
This is why it's never a good idea to use only one indicator. A basket approach helps eliminate these false signals, or taking the combined signal from residential investment, business equipment investment, and durable goods consumption.
This cycle also highlighted an important lesson about watching profit margins in cyclical industries like residential construction and in the broader economy.
High margins create resilience. Low margins create fragility. The same demand shock can have wildly different employment effects depending on where margins started.
The Bottom Line
Not all economic indicators are equal.
Residential investment, transportation equipment, and durable goods consumption lead recessions by quarters and contract sharply, offering strong, easier-to-spot signals.
Services consumption, investment in non-residential structures, and government consumption barely move until a recession is already underway, and sometimes, not at all.
Far and away the best sector of the economy to track is housing, but false signals are a genuine concern. Tracking a basket or a combination of the top leading components can help with this problem.
Also, having a good understanding of profit margin dynamics can inform you of the fragility in the economy and whether a recession can develop quickly or require longer bouts of monetary and credit contractions.
If your analysis is dominated by the 80% of the economy that doesn’t lead, you’ll always be late. Focus on The 20% of the Economy That Drives 100% of Recessions.
Track the Leading Indicators With EPB Research
This post provides the empirical foundation for the EPB Research framework. Our subscribers receive regular updates on the leading components of GDP and a process for contextualizing each data release within the broader Business Cycle Sequence.
If you found this blog post helpful, subscribe to our email list for notifications of more posts like this on all platforms, including YouTube and X.
See you in the next post!
This below is not related to the above post but i thought it may be of general interest to the author and subscrbers:
The Generalized Dutch Disease Evidence from the cross-section of US states
Policy Tensor
https://policytensor.substack.com/p/the-generalized-dutch-disease?utm_source=post-email-title&publication_id=266059&post_id=188292146&utm_campaign=email-post-title&isFreemail=true&r=6mos7&triedRedirect=true&utm_medium=email
His thesis; the fracking- finance and computing booms were/are at the expense of US manufacturing exports.
Great article - thanks Eric!