

2001 Recession: The Warning Signs Hiding in Plain Sight
Business equipment investment started to collapse in 2000 while GDP growth looked fine. Here's why tracking cyclical sectors always beats watching headline numbers.

The United States entered recession in March 2001, but the warning signs were visible more than 12 months earlier.
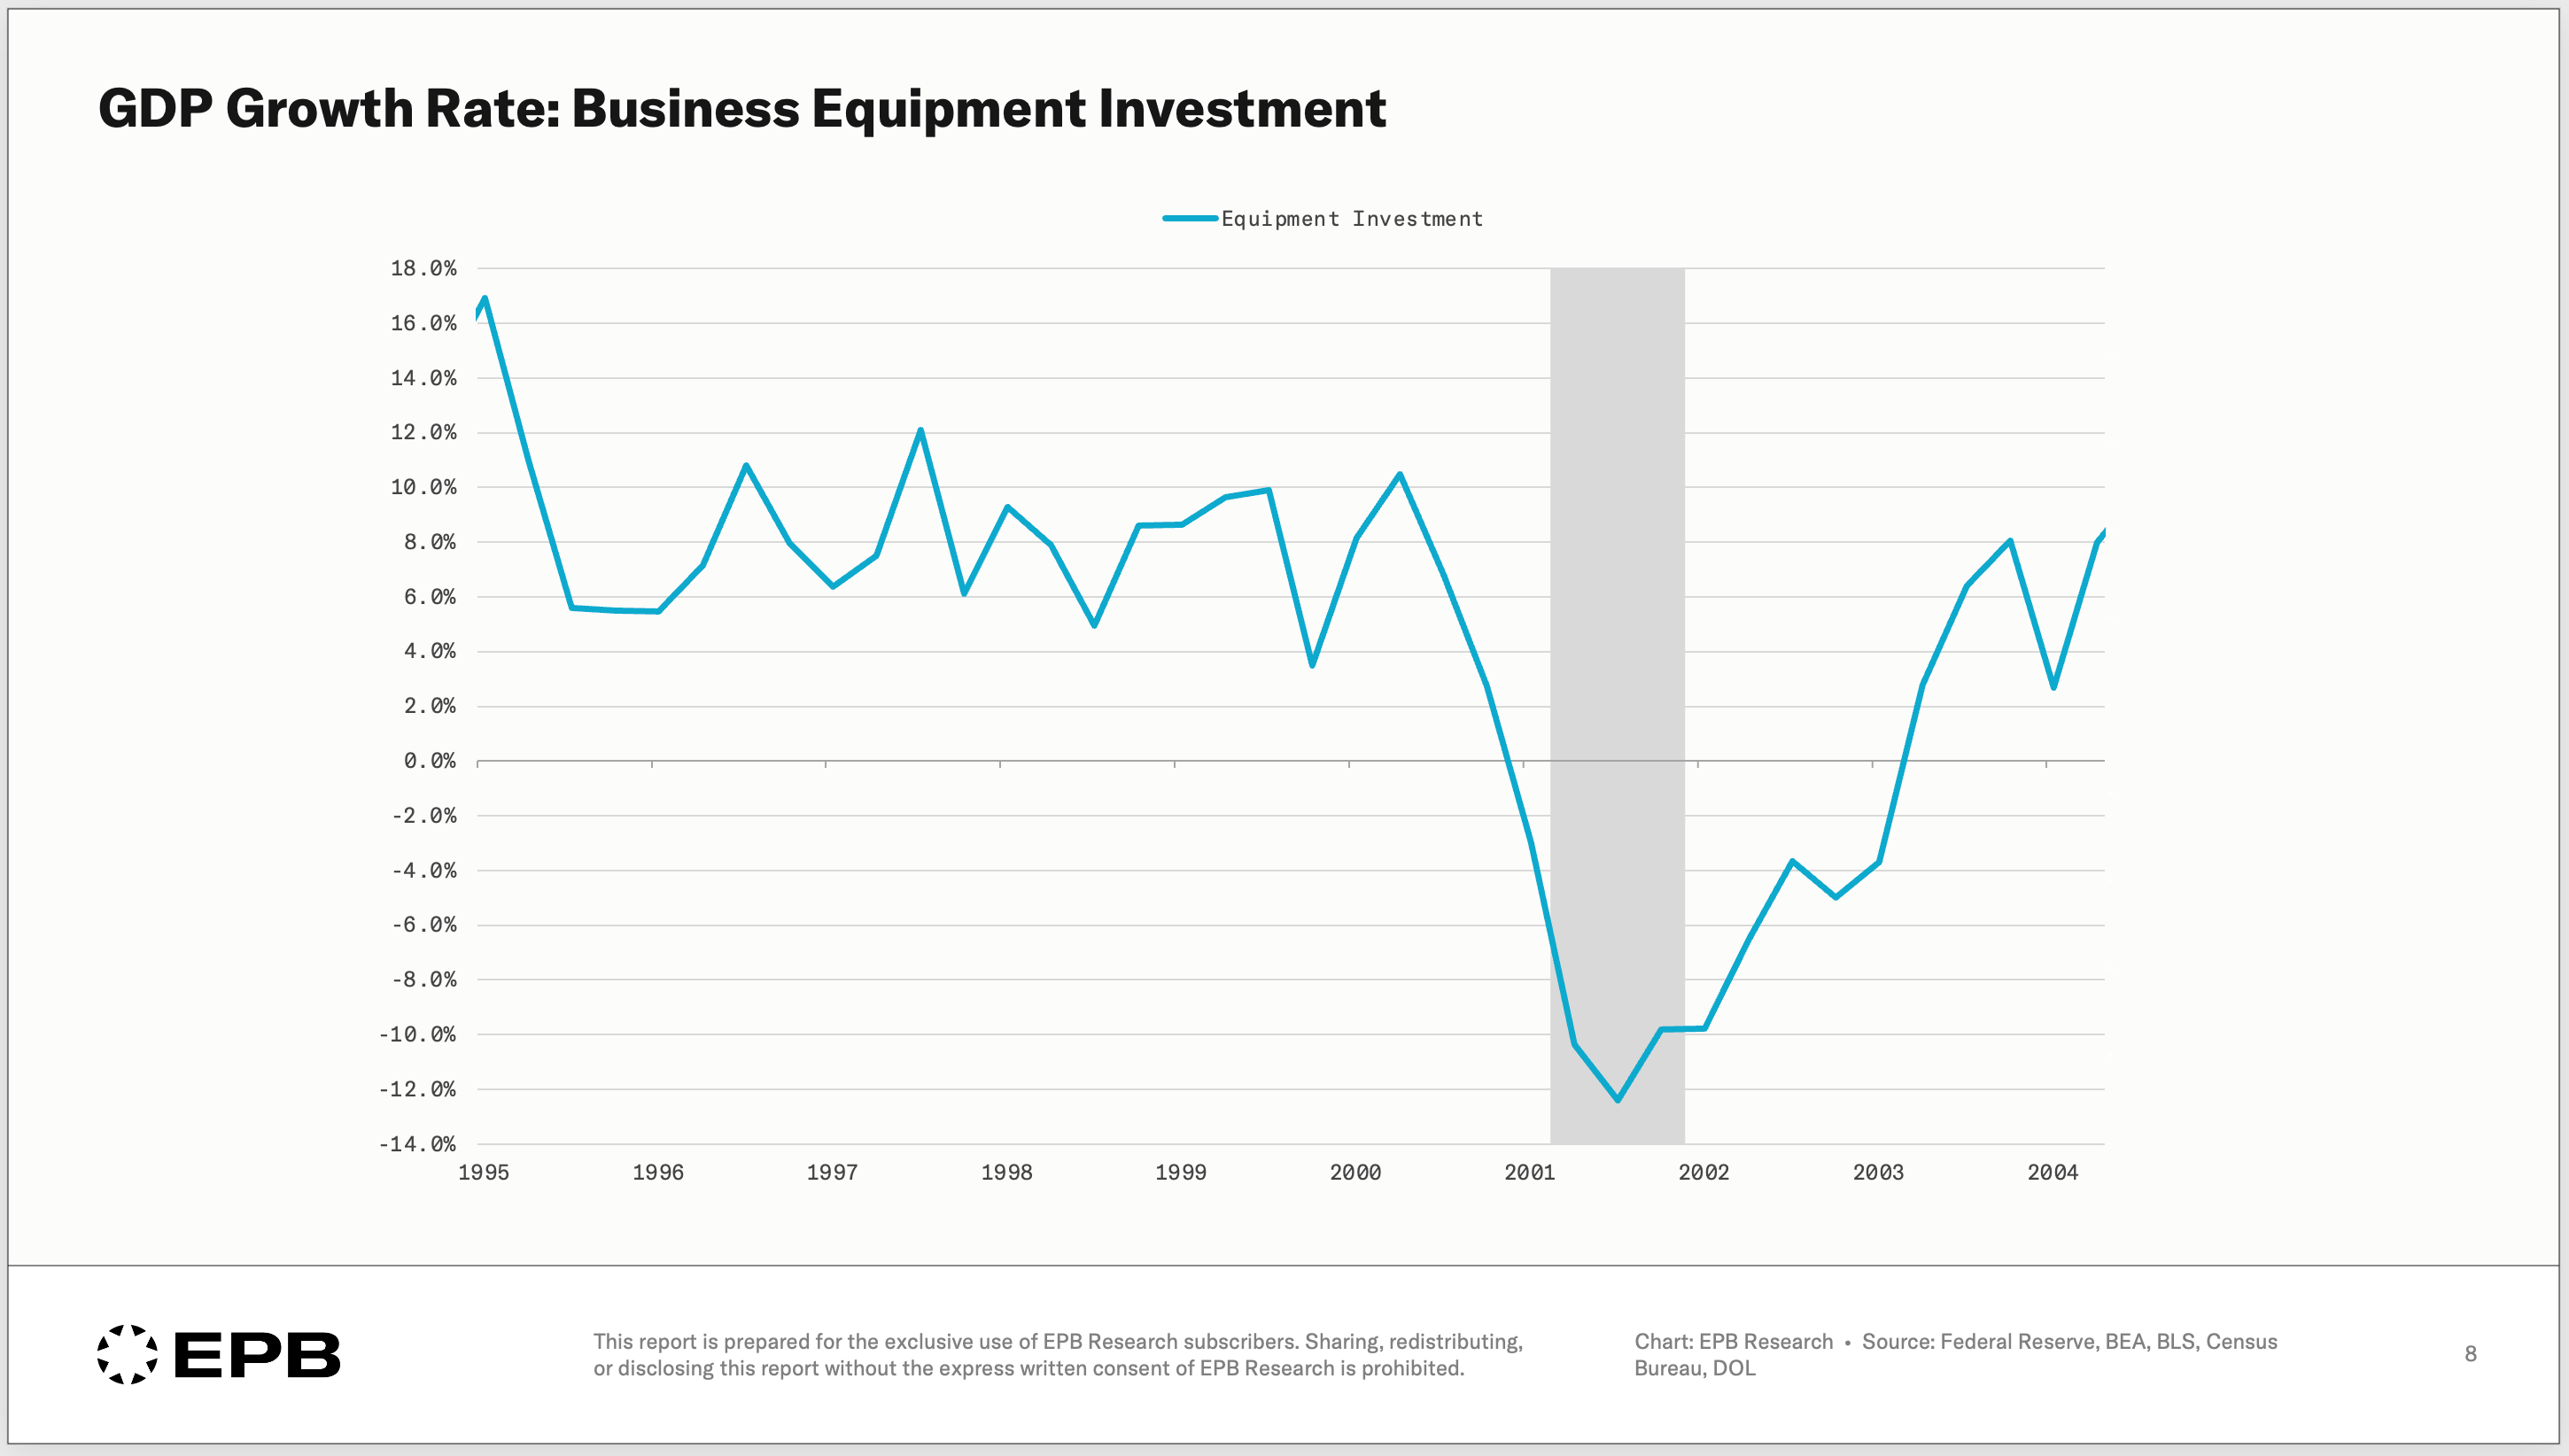
While most economists, Fed watchers, and media pundits focus on headline GDP, which was growing over 6% in nominal terms in 2000, business equipment investment was beginning to collapse.
In December 2000, the unemployment rate was 3.8%, and in March 2001, the unemployment rate was 4.3%, lower than today’s level.
Just like the 2008 recession, the 2001 economic downturn was predictable by focusing on the correct sectors, the 20% of the economy that drives 100% of recessions.
In previous posts, we highlighted the importance of Cyclical GDP: three narrow sectors of the economy that drive all the economic booms and busts.
In this post, we highlight why monitoring cyclical GDP helped predict the 2001 downturn and how focusing on the headline statistics used by most economic watchers was a costly mistake.
What Everyone Watches (And Why It’s Wrong)
The two most popular metrics, frequently cited by the Federal Reserve and major financial outlets, are GDP and the unemployment rate. These two metrics are used as barometers of economic health, and to some extent, this is true.
These are not flawed metrics in the sense that they are incorrect, but they do not tell us where the economy is heading. In fact, they tell you how the economy was doing slightly in the past.
Throughout the year 2000, leading up to the March 2001 recession start date, nominal GDP growth averaged over 6%. Wall Street consensus confidently declared the economy was booming.
These calls were emboldened by the fact that the unemployment rate was 3.8% in December 2000, just four months before the recession officially started.
The Federal Reserve, misled by these measures into conducting forward-looking policy, raised interest rates through March 2000 and did not begin lowering them until January 2001, when the recession was already entrenched.
Even worse and more dangerous, something done frequently today, is conducting monetary policy or making economic forecasts based on the stock market.
In September 2000, the S&P 500 was at an all-time high, and the high-flying Nasdaq was only down about 13% - a drawdown level that we’ve seen three times in the last three years.
Waiting for these metrics to sour, as many often do, will lead to a very late recognition of economic changes, as shifts in the economy occur beneath the surface, in only a few interest-rate-sensitive parts of the economy that respond forcefully to prior changes in monetary policy.
The Data That Matters
Headline GDP is an aggregate measure that includes some highly stable areas of the economy, such as healthcare spending, education, and government services.
These stable parts of the economy are often the largest in size, so they can mask weaknesses that develop in the smaller yet more cyclical parts of the economy.
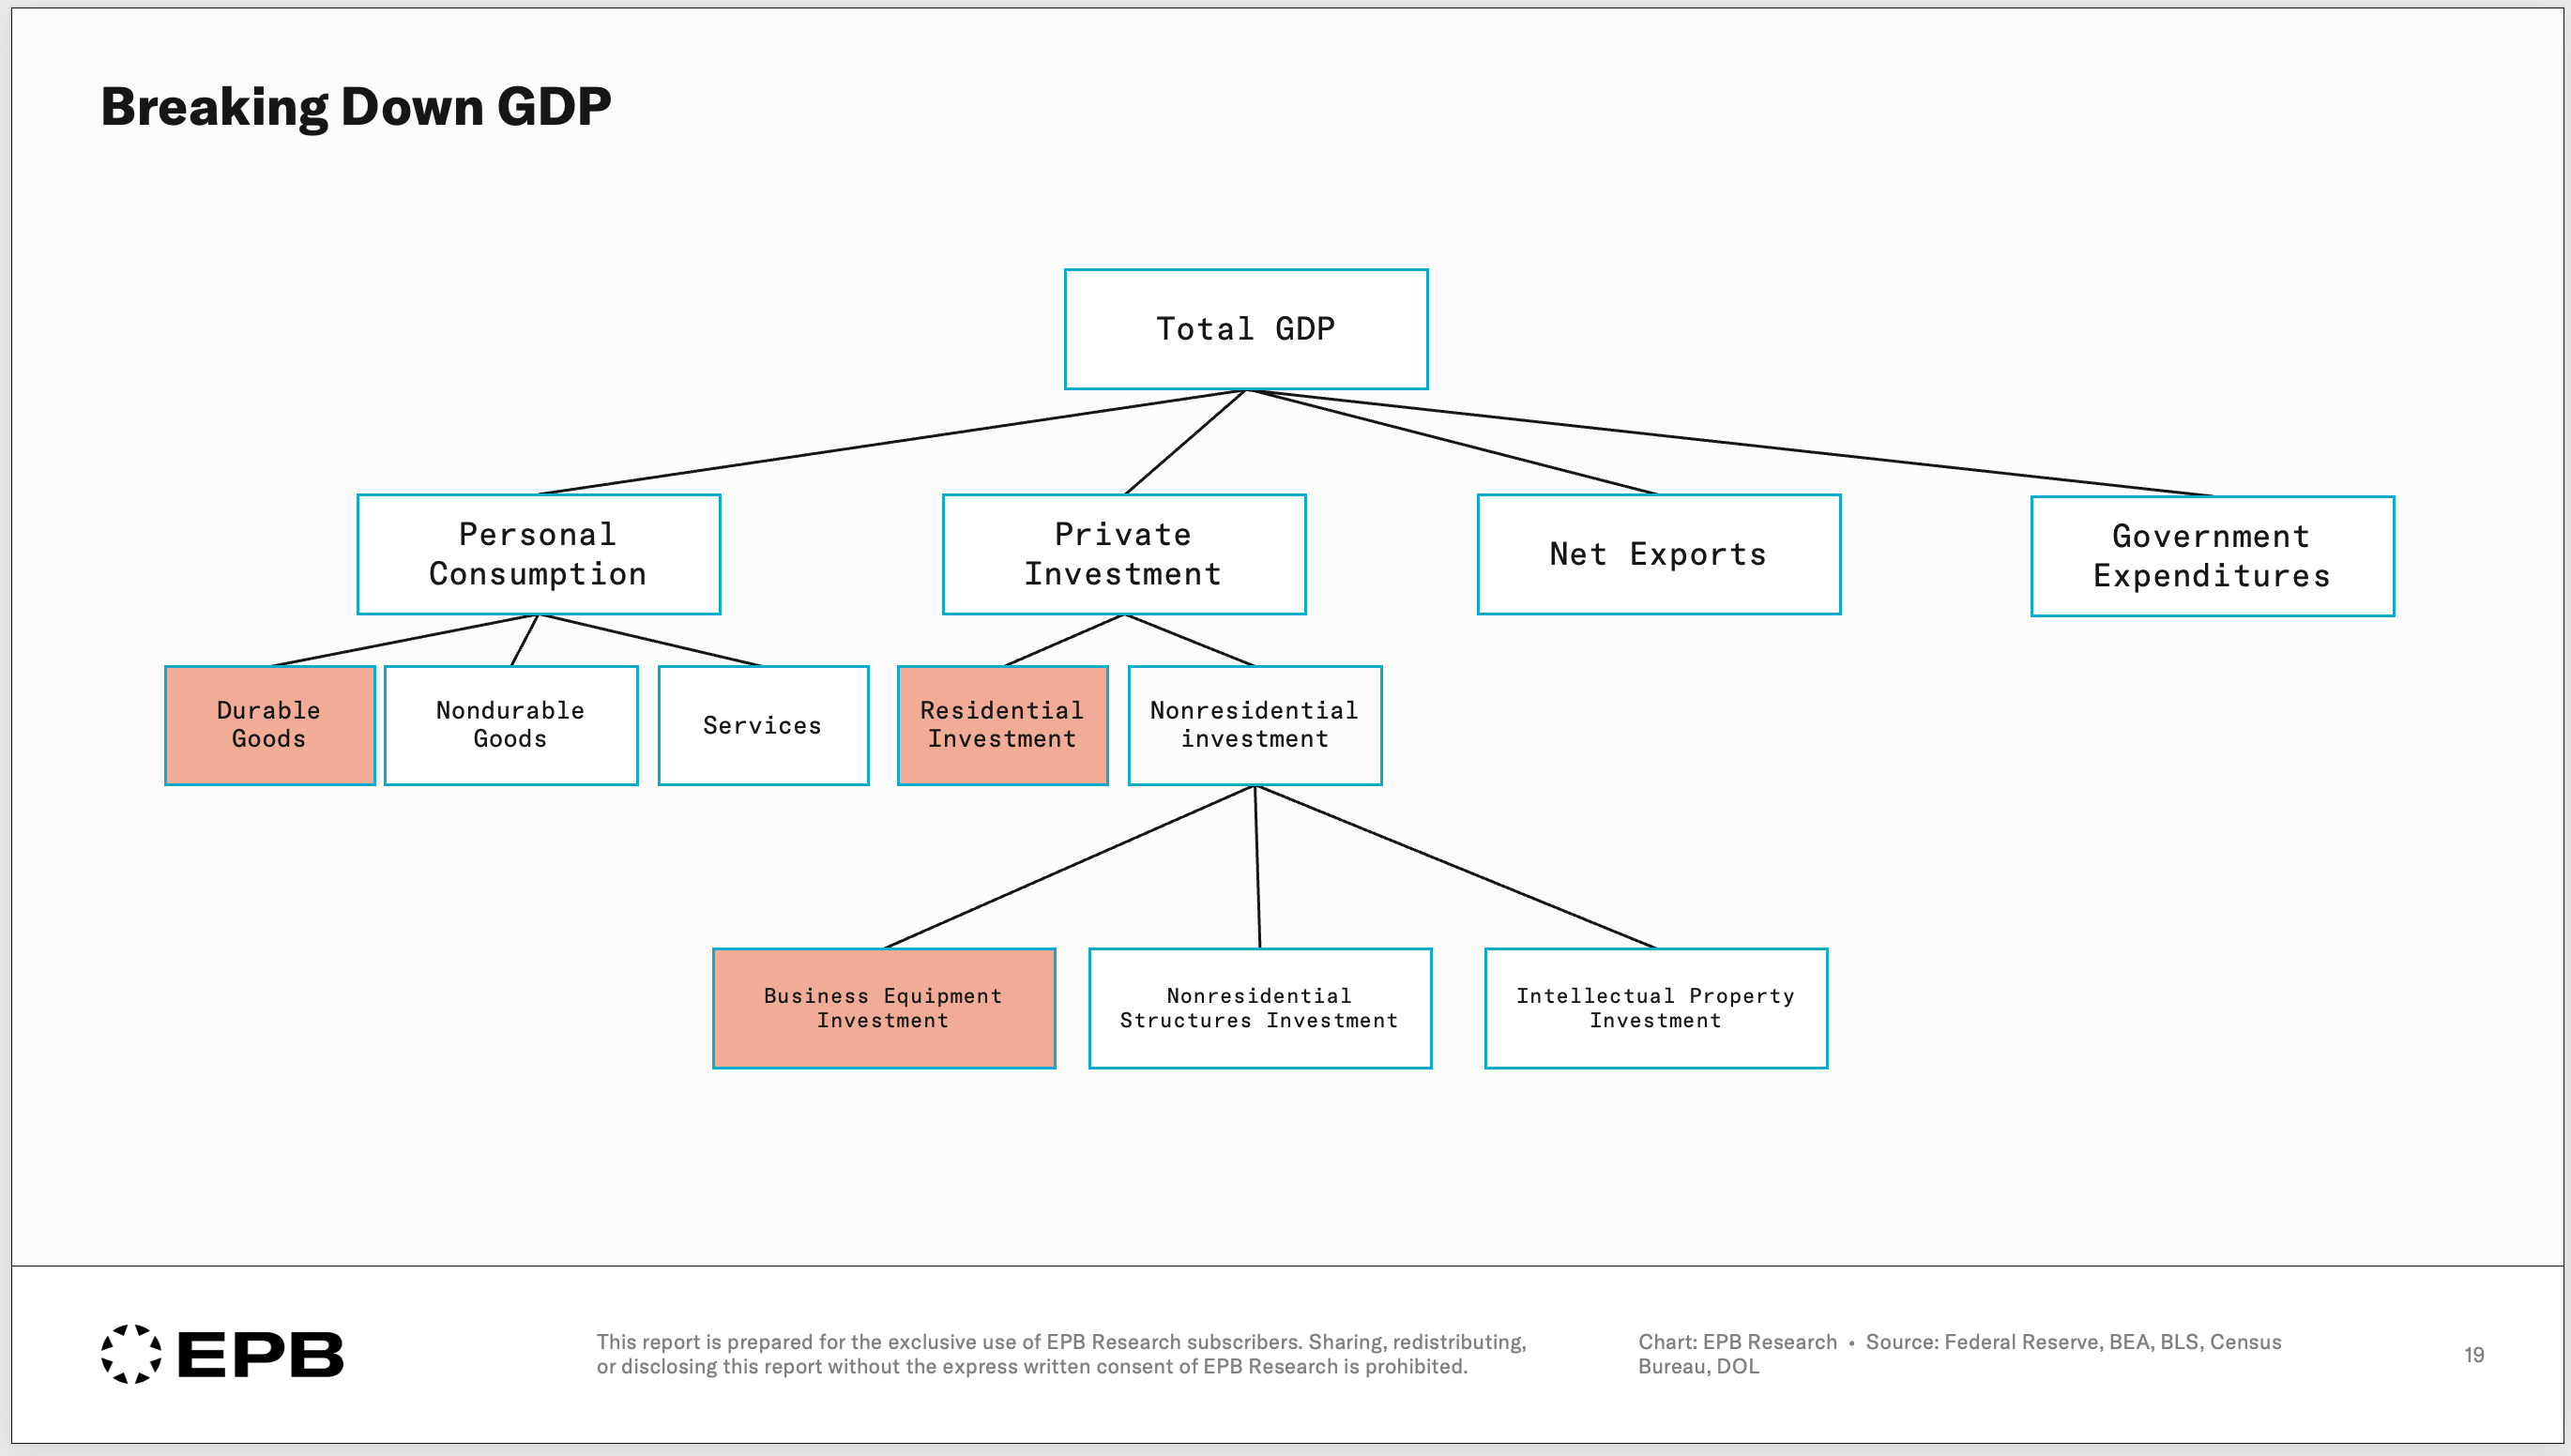
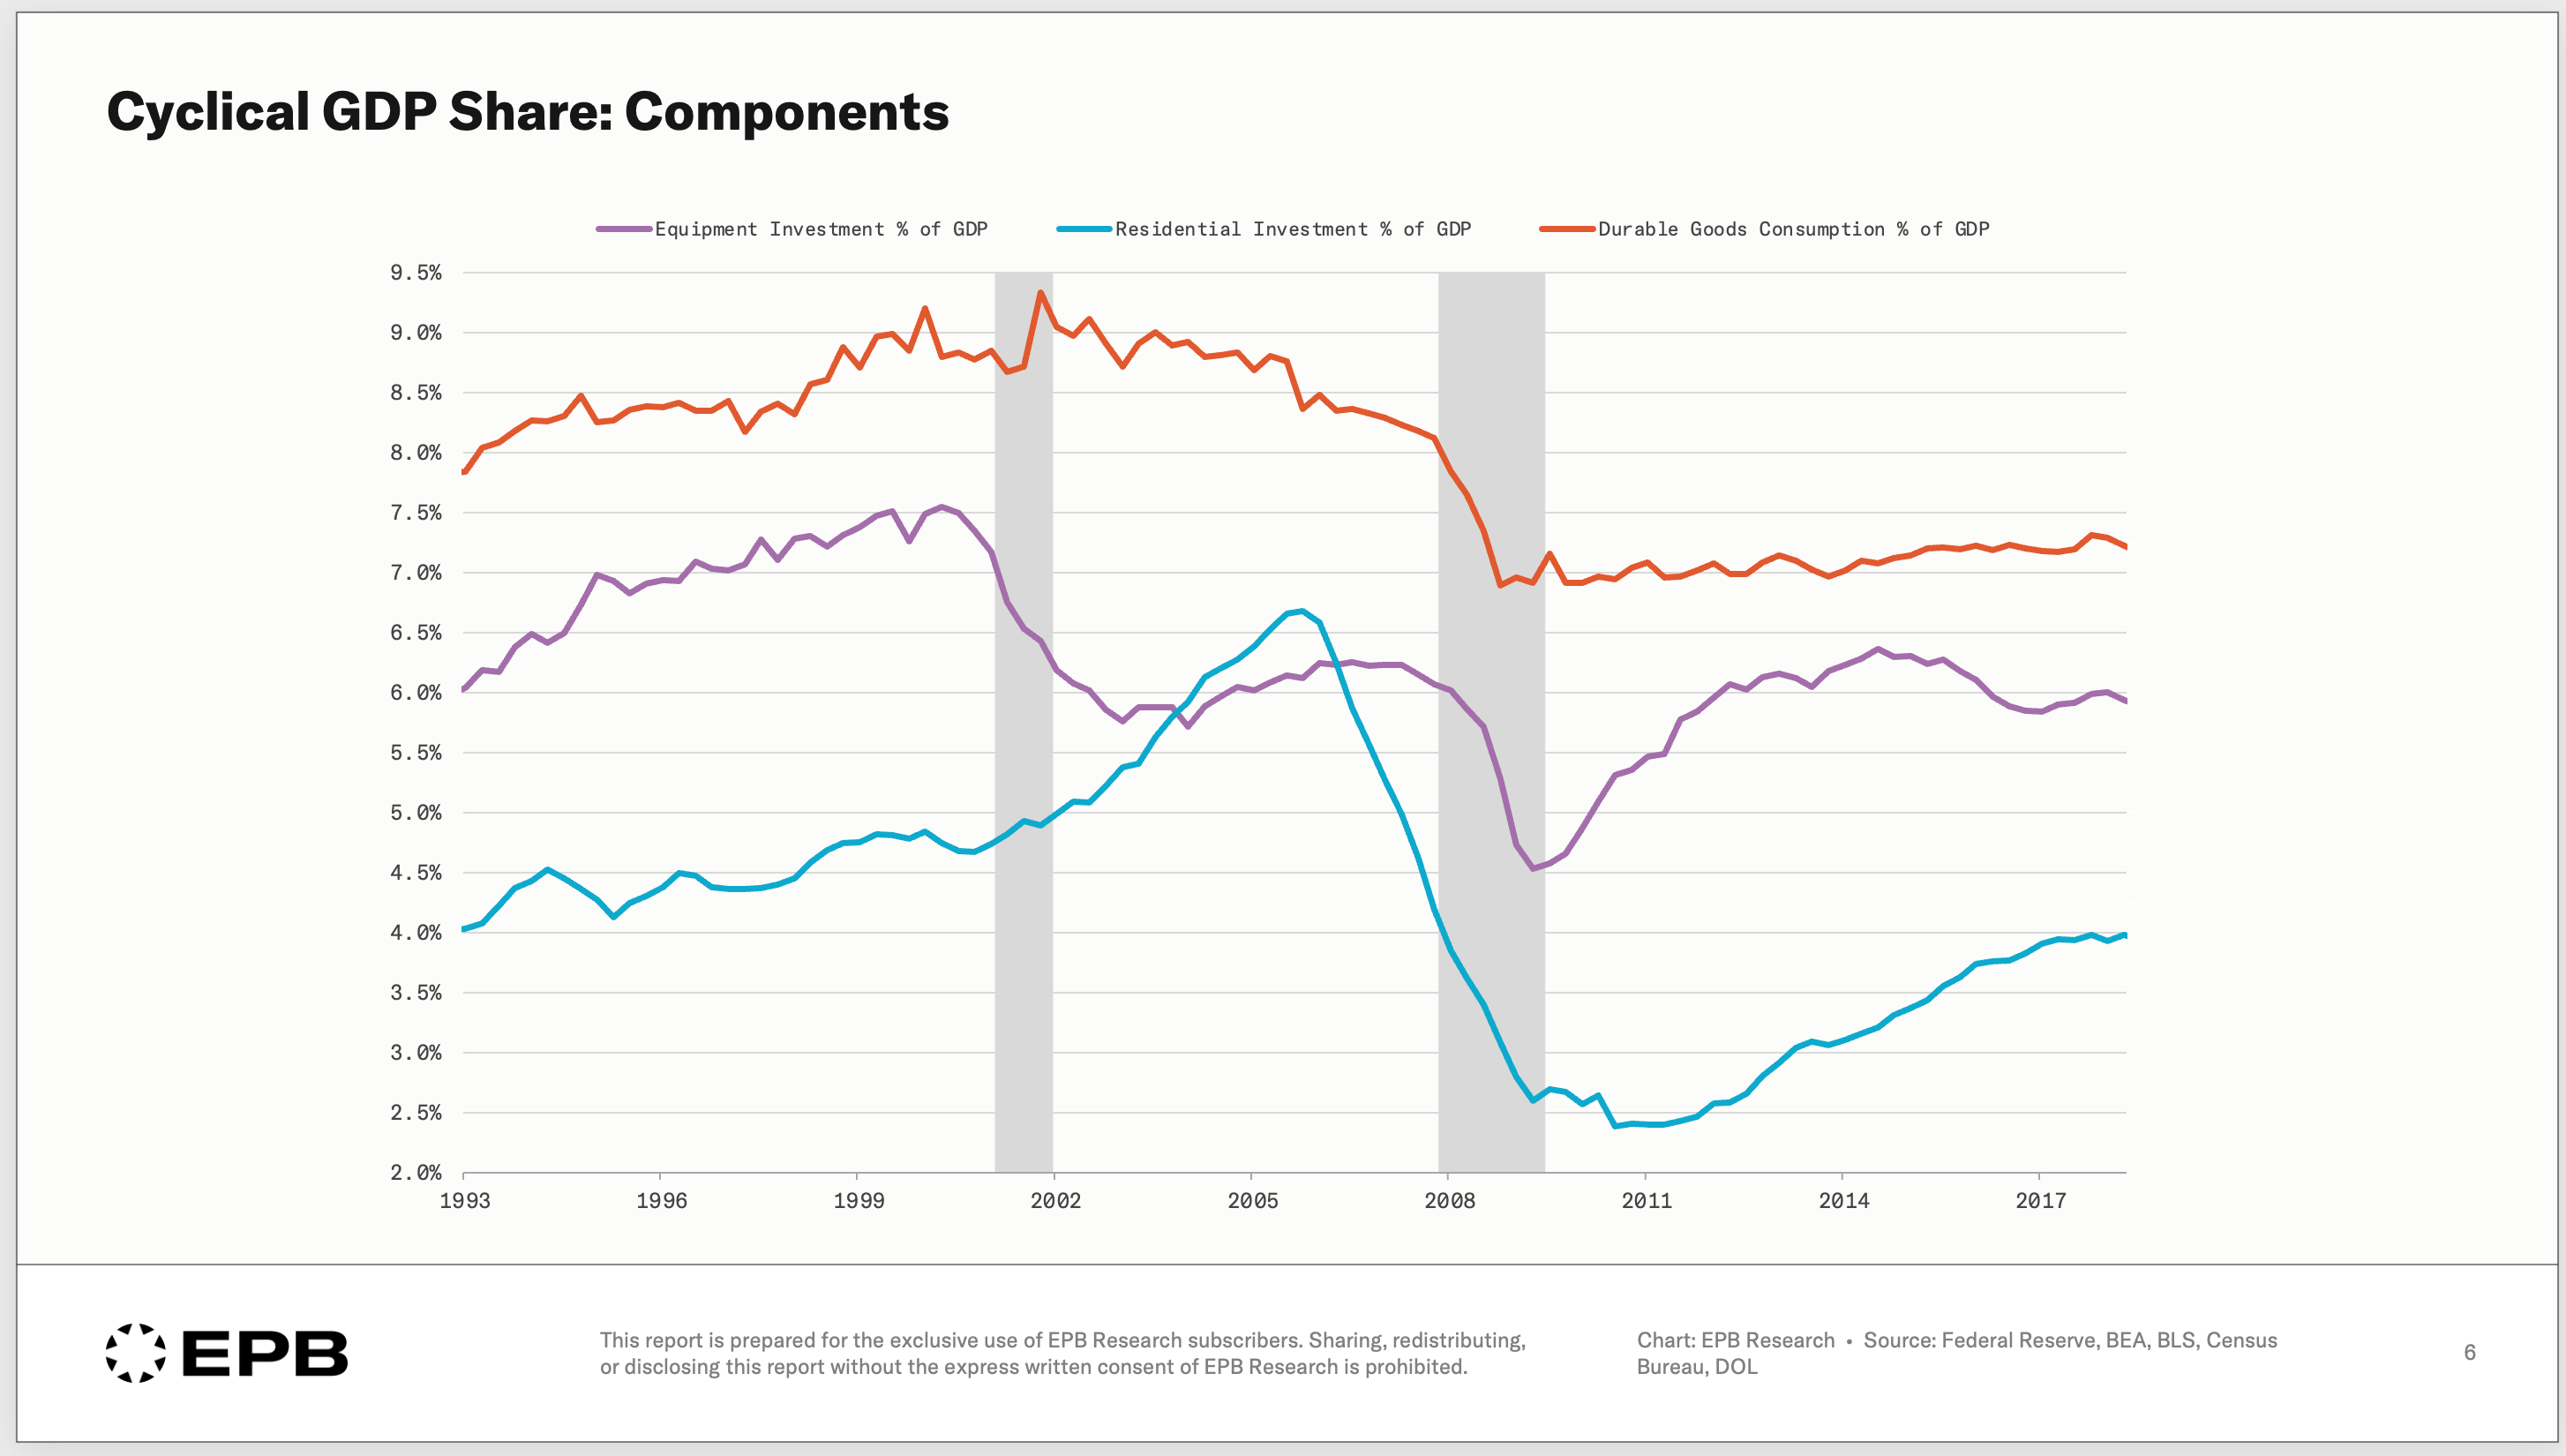
Cyclical GDP, as we define it at EPB Research, is the combination of:
durable goods consumption
business equipment investment
residential fixed investment

Every downturn in the economy is driven by at least one of these areas - very often more than one - but at least one.
The 2001 recession was unique in that it was one of the few economic downturns in which residential fixed investment did not contribute.
The 2001 recession was driven by investment in business equipment.
Yes, there was a technology component as information processing equipment, a smaller component of business equipment investment, collapsed in 2000 and 2001.
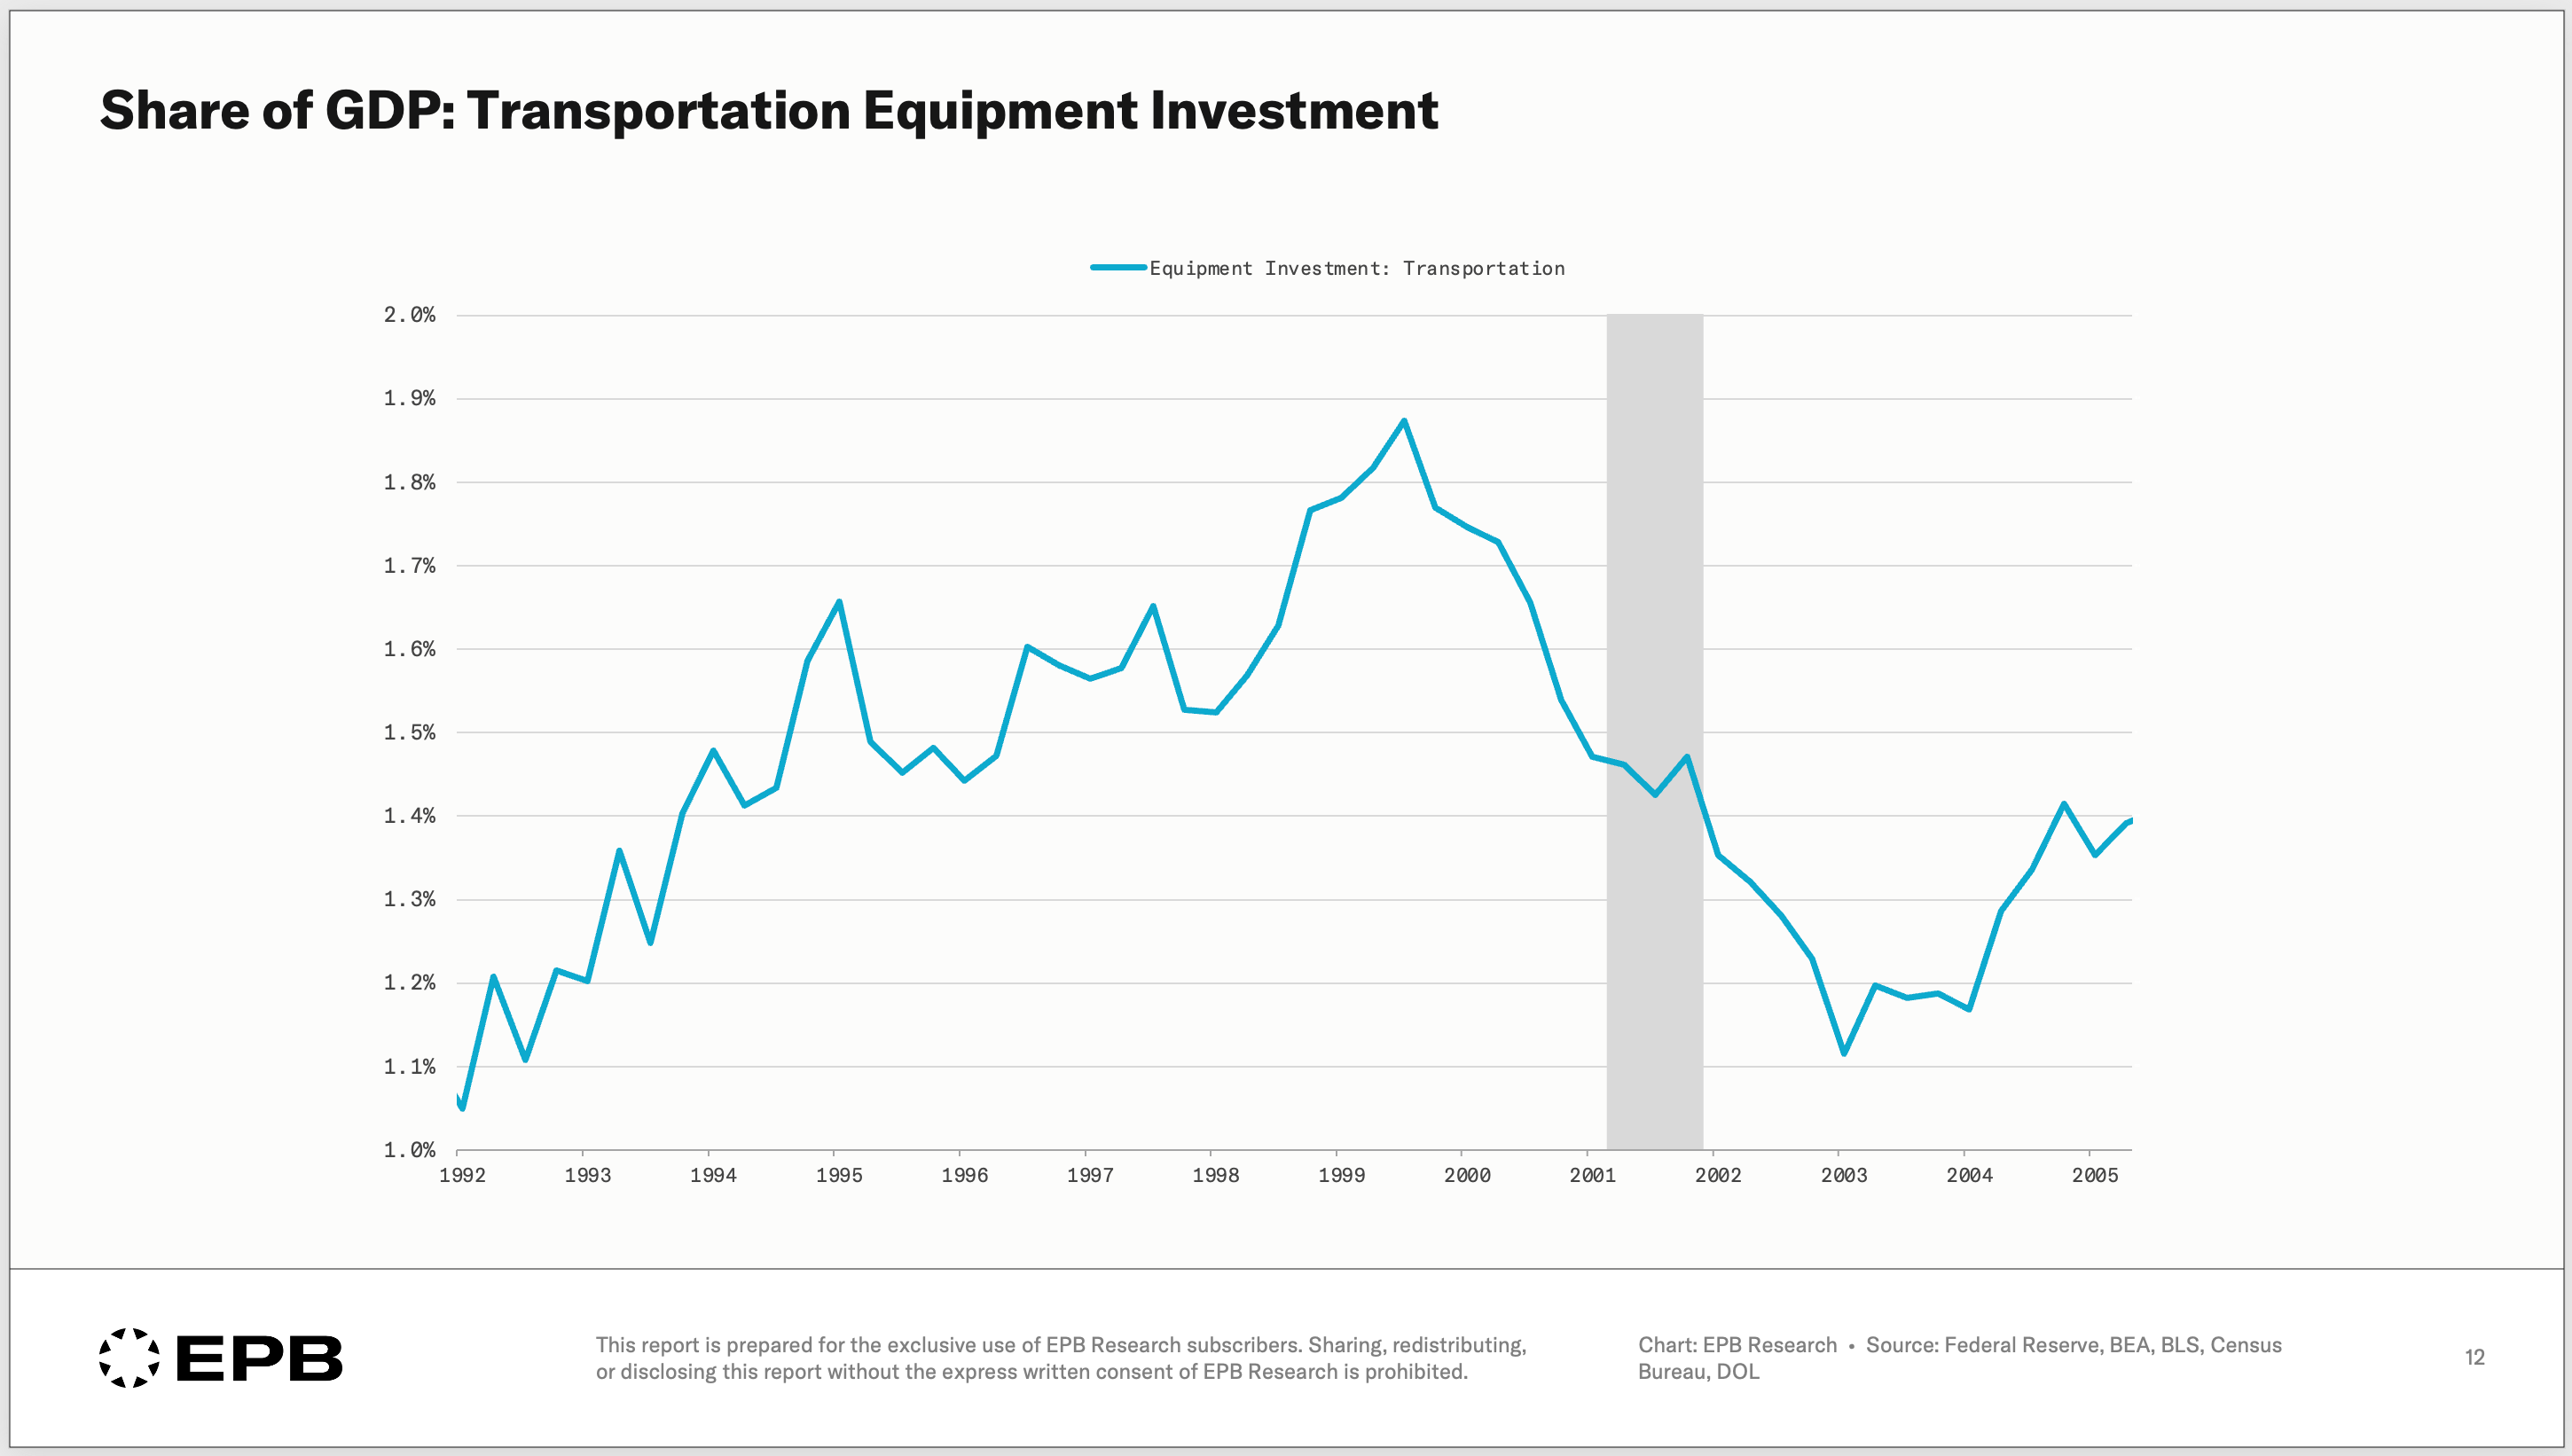
But there was also a major downturn in the equipment investment category of transportation equipment, which is business investment in cars, trucks, airplanes, buses, and ships.
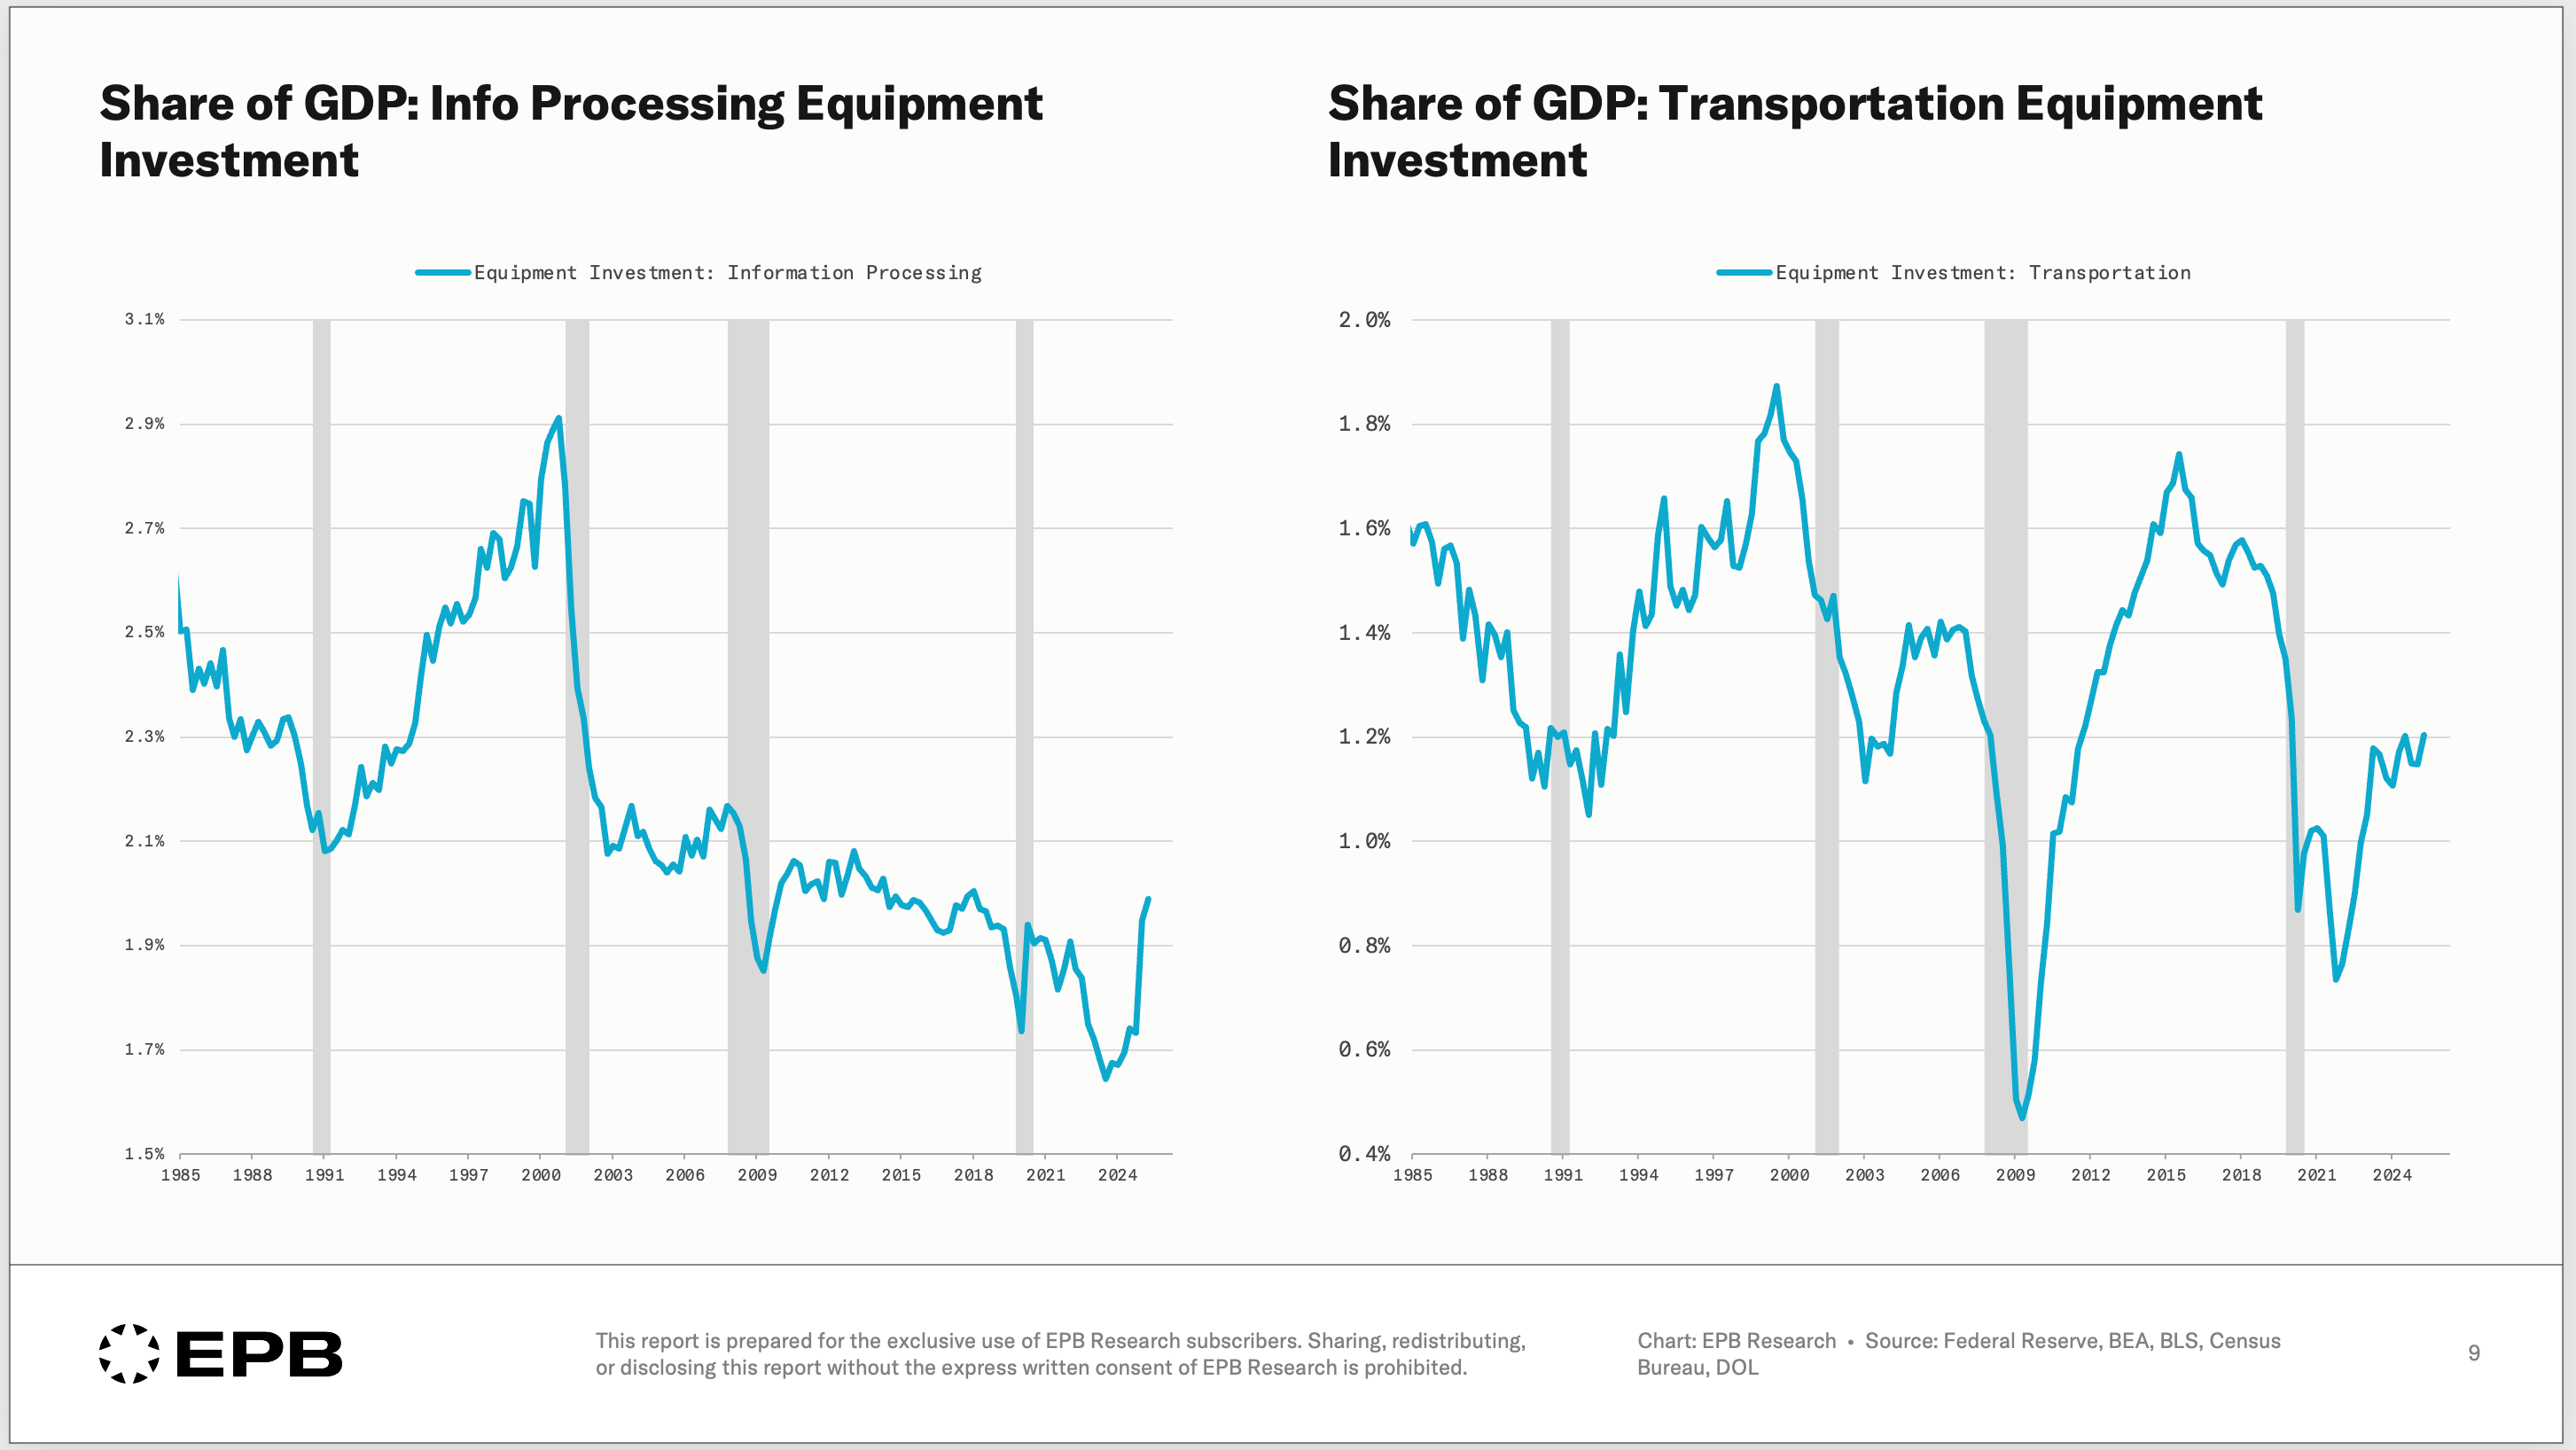
In fact, one of the earliest cyclical signs in the 2000s cycle was the downturn in transportation equipment seen as early as 1999.
When companies dramatically pull back on investment, they are preparing or responding to lower demand.
The decline in investment leads to lower levels of production, which lowers the need for employment, prompting layoffs and then recession. This sequence was already in motion throughout 2000.
Cyclical GDP Divergence
In the first quarter of 2000, Cyclical GDP growth began to underperform total GDP growth, indicating that economic momentum was faltering and that gravity would pull the broader economy lower.
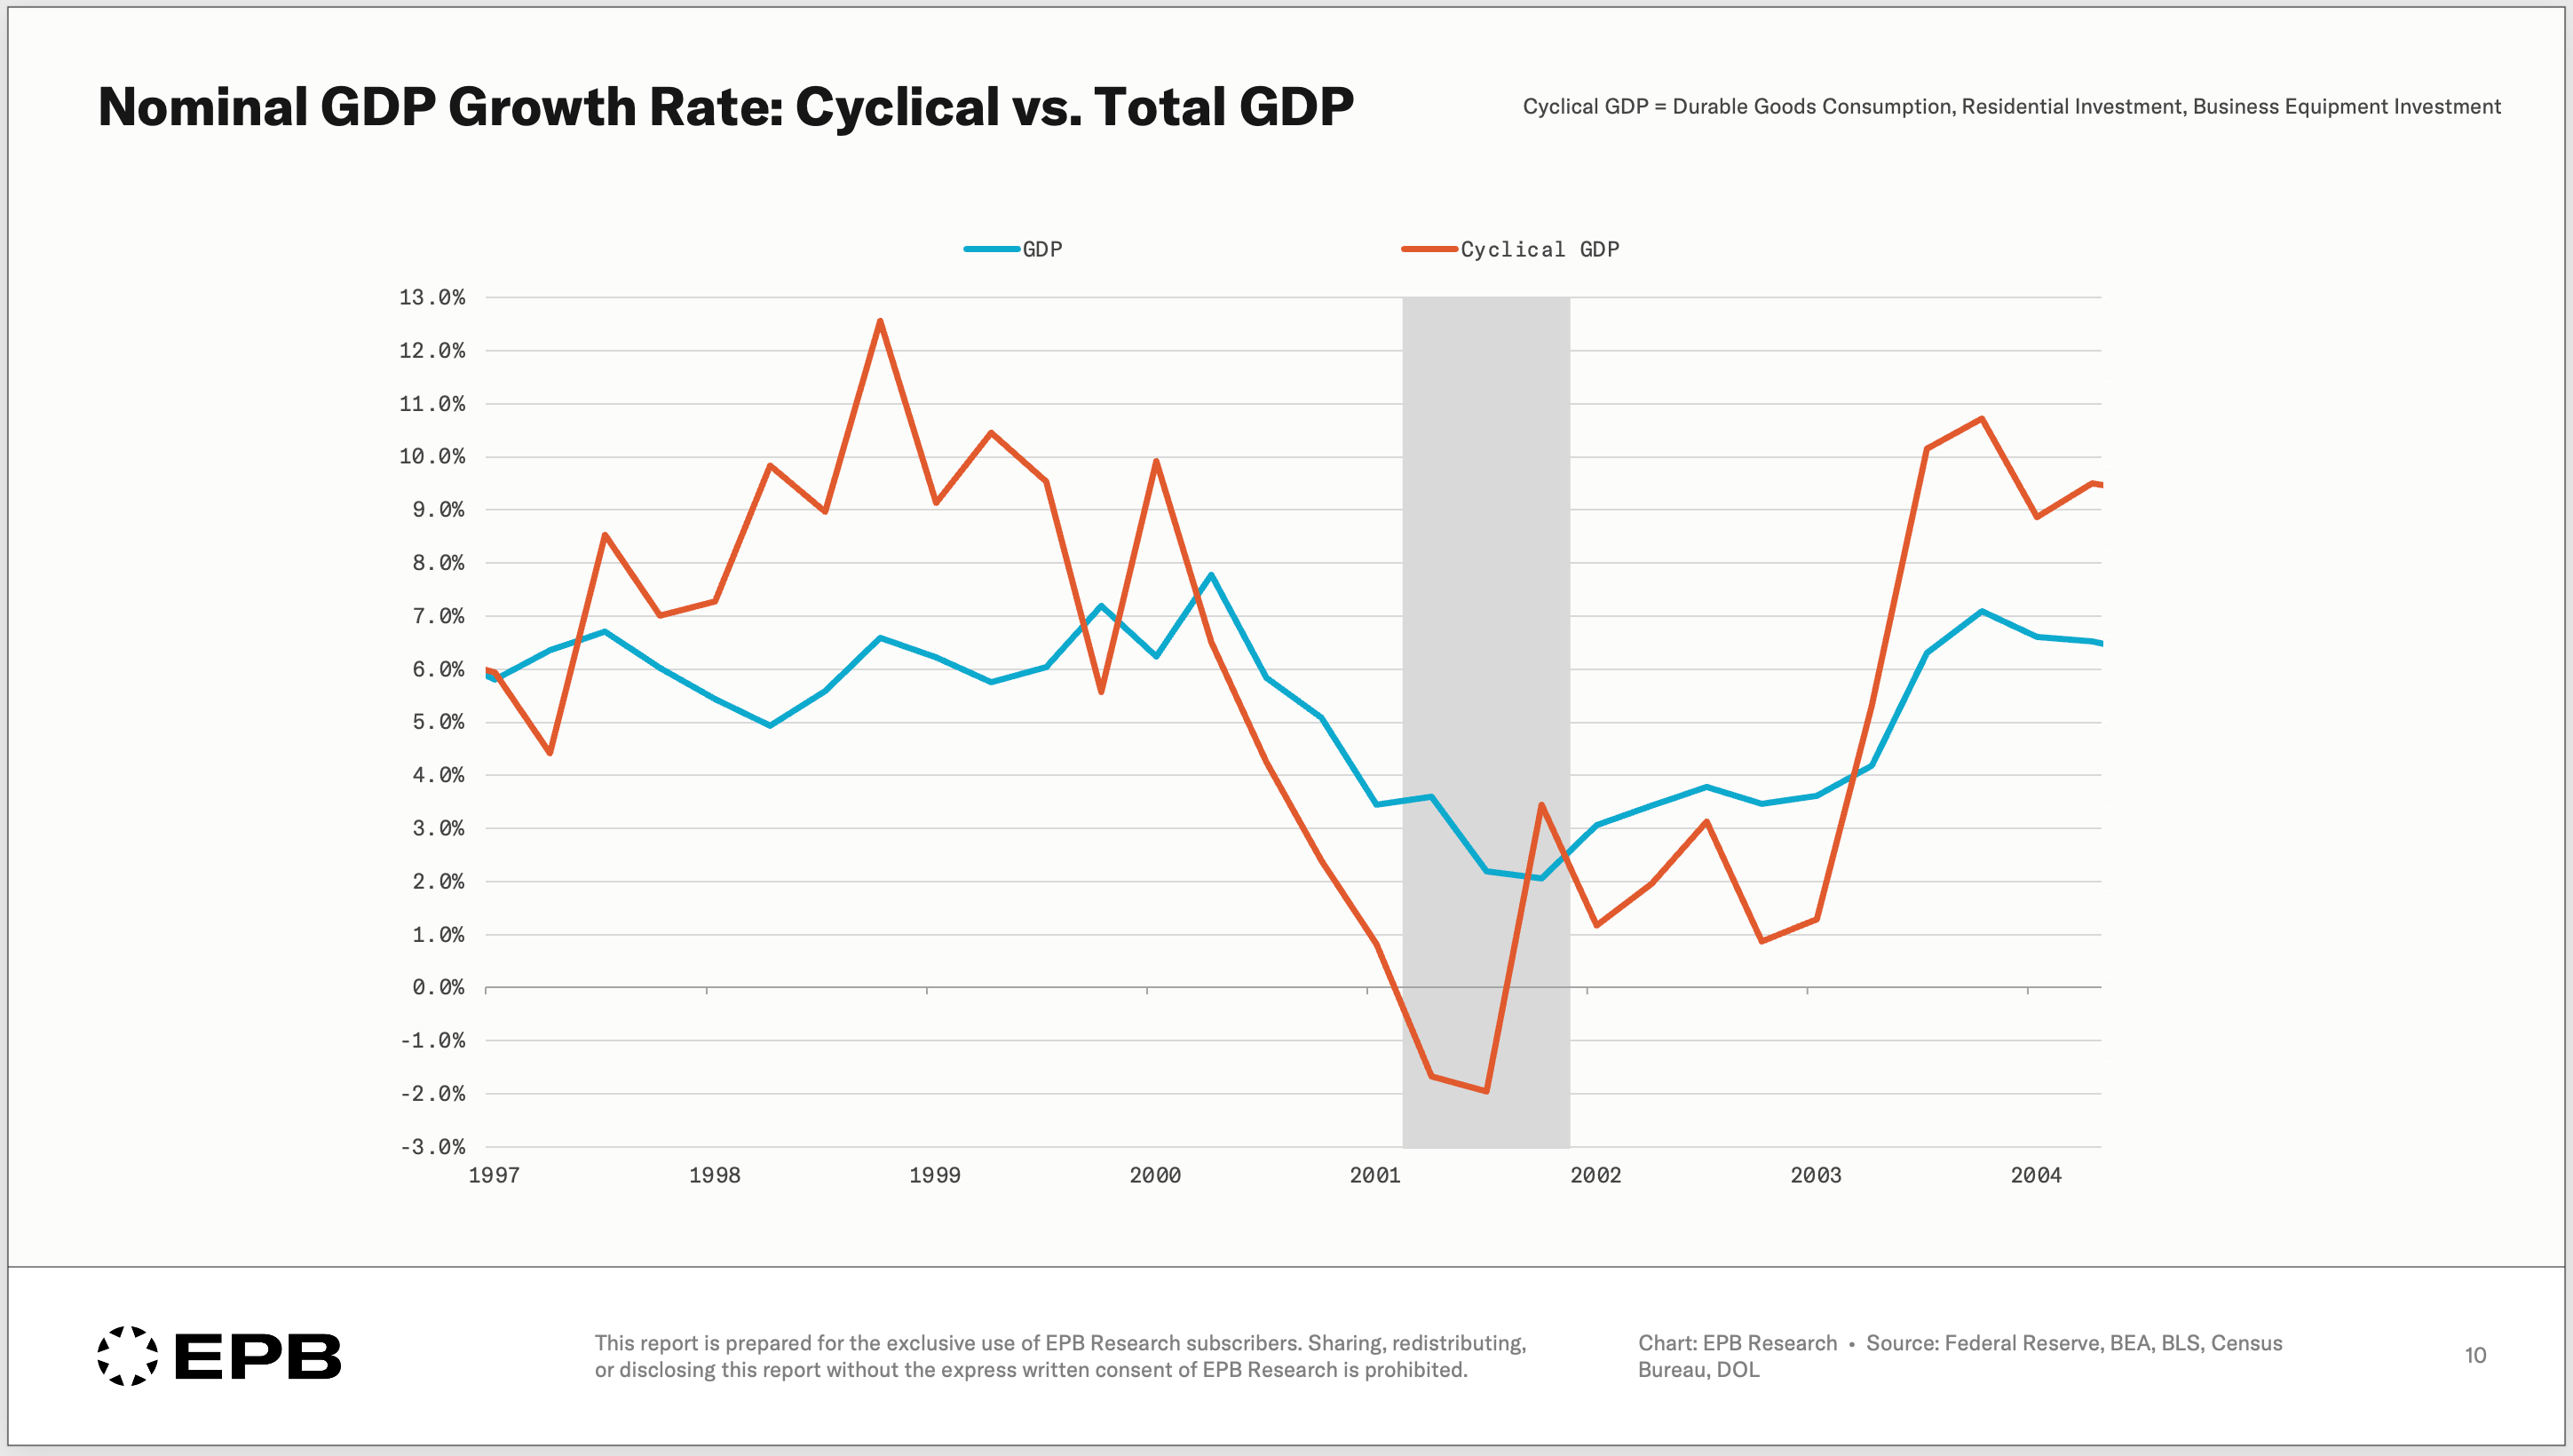
The structural components of GDP, such as services, healthcare, education, and government, kept GDP strongly positive despite contraction in key sectors.
While the exact component of Cyclical GDP that drives the downturn is different each time, the overall pattern repeats every cycle.
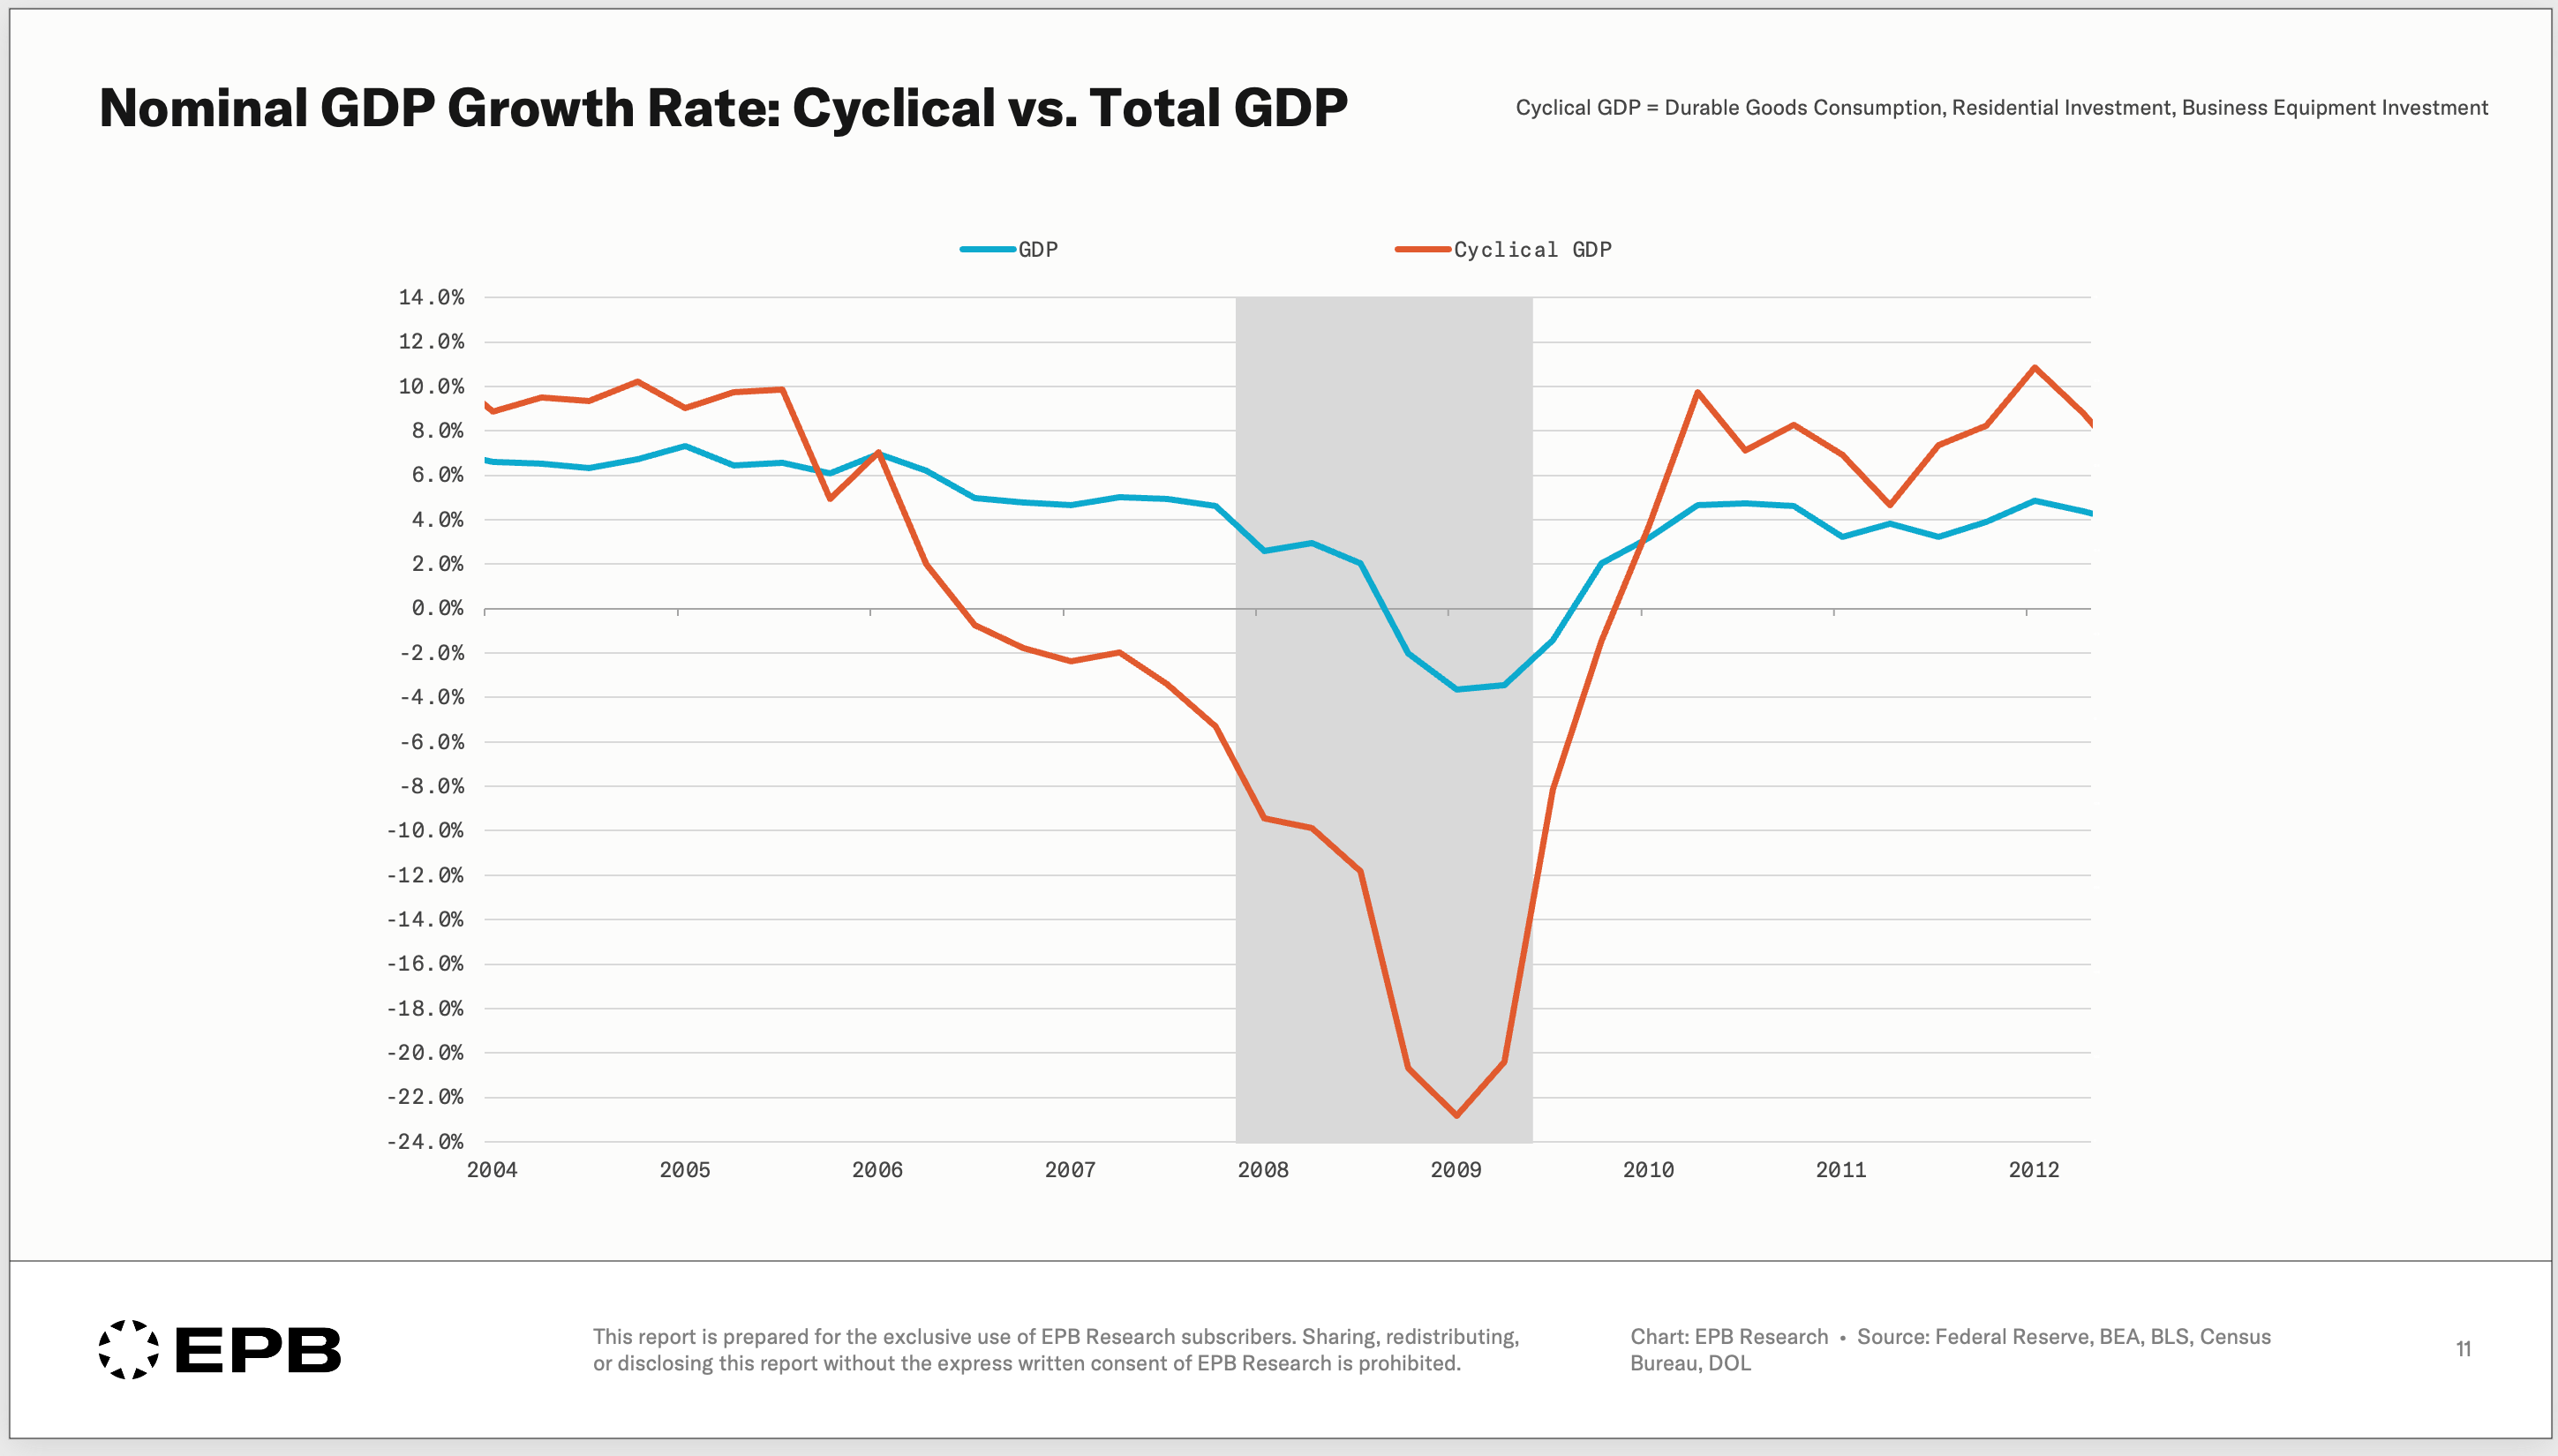
In a previous article, we discussed how the 2008 recession was predictable using the same process. In fact, the Cyclical GDP divergence was even more pronounced.
Cyclical GDP growth started to contract in late 2006, while total nominal GDP growth was greater than 5%.
In the first quarter of 2008, residential investment growth was -27%, Cyclical GDP growth was -9% and total nominal growth was +2.6%.
Waiting for total GDP growth to turn, or the unemployment rate to rise sharply, or the Fed to acknowledge a slowdown is always too late. The cyclical sectors of the economy often give 6-12 months warning and in some cases like 2008, up to 18 months warning.
The Key Takeaway
The 2001 recession was one of the milder downturns, but it wasn’t unpredictable, and it wasn’t caused by a spontaneous collapse of stock prices.
Growth in the cyclical sectors began to decline in late 1999 and continued to decline through 2000.
(Not to mention, corporate profit margins peaked in Q3 1997.)
Watching headline GDP, total nonfarm payrolls, the unemployment rate, and stock prices will lead to reactive, not predictive decisions virtually every time.
You will always receive advanced warning in the above metrics by focusing on cyclical sectors.
This is the framework, process, and sequence we use at EPB Research - we focus on the 20% of the economy that drives all the booms and busts.
You can (and should) track these indicators, as well as a similar process for employment, inflation, and more. Or, have us do it for you and save the time.
This is what we deliver at EPB Research. Detailed written and video analysis covering the business cycle, labor market, inflation, and Fed policy - plus real-time discussion when data drops.