

You Could Have Seen 2008 Coming. Here's Exactly How.
The three charts that signaled the recession 18 months early.

Most investors and economic pundits characterize the 2008 recession as a sudden crisis centered around the failure of Bear Stearns and Lehman Brothers.
Throughout 2007, calls for economic improvement, a soft landing, and fears of inflation dominated. In fact, in mid 2008, the Federal Reserve discussed raising interest rates as some participants downplayed the odds of a recession (which was already underway).
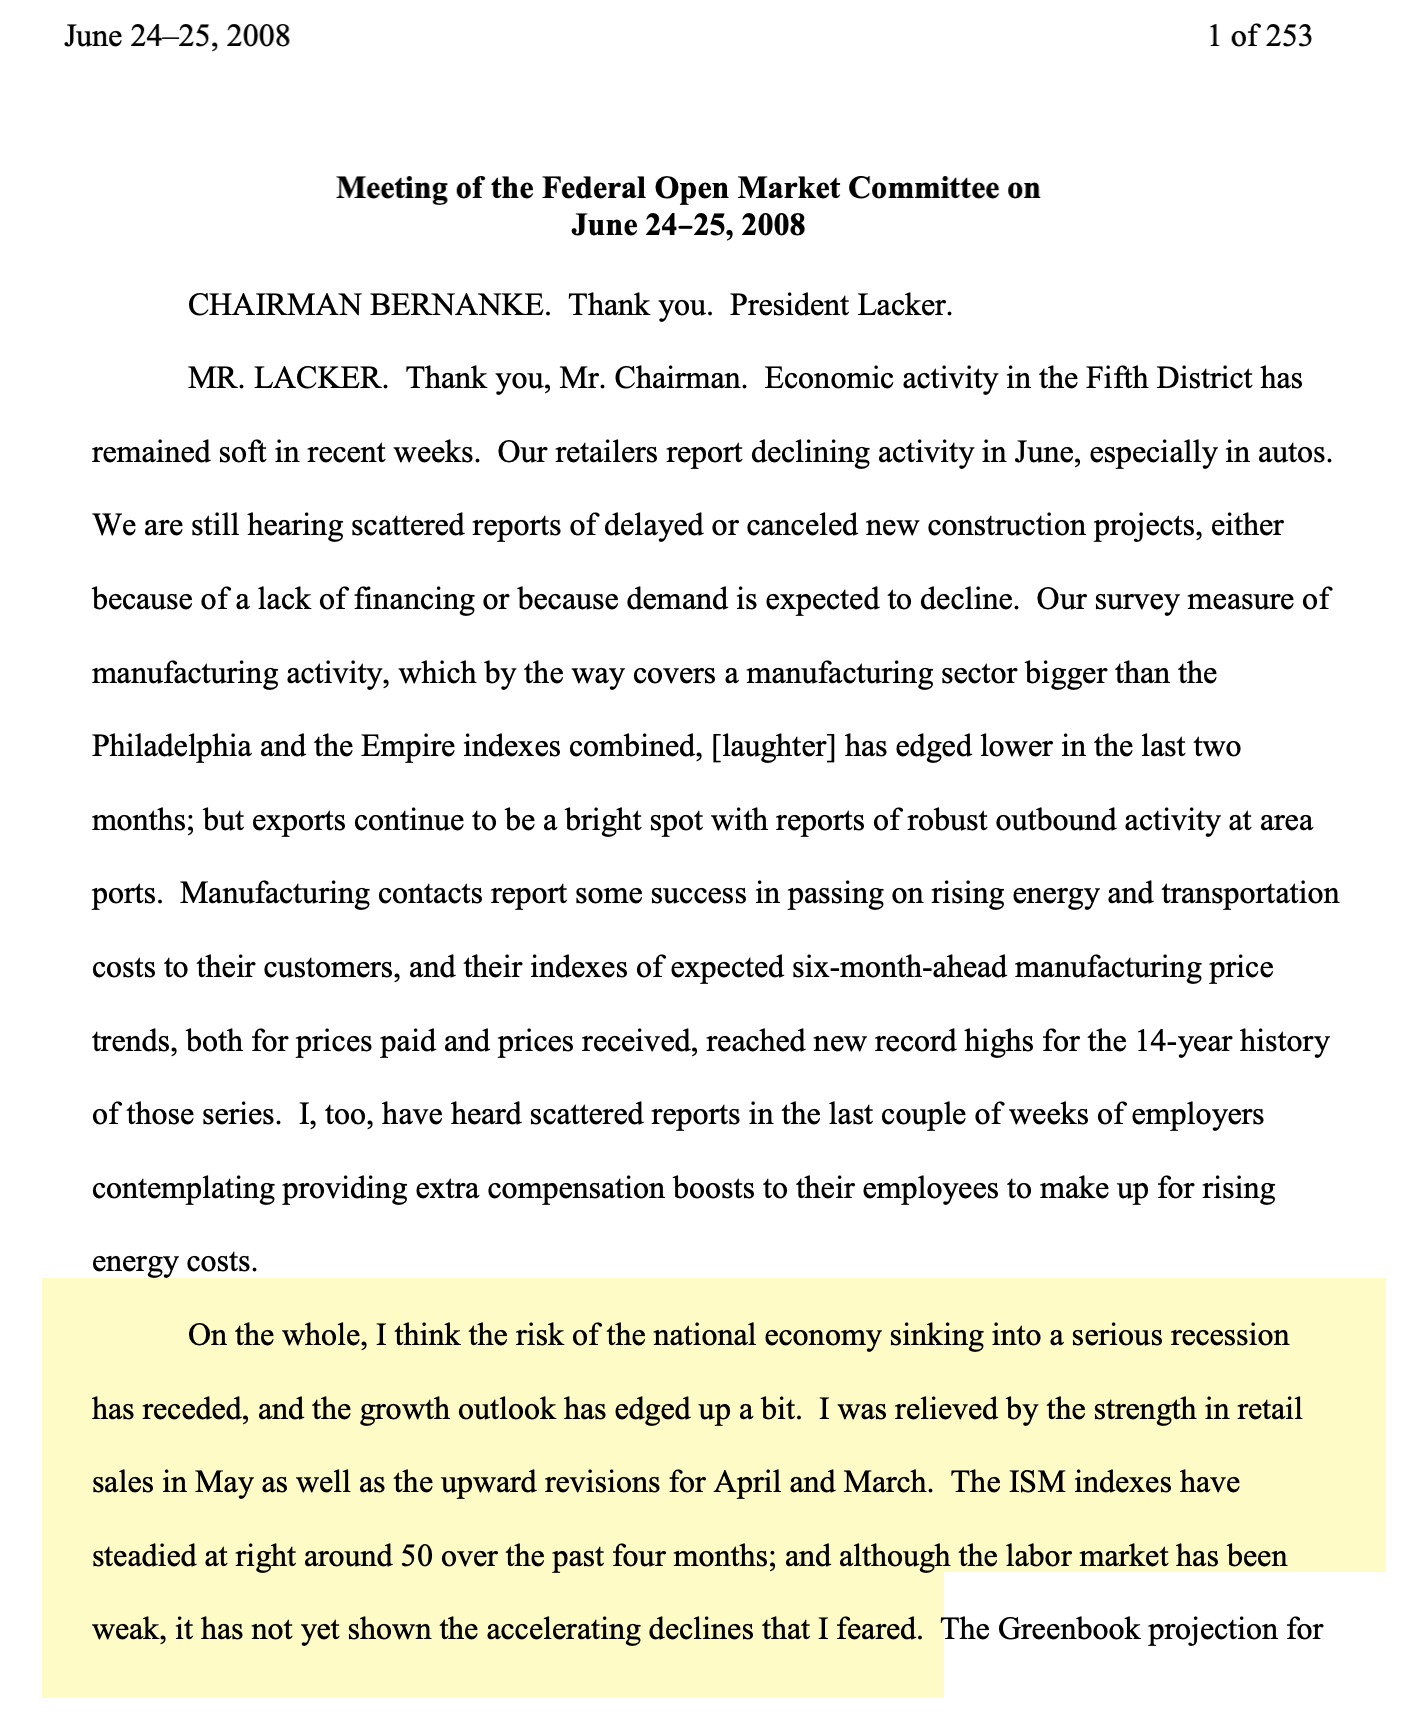
Below are highlighted comments from a June 2008 Federal Reserve meeting.
The reality is that using a sequential framework and focusing on the right sectors of the economy revealed weakness as early as 2005 and crisis-level warnings in 2007, long before the official onset of the recession.
In this post, we’ll highlight several charts that predicted the 2008 recession up to 18 months in advance. To be fair, this process did not suggest a global financial crisis was around the corner, but that crisis stemmed from a Business Cycle downturn that was easy to spot with advanced warning by focusing on the correct sectors.
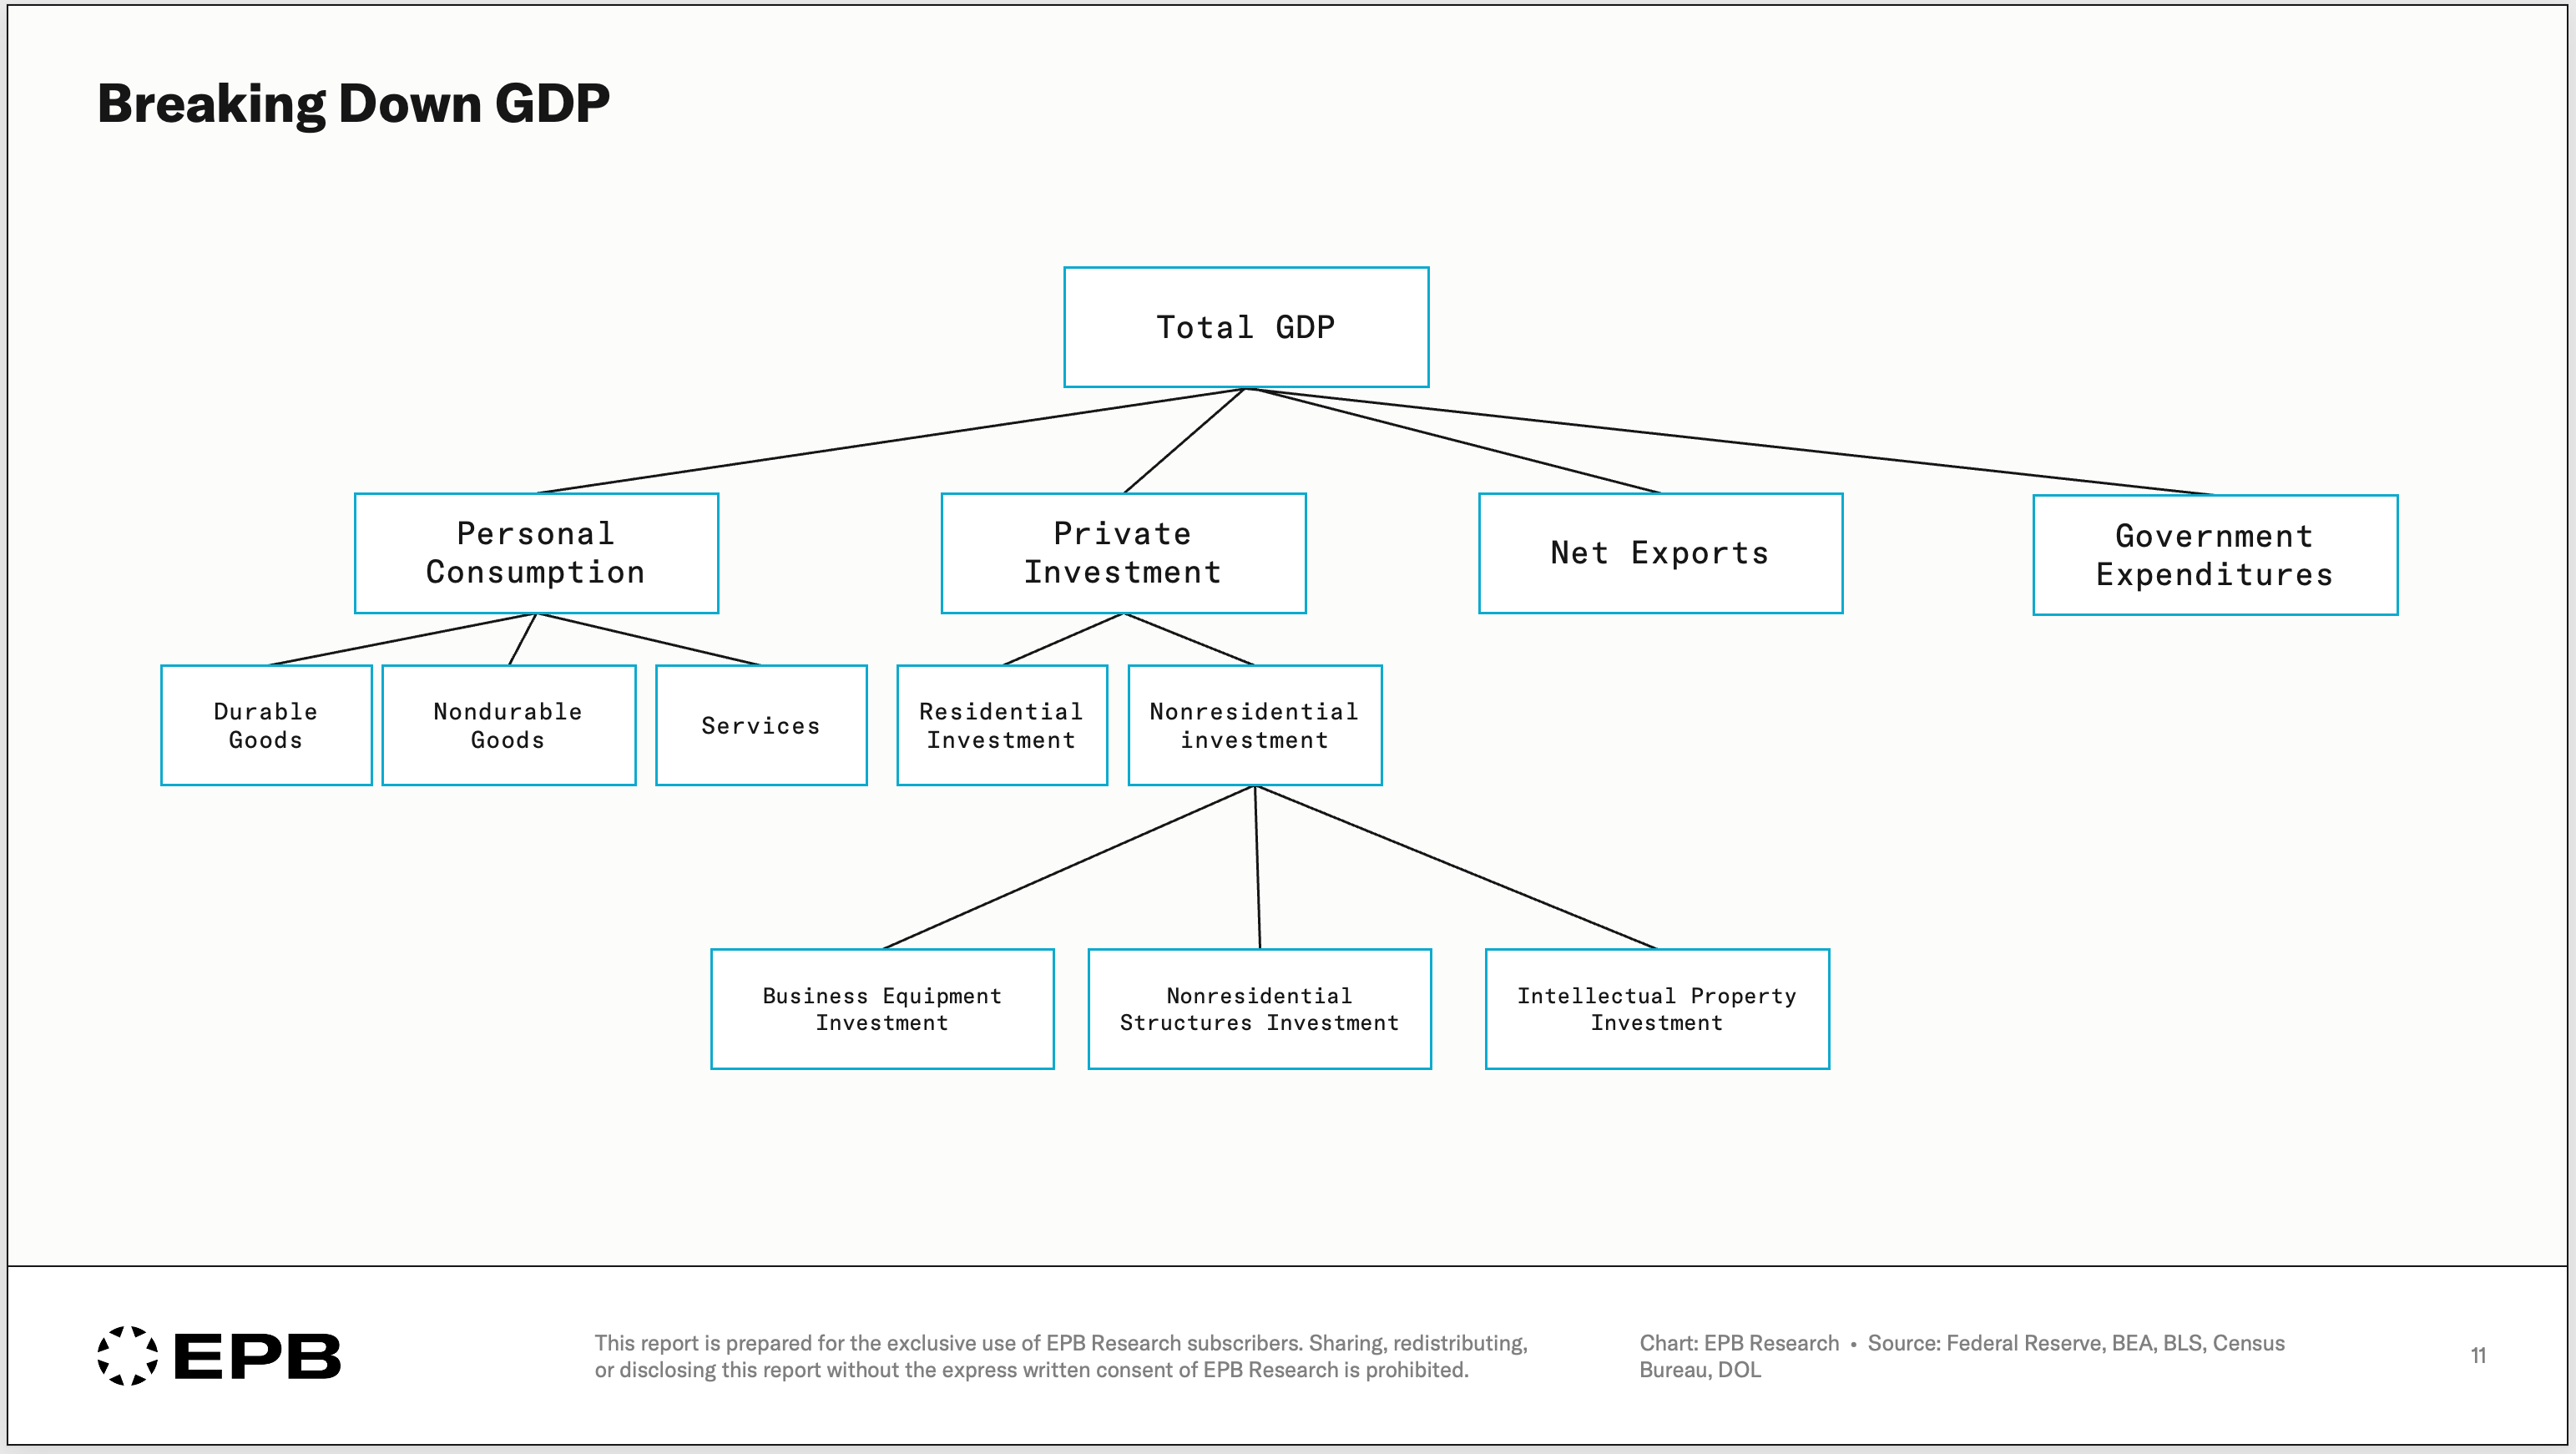
In a previous post, we discussed the importance of “Cyclical GDP” and how recessions always develop through durable goods consumption, residential investment and business equipment investment - highlighted in the GDP breakdown below.
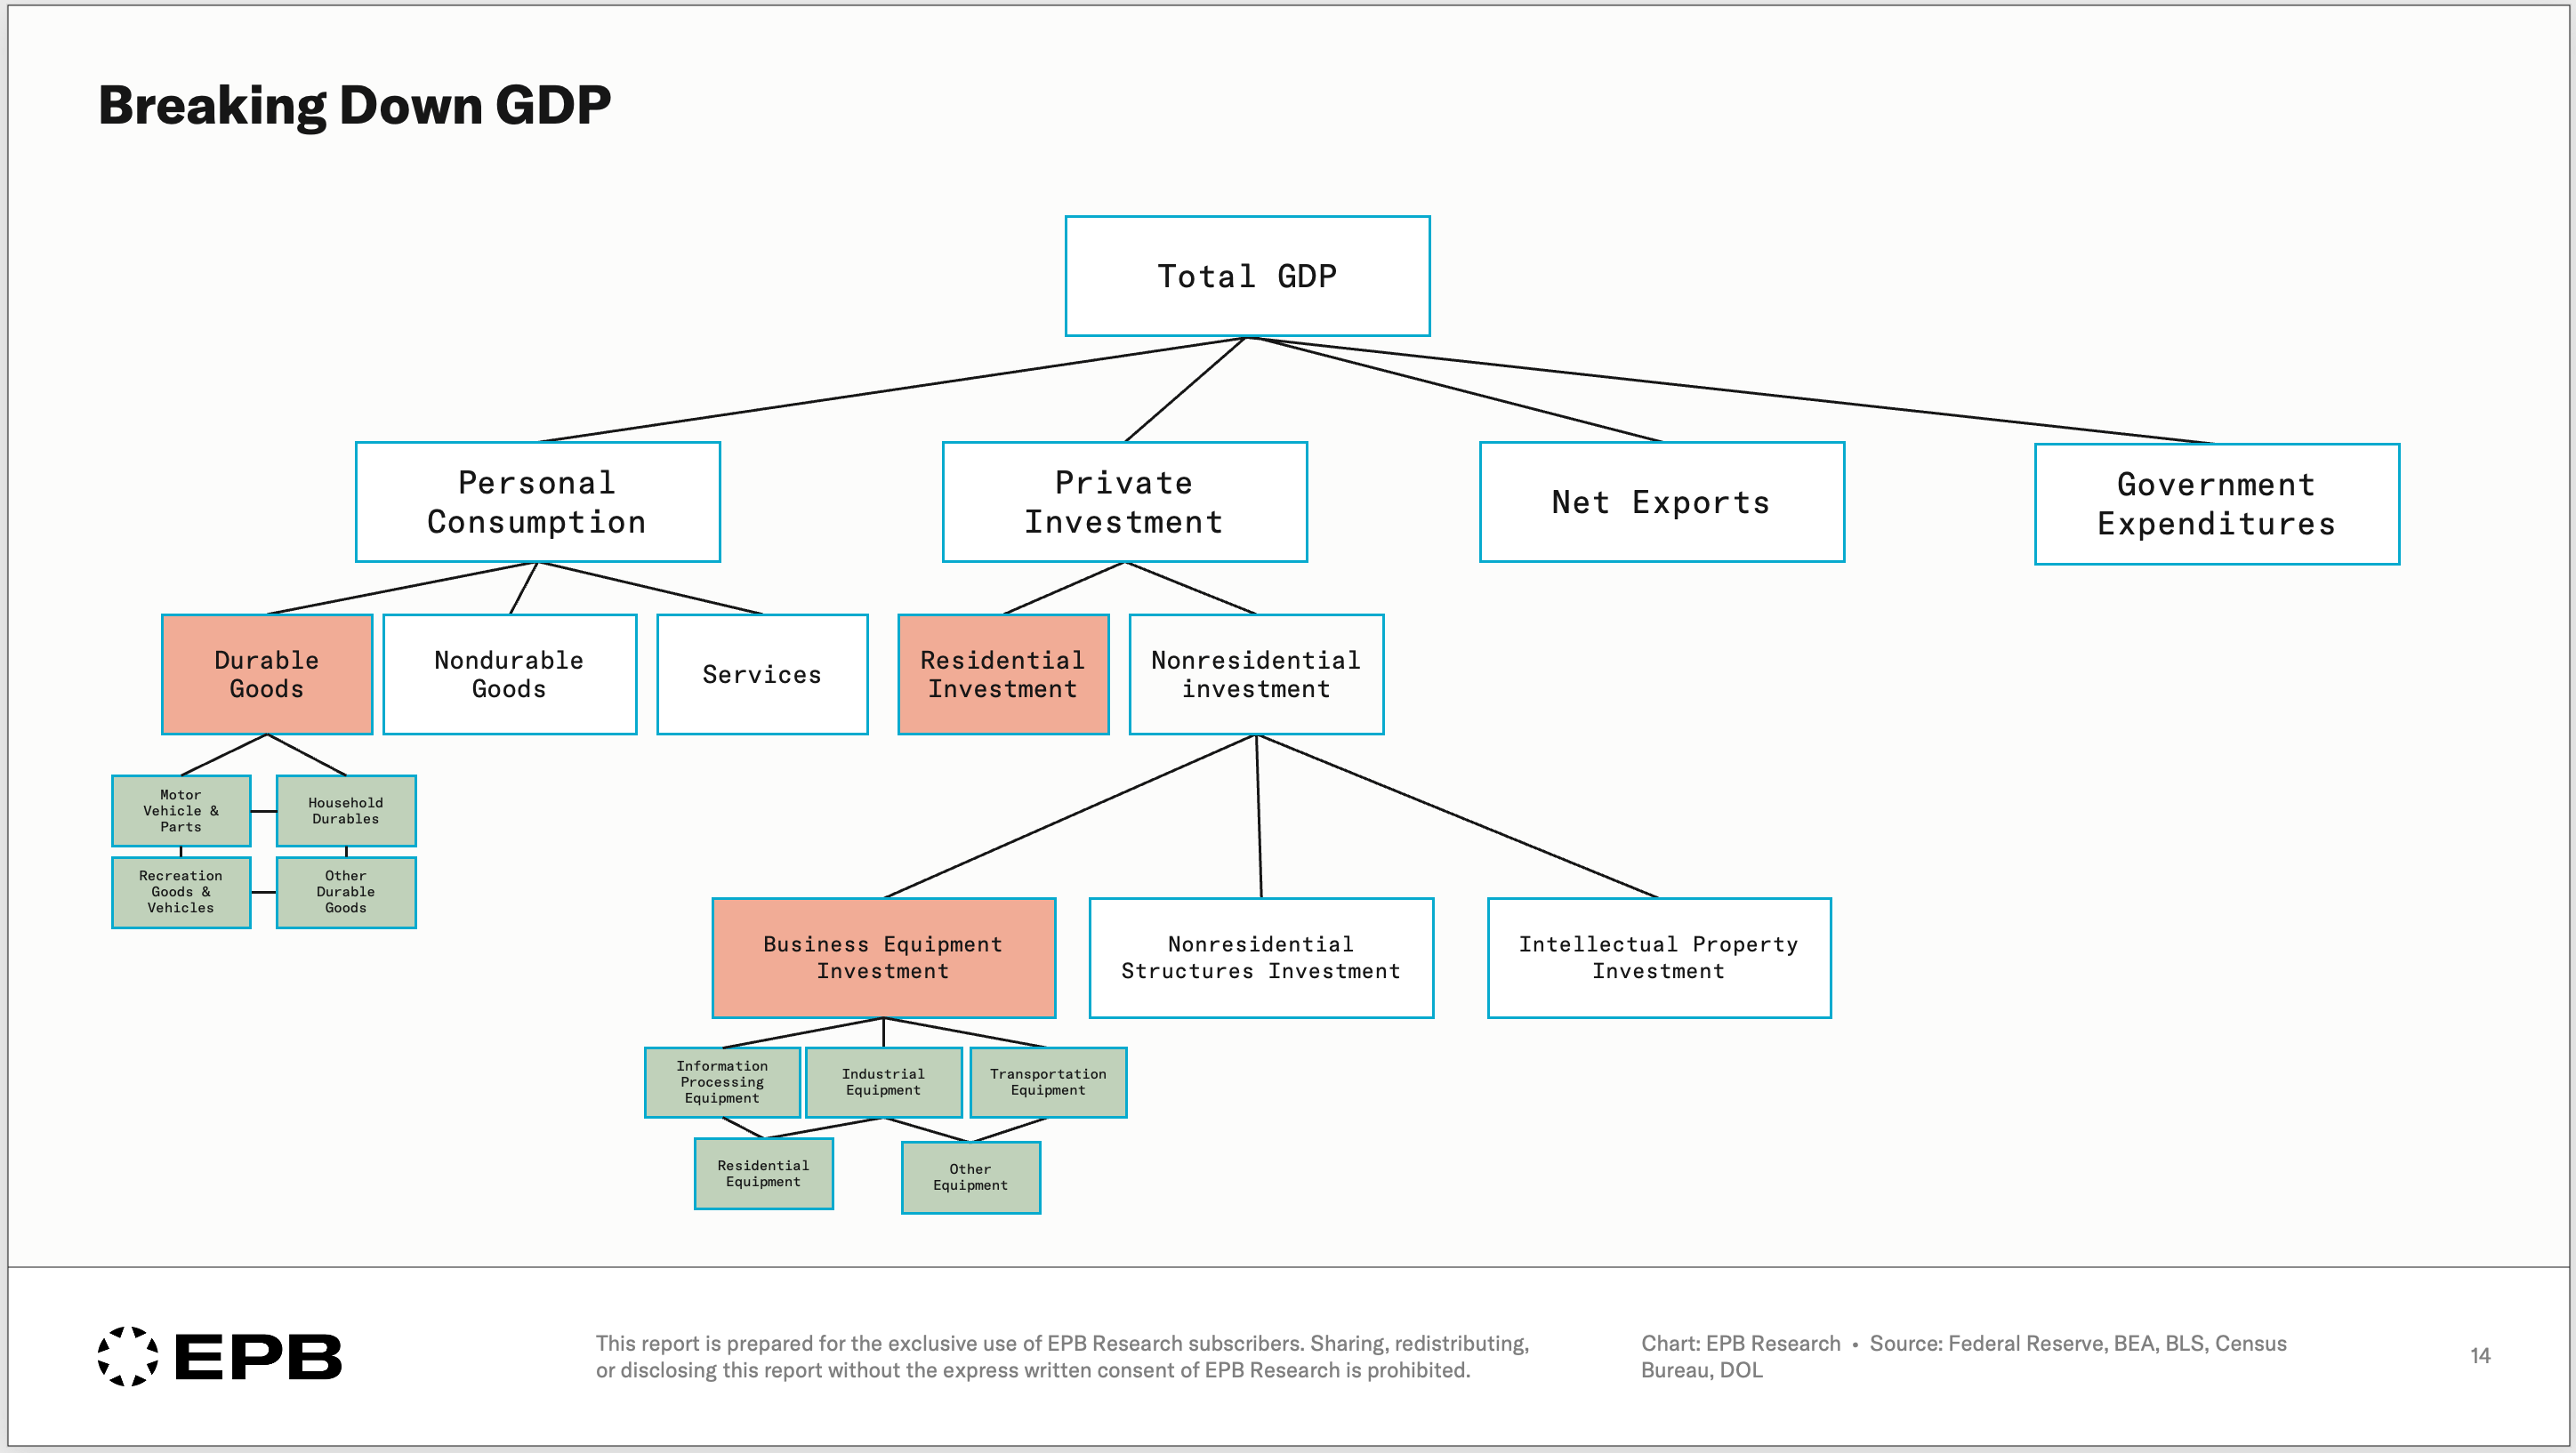
At EPB Research, we focus intensely on the cyclical components of GDP and we even go layers deeper in our premium reports, emphasizing the importance of sectors like motor vehicle consumption, or investment in transportation equipment.
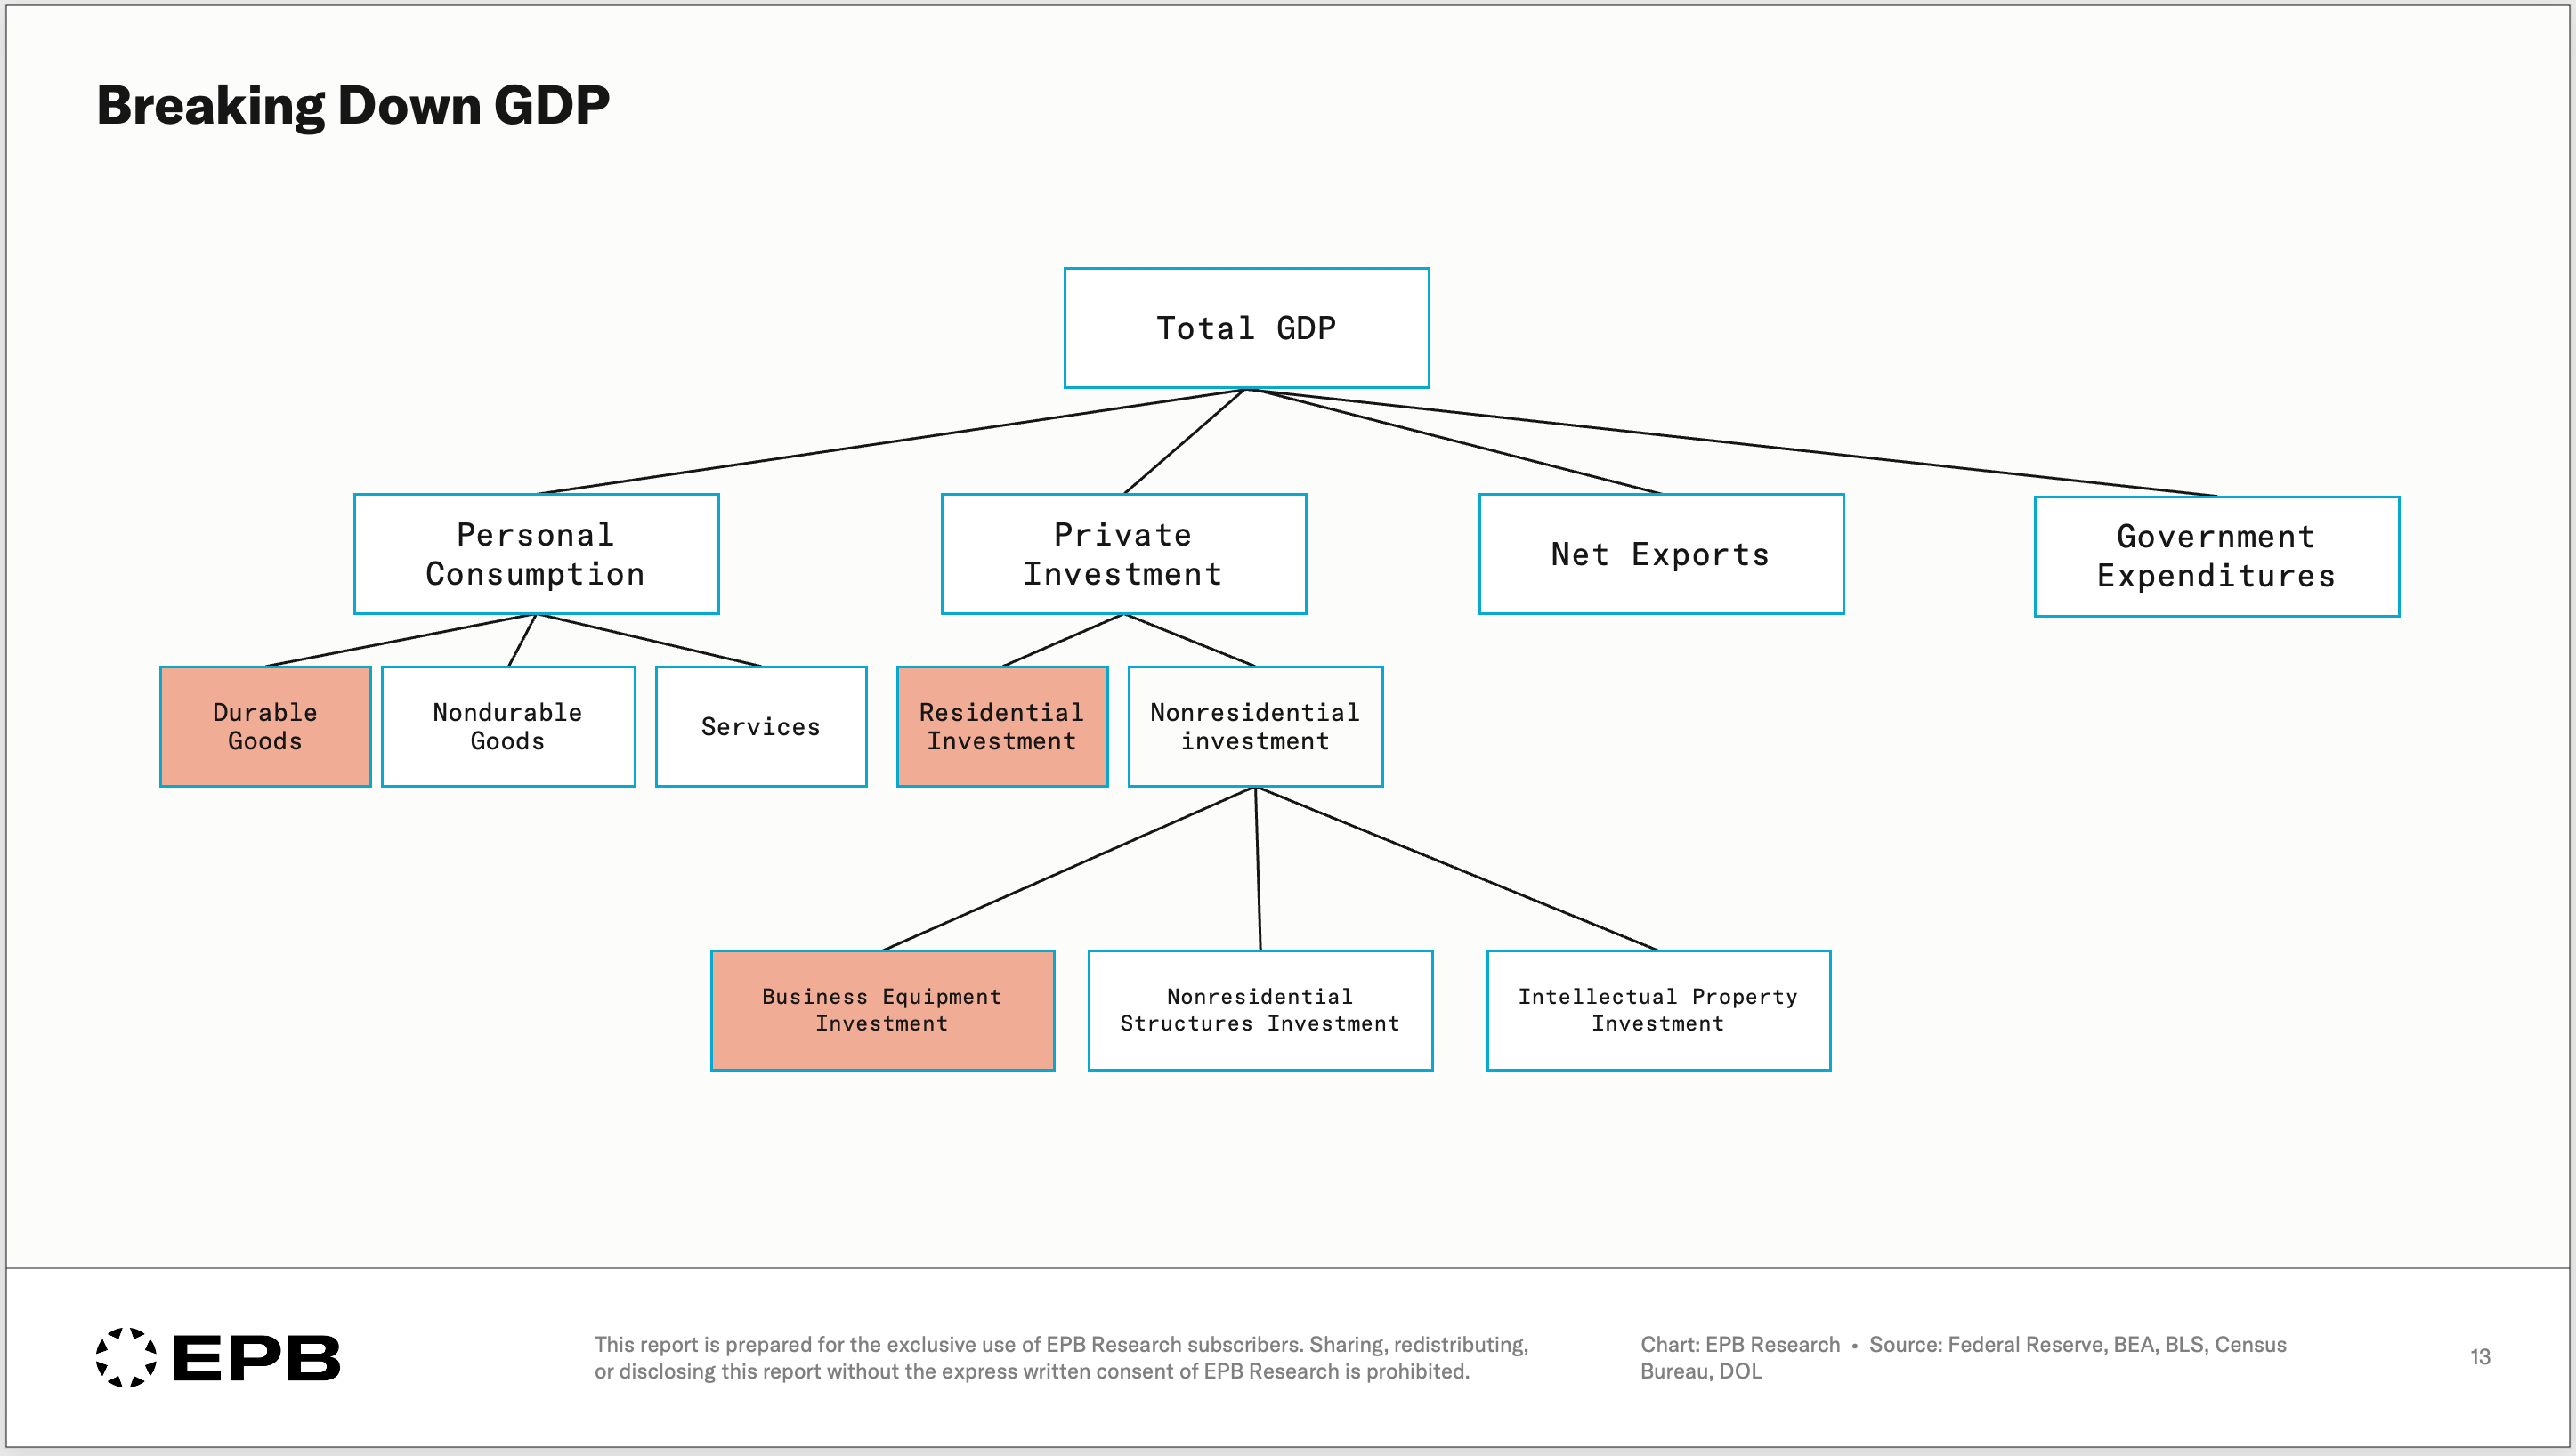
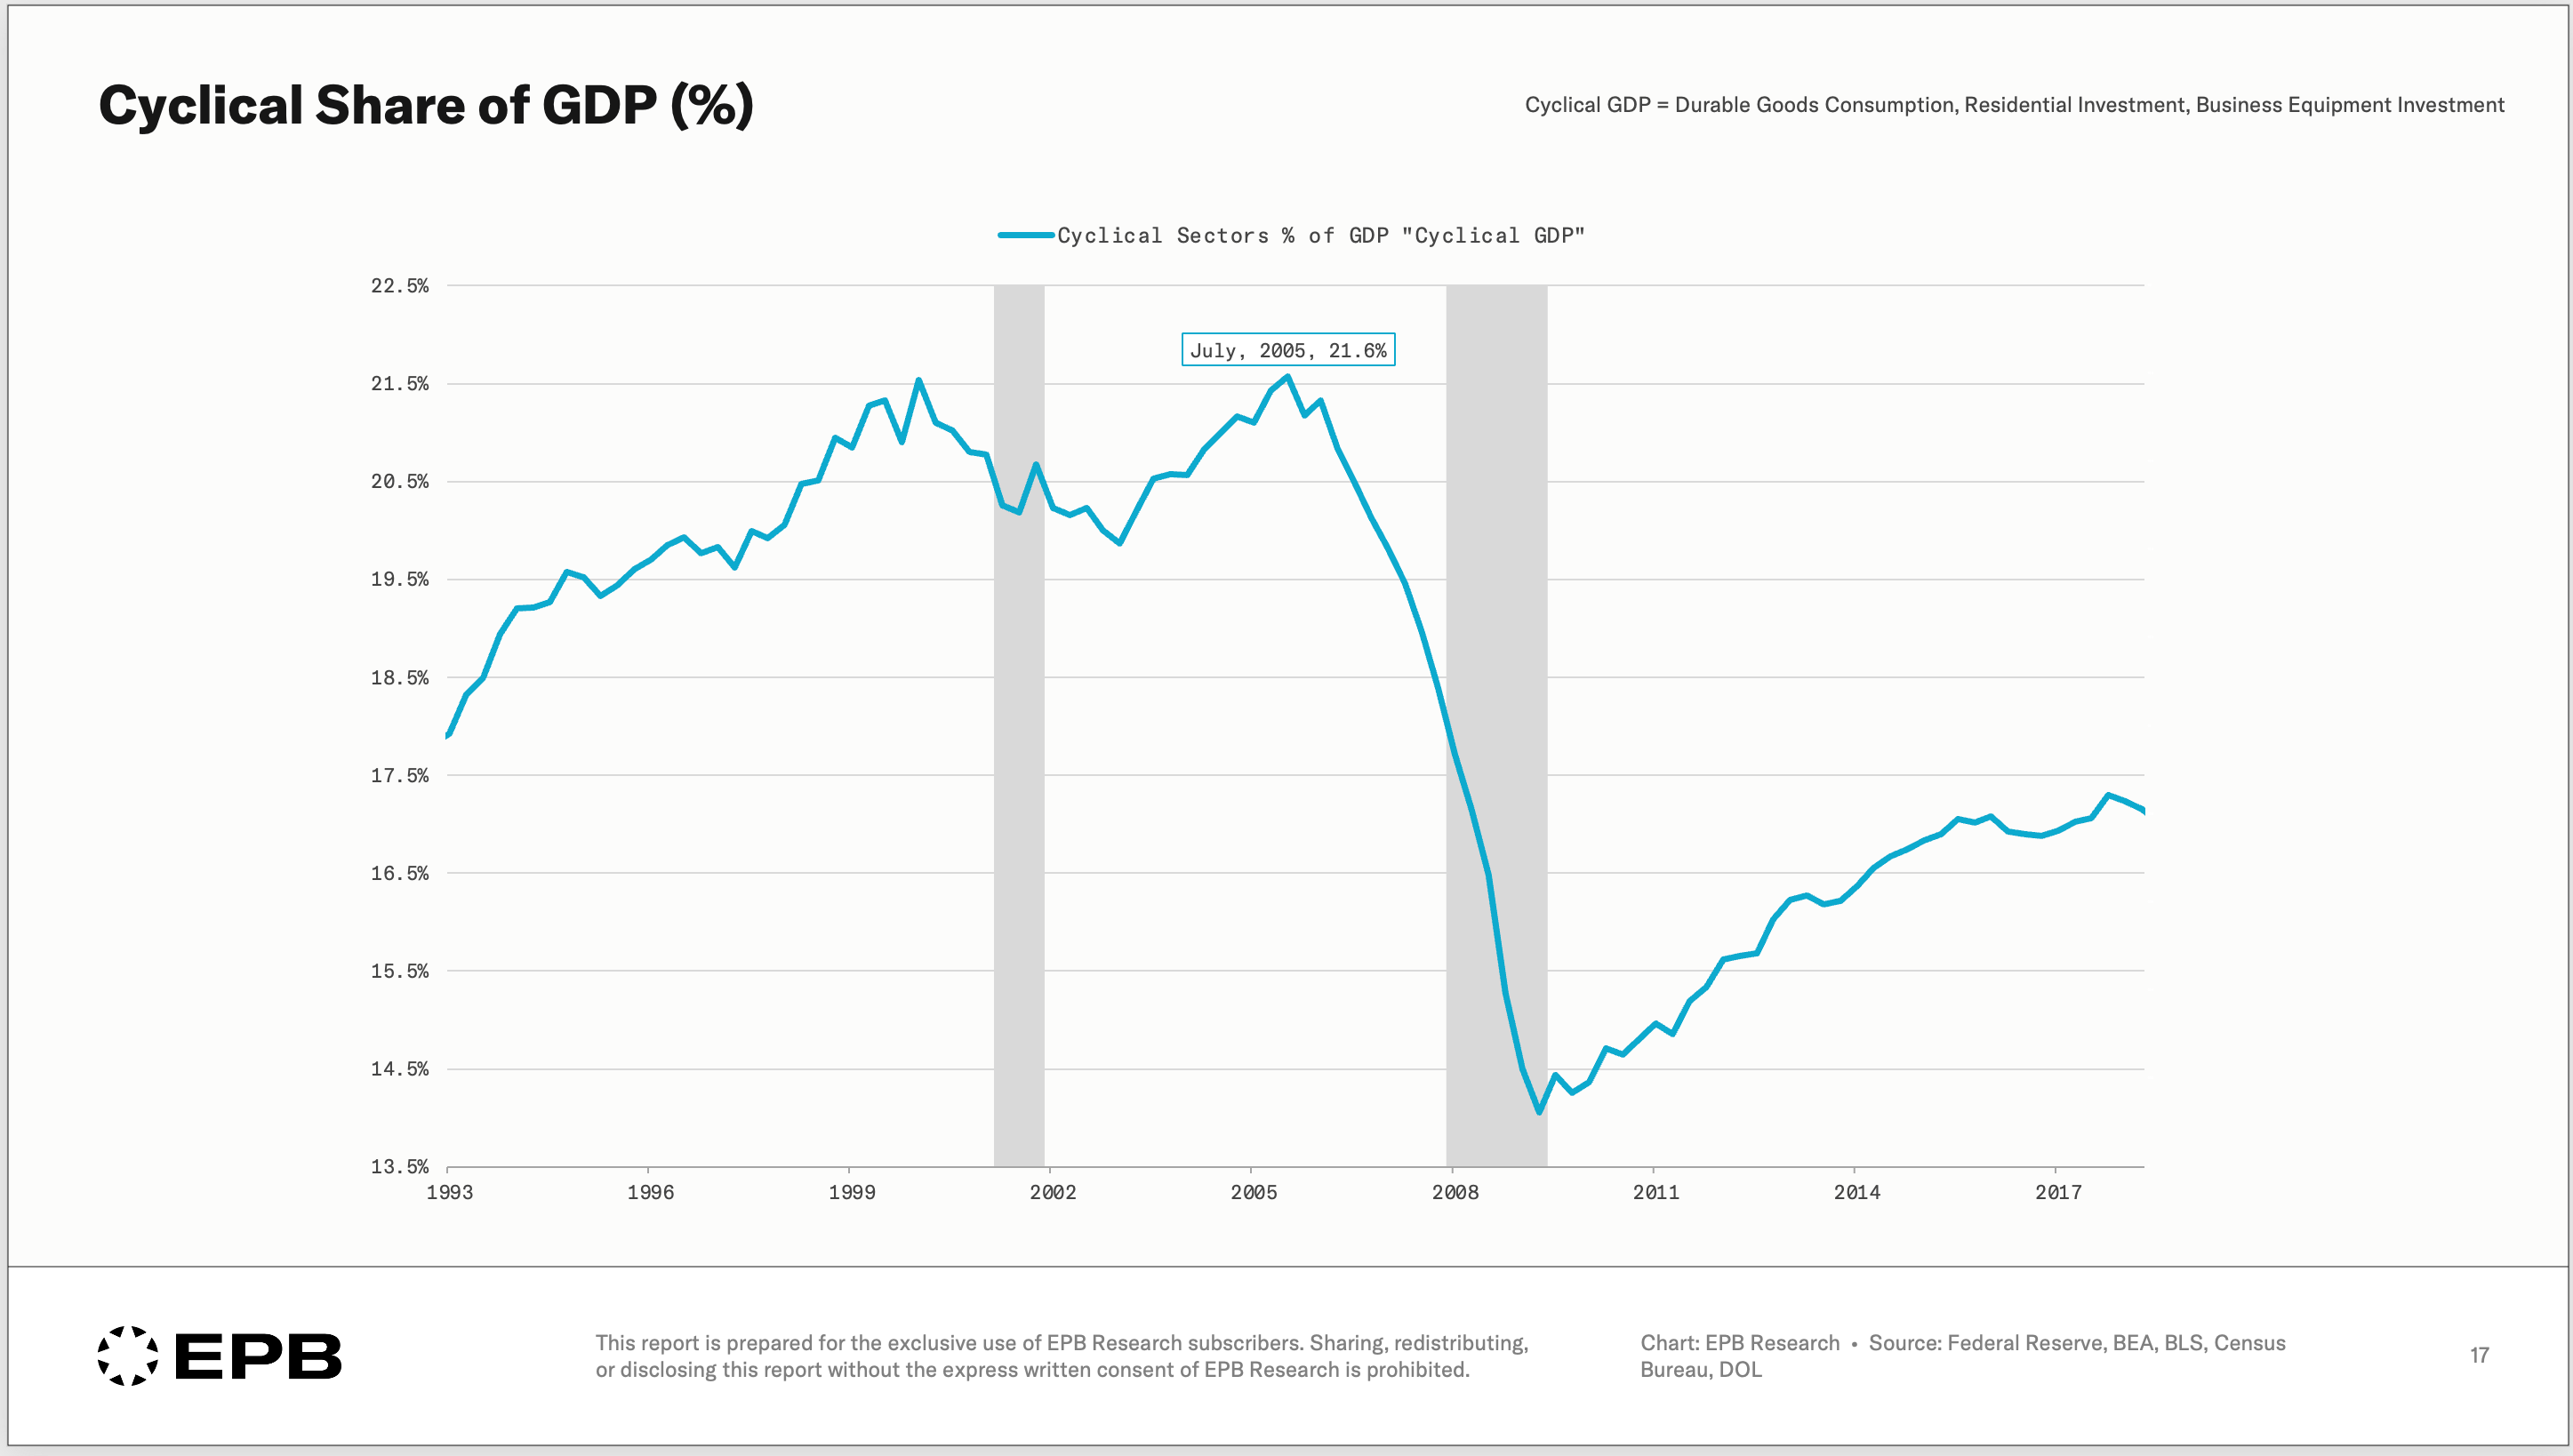
Cyclical GDP is the combination of durable goods consumption, residential investment and business equipment investment - three narrow slices of the economy that are interest rate sensitive and drive all the booms and busts.
The chart below shows Cyclical GDP as a share of total GDP. When the cyclical share of GDP is declining, that is generally a sign that monetary policy has restricted the availability of money & credit and caused a downturn in the interest rate sensitive part of the economy.
A declining share of Cyclical GDP is an early warning sign that the broader economy will cool, since all downturns (and booms) start in the cyclical sectors.
The cyclical share of GDP peaked in Q3 of 2005, long before any discussion of a recession.
Not every recession is seen in all three cyclical sectors, but there is always at least one that drives the downward momentum.
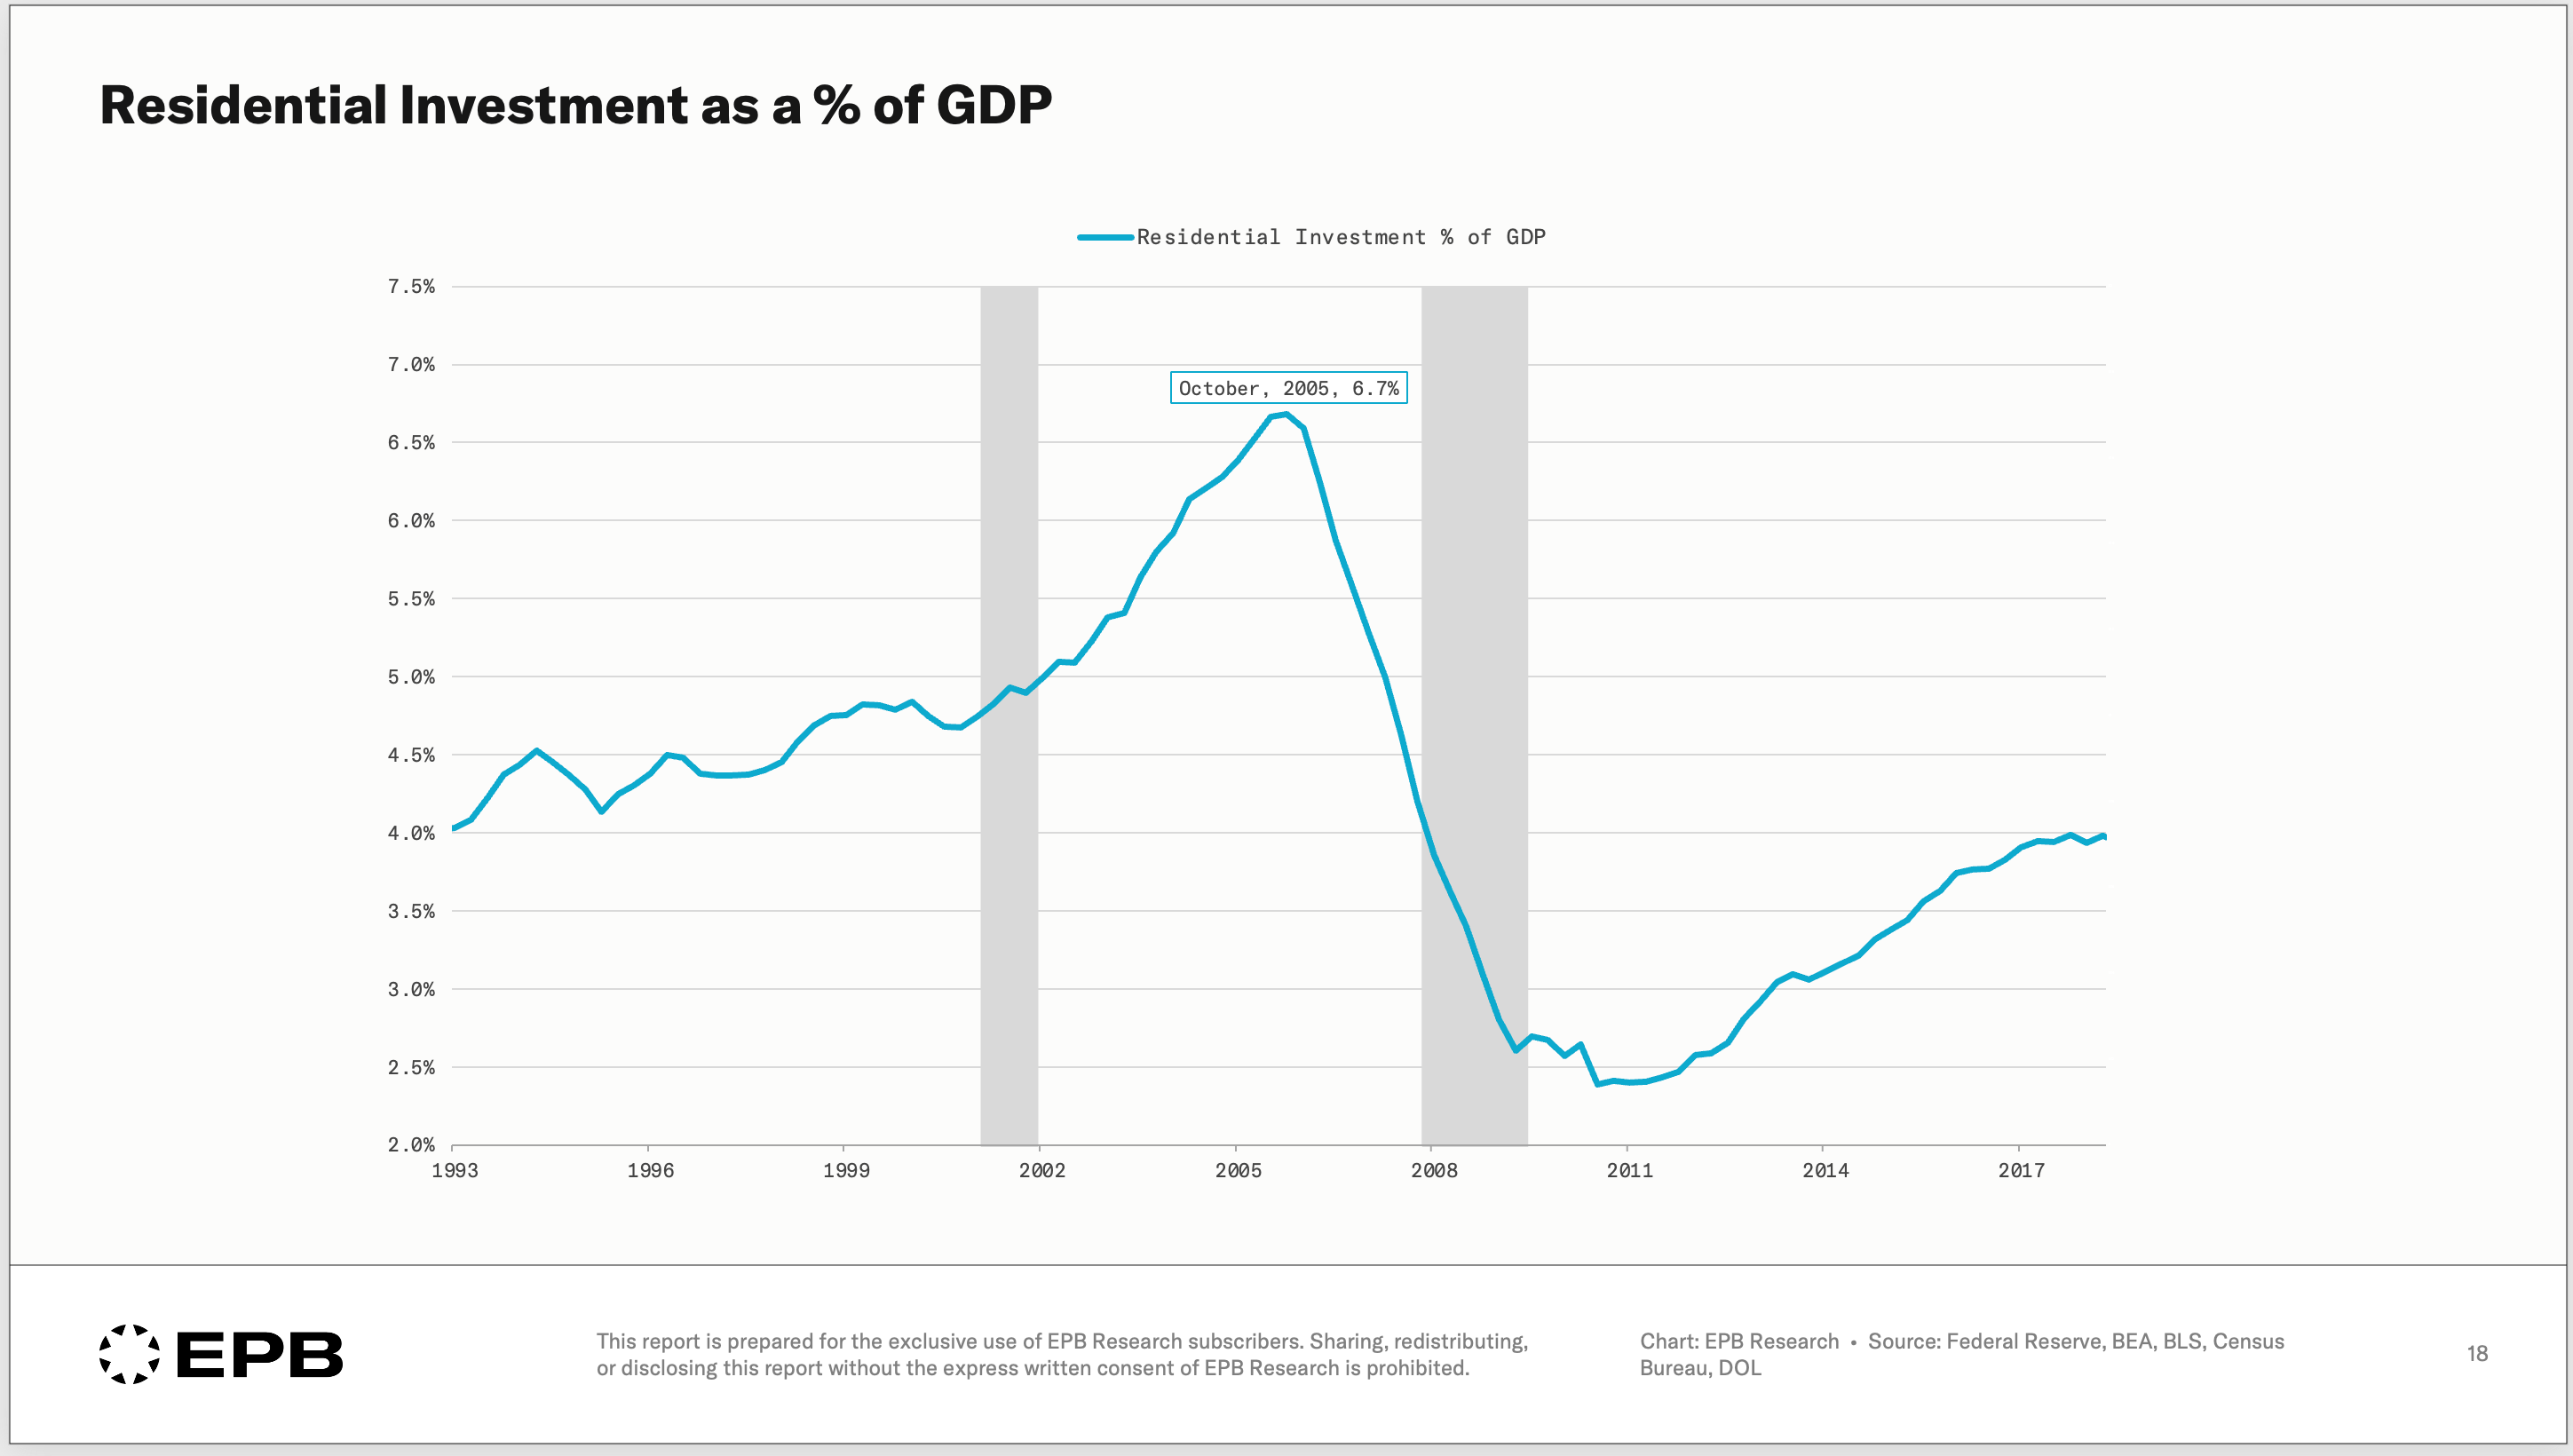
In the 2008 recession, it was, of course, the residential investment component that started declining in 2005 and collapsed through 2010. Equipment investment did not turn down until almost 2008.
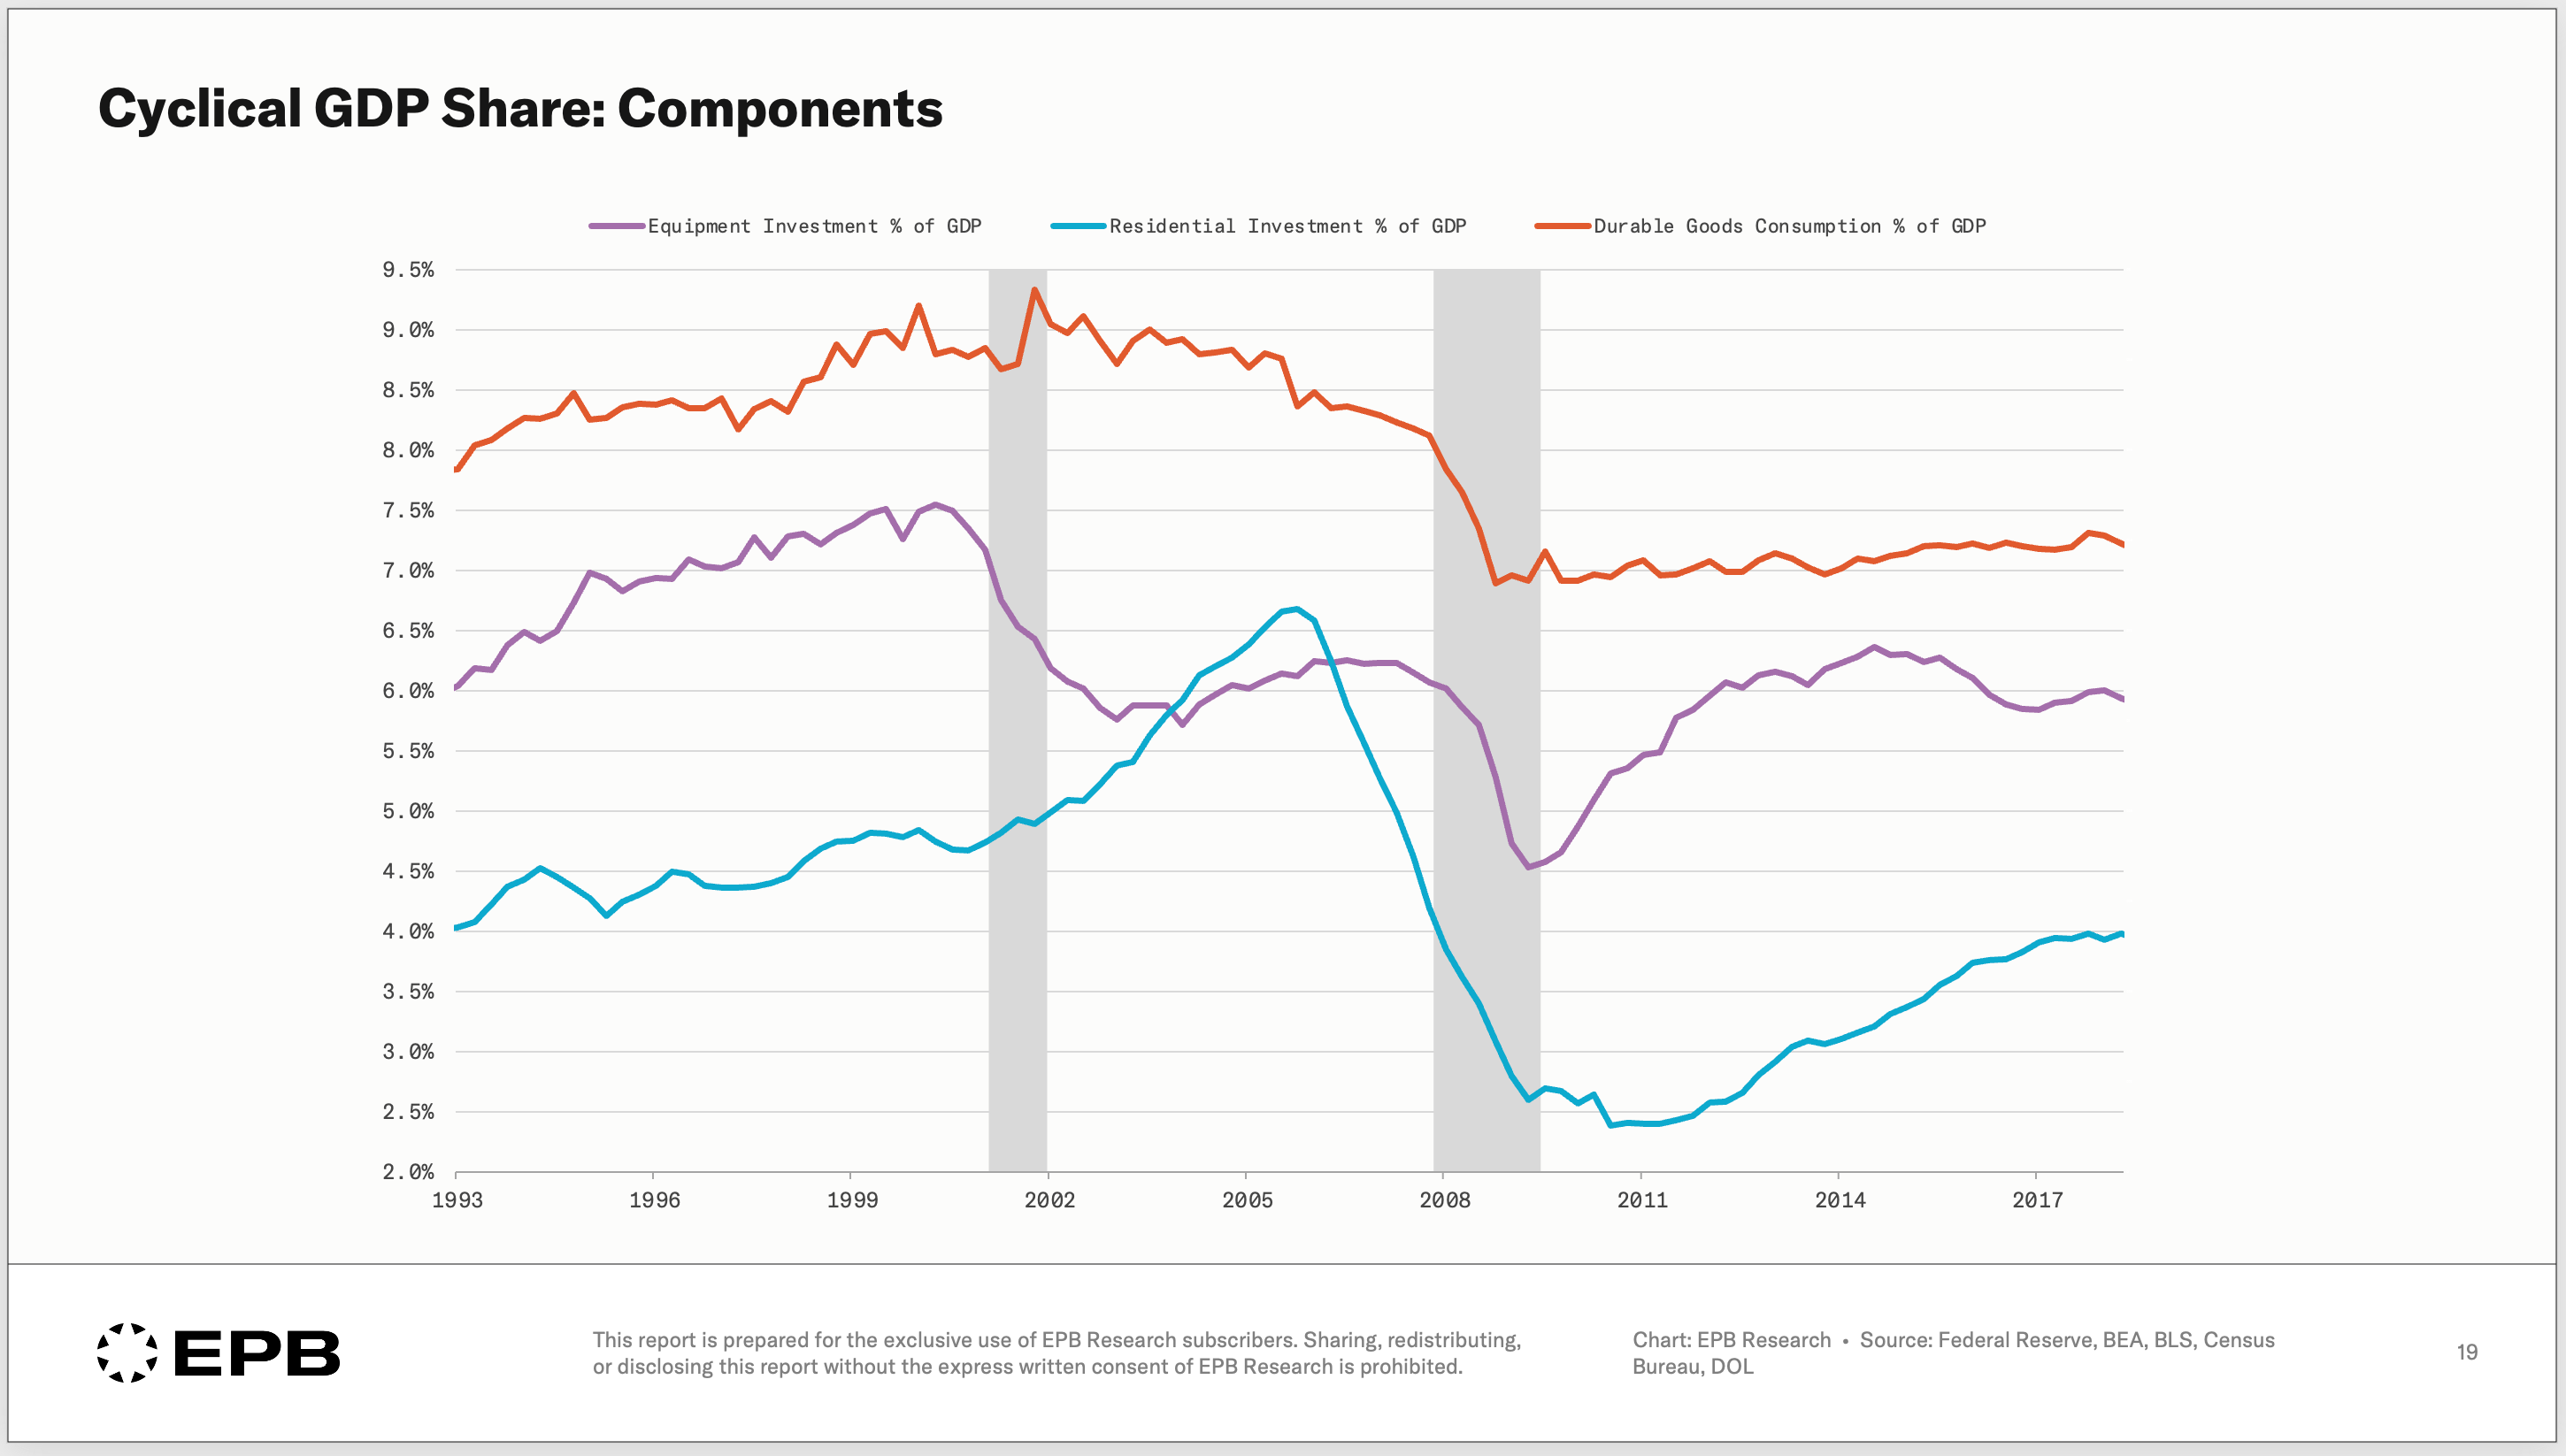
In addition to looking at the cyclical share of GDP chart, the first of three charts that predicted the oncoming recession, it’s useful to look at the composition or breakdown of the three cyclical sectors to identify where the focal point of the downturn is.
By 2007, it was clear the residential investment share of GDP was in free fall and if you use a process or framework that emphasizes the importance of residential investment, recession watch was in full effect.
Part of the problem is that so many investors or economic pundits look at aggregate numbers like total GDP or total nonfarm payrolls and do not subscribe to the idea that it is the narrow cyclical sectors that drive the booms and busts.
For example, the third chart that helped predict the downturn perfectly highlights why most people miss critical turning points in the economy, even when they happen over a year in advance.
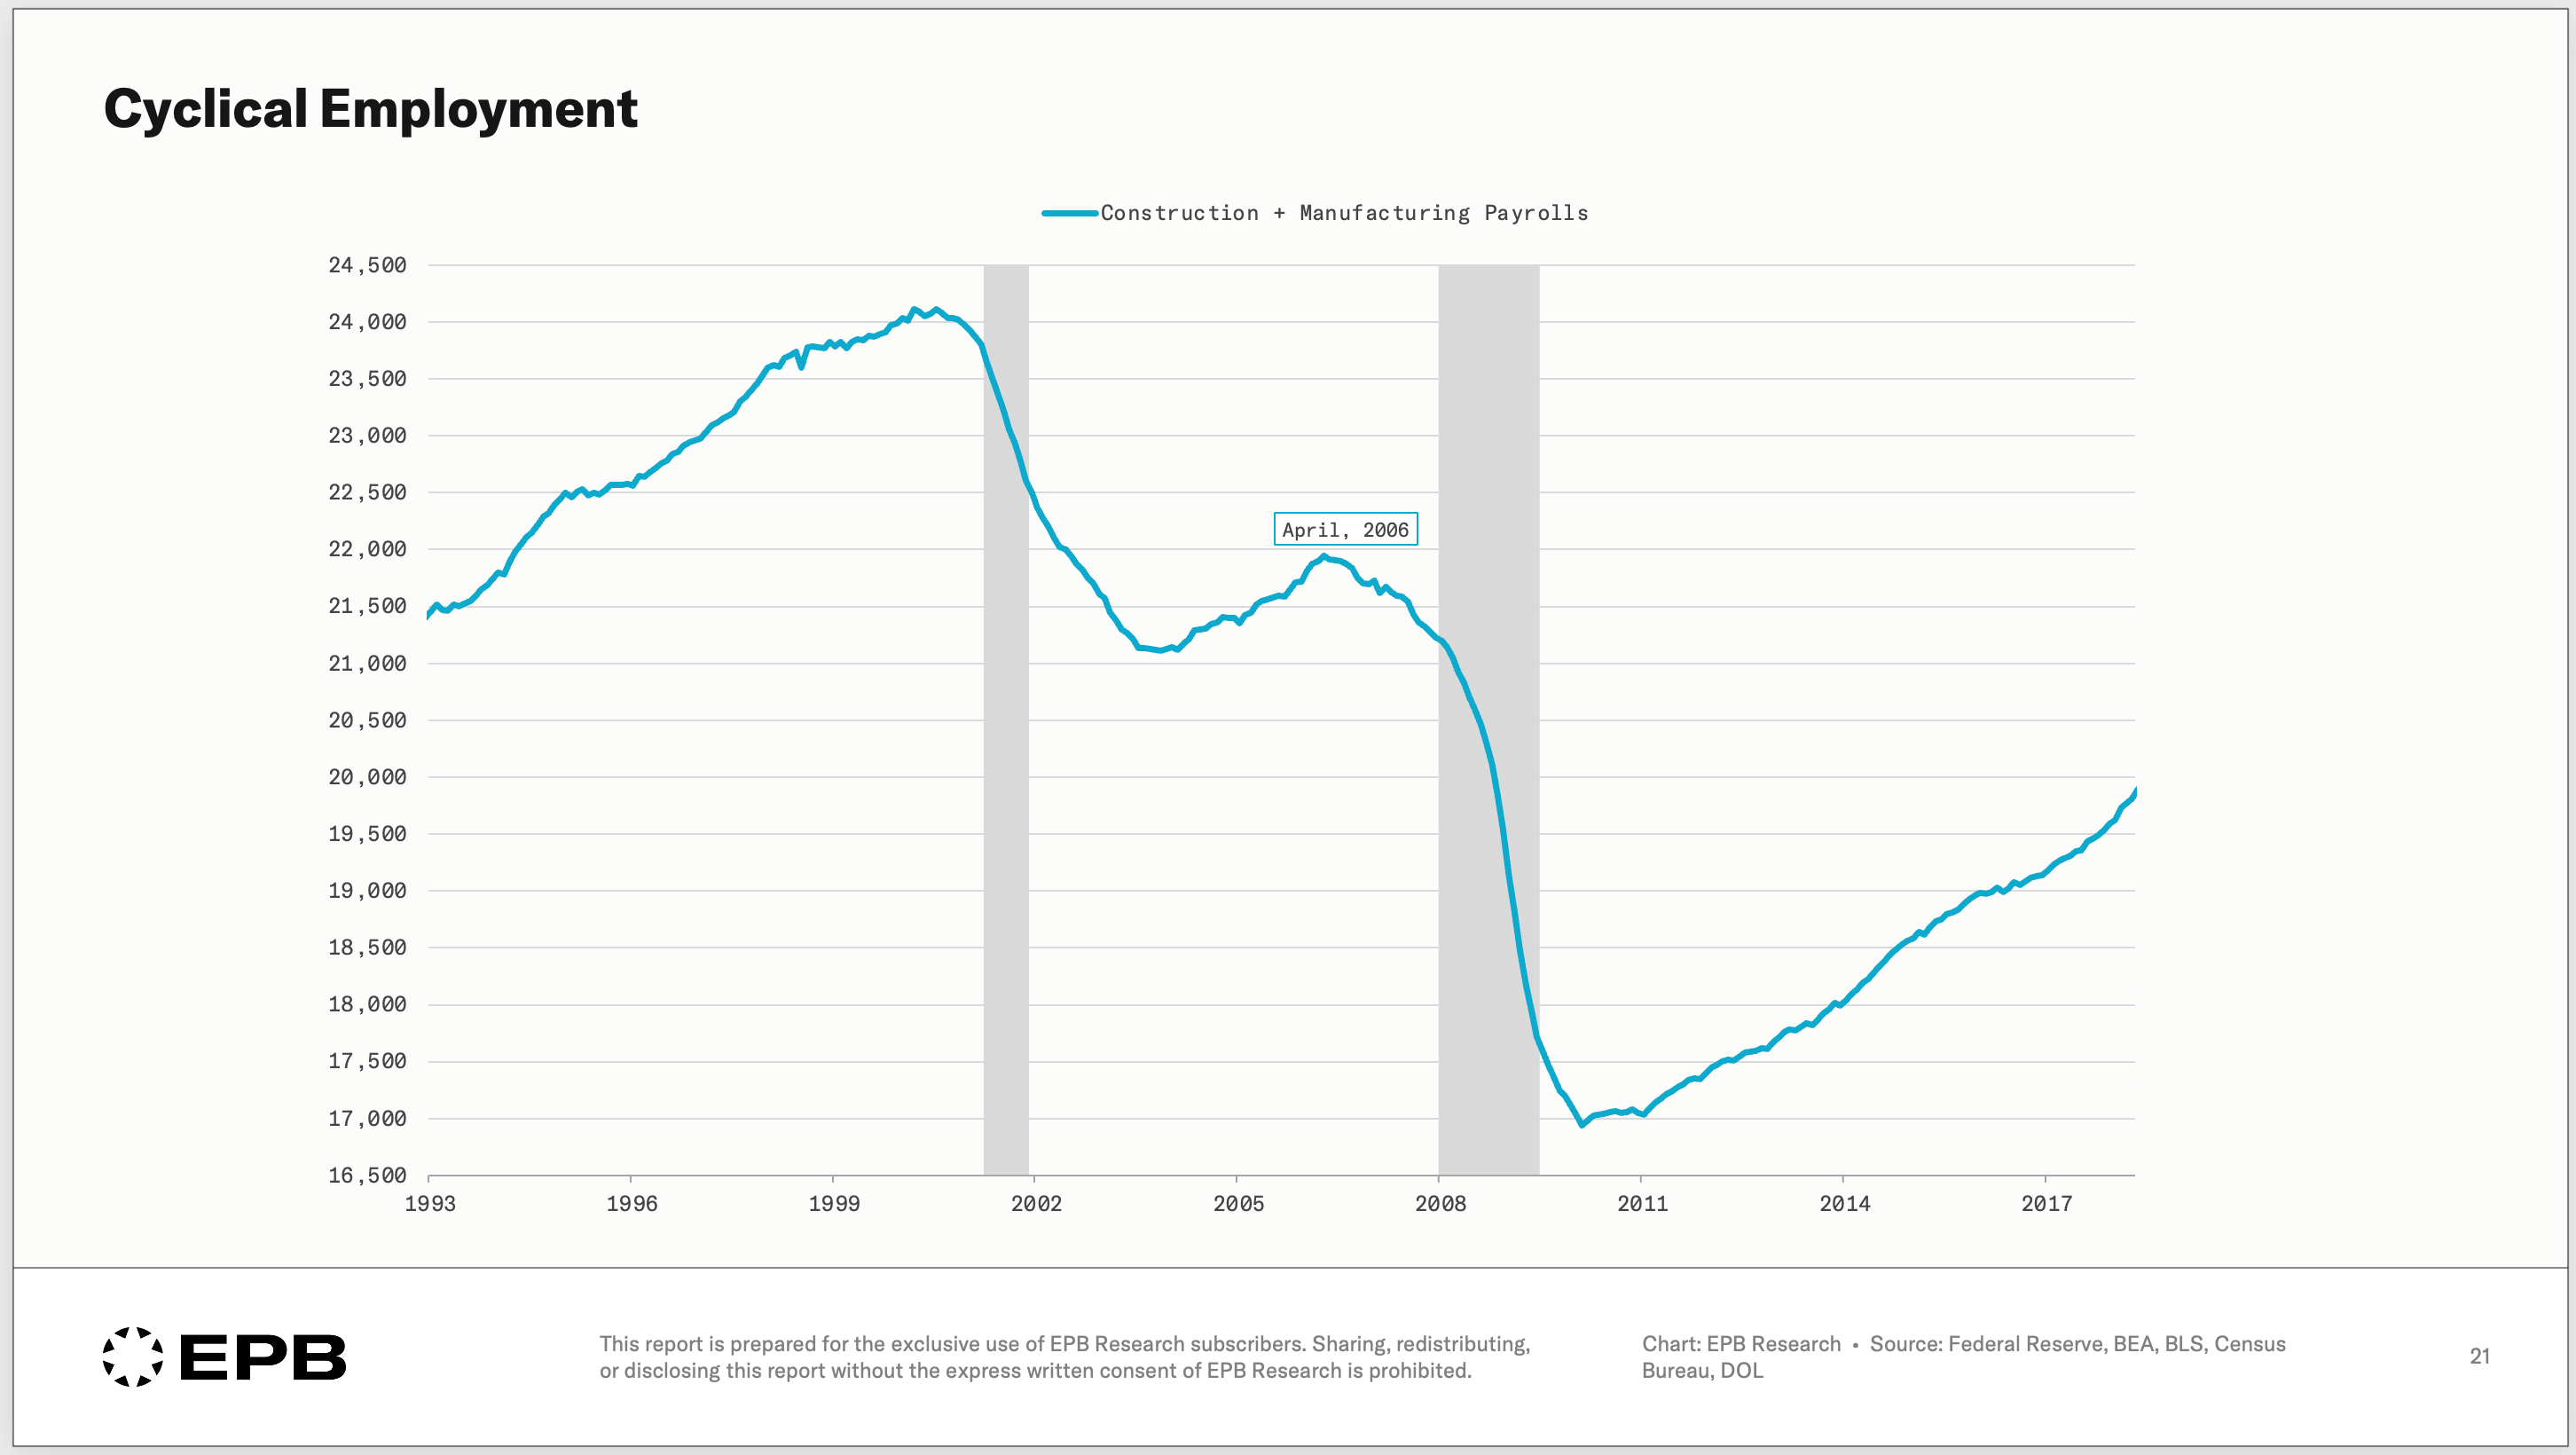
The first picture in this post showed comments from Fed member Lacker, in June of 2008, saying that the labor market has not shown the “accelerating declines” that he feared.
Similar to the cyclical components of GDP, it’s vital to focus on the cyclical sectors of the labor market, namely construction and manufacturing.
By June 2008, the May 2008 labor market report was in hand and it showed more than 1 million job losses for construction and manufacturing employment, declines that started in April 2006, two years before these misguided comments.
By focusing on the 20% of the economy that drives 100% of recessions, spotting economic downturns far in advance is possible.
The 2008 recession was spotted more than 18 months ahead of time by the cyclical share of GDP, the component breakdown highlighting the residential investment focal point, and cyclical employment.
Predicting a global banking crisis is not the purpose of this framework. Rather what a sequential Business Cycle process can do is highlight the brewing vulnerabilities in the parts of the economy that always respond first to changes in monetary policy or the availability of money & credit.
The origin of the 2008 recession in residential construction was as clear cut as it gets. Other recessions originated in durable goods consumption or equipment investment. But in all cases, the combined cyclical part of the economy suffered a downturn earlier and harder than the broader economy.
This framework didn’t stop working after 2008. It’s a consistent, repeatable process built on the foundation of credit-based economic systems.
We use this framework every month at EPB Research to track exactly where we are in the current cycle. The same methodology, applied to current data, plus deep dives on employment, inflation, housing, and more.
If you’d like to see what these indicators are showing right now, and where the cycle is headed next, click the link below to learn more about our premium research services.
I think the downfall of cyclical economy does not cause the fall of the aggregate (although it probably accelerates it), it is just that the cyclical part is the most sensitive and falls first. This is the reason why it is so difficult to time the fall of aggregate economy, 2008 recession is a good example. The cyclical economy started to fall hard in 2006, but the aggregate economy fell first in 2008, two years later. If we take 2001 on the other hand, the cyclical part started to fall hard middle of 2000 and recession started just a few months later as ICJ started to accelerate. This shows indirectly that it is not the cyclical part that causes it, but one can say that when cyclical part starts to fall hard, the probability that aggregate part of the economy will follow goes up drastically, though timing it is still really difficult, especially where there is a part of economy that is pushing against the slowdown (like AI is doing now).