

Why Companies Haven't Cut Jobs (Yet)...
Elevated profit margins are giving businesses more room and time to absorb slowing economic conditions without resorting to wide-scale layoffs. But the labor market cracks are widening.

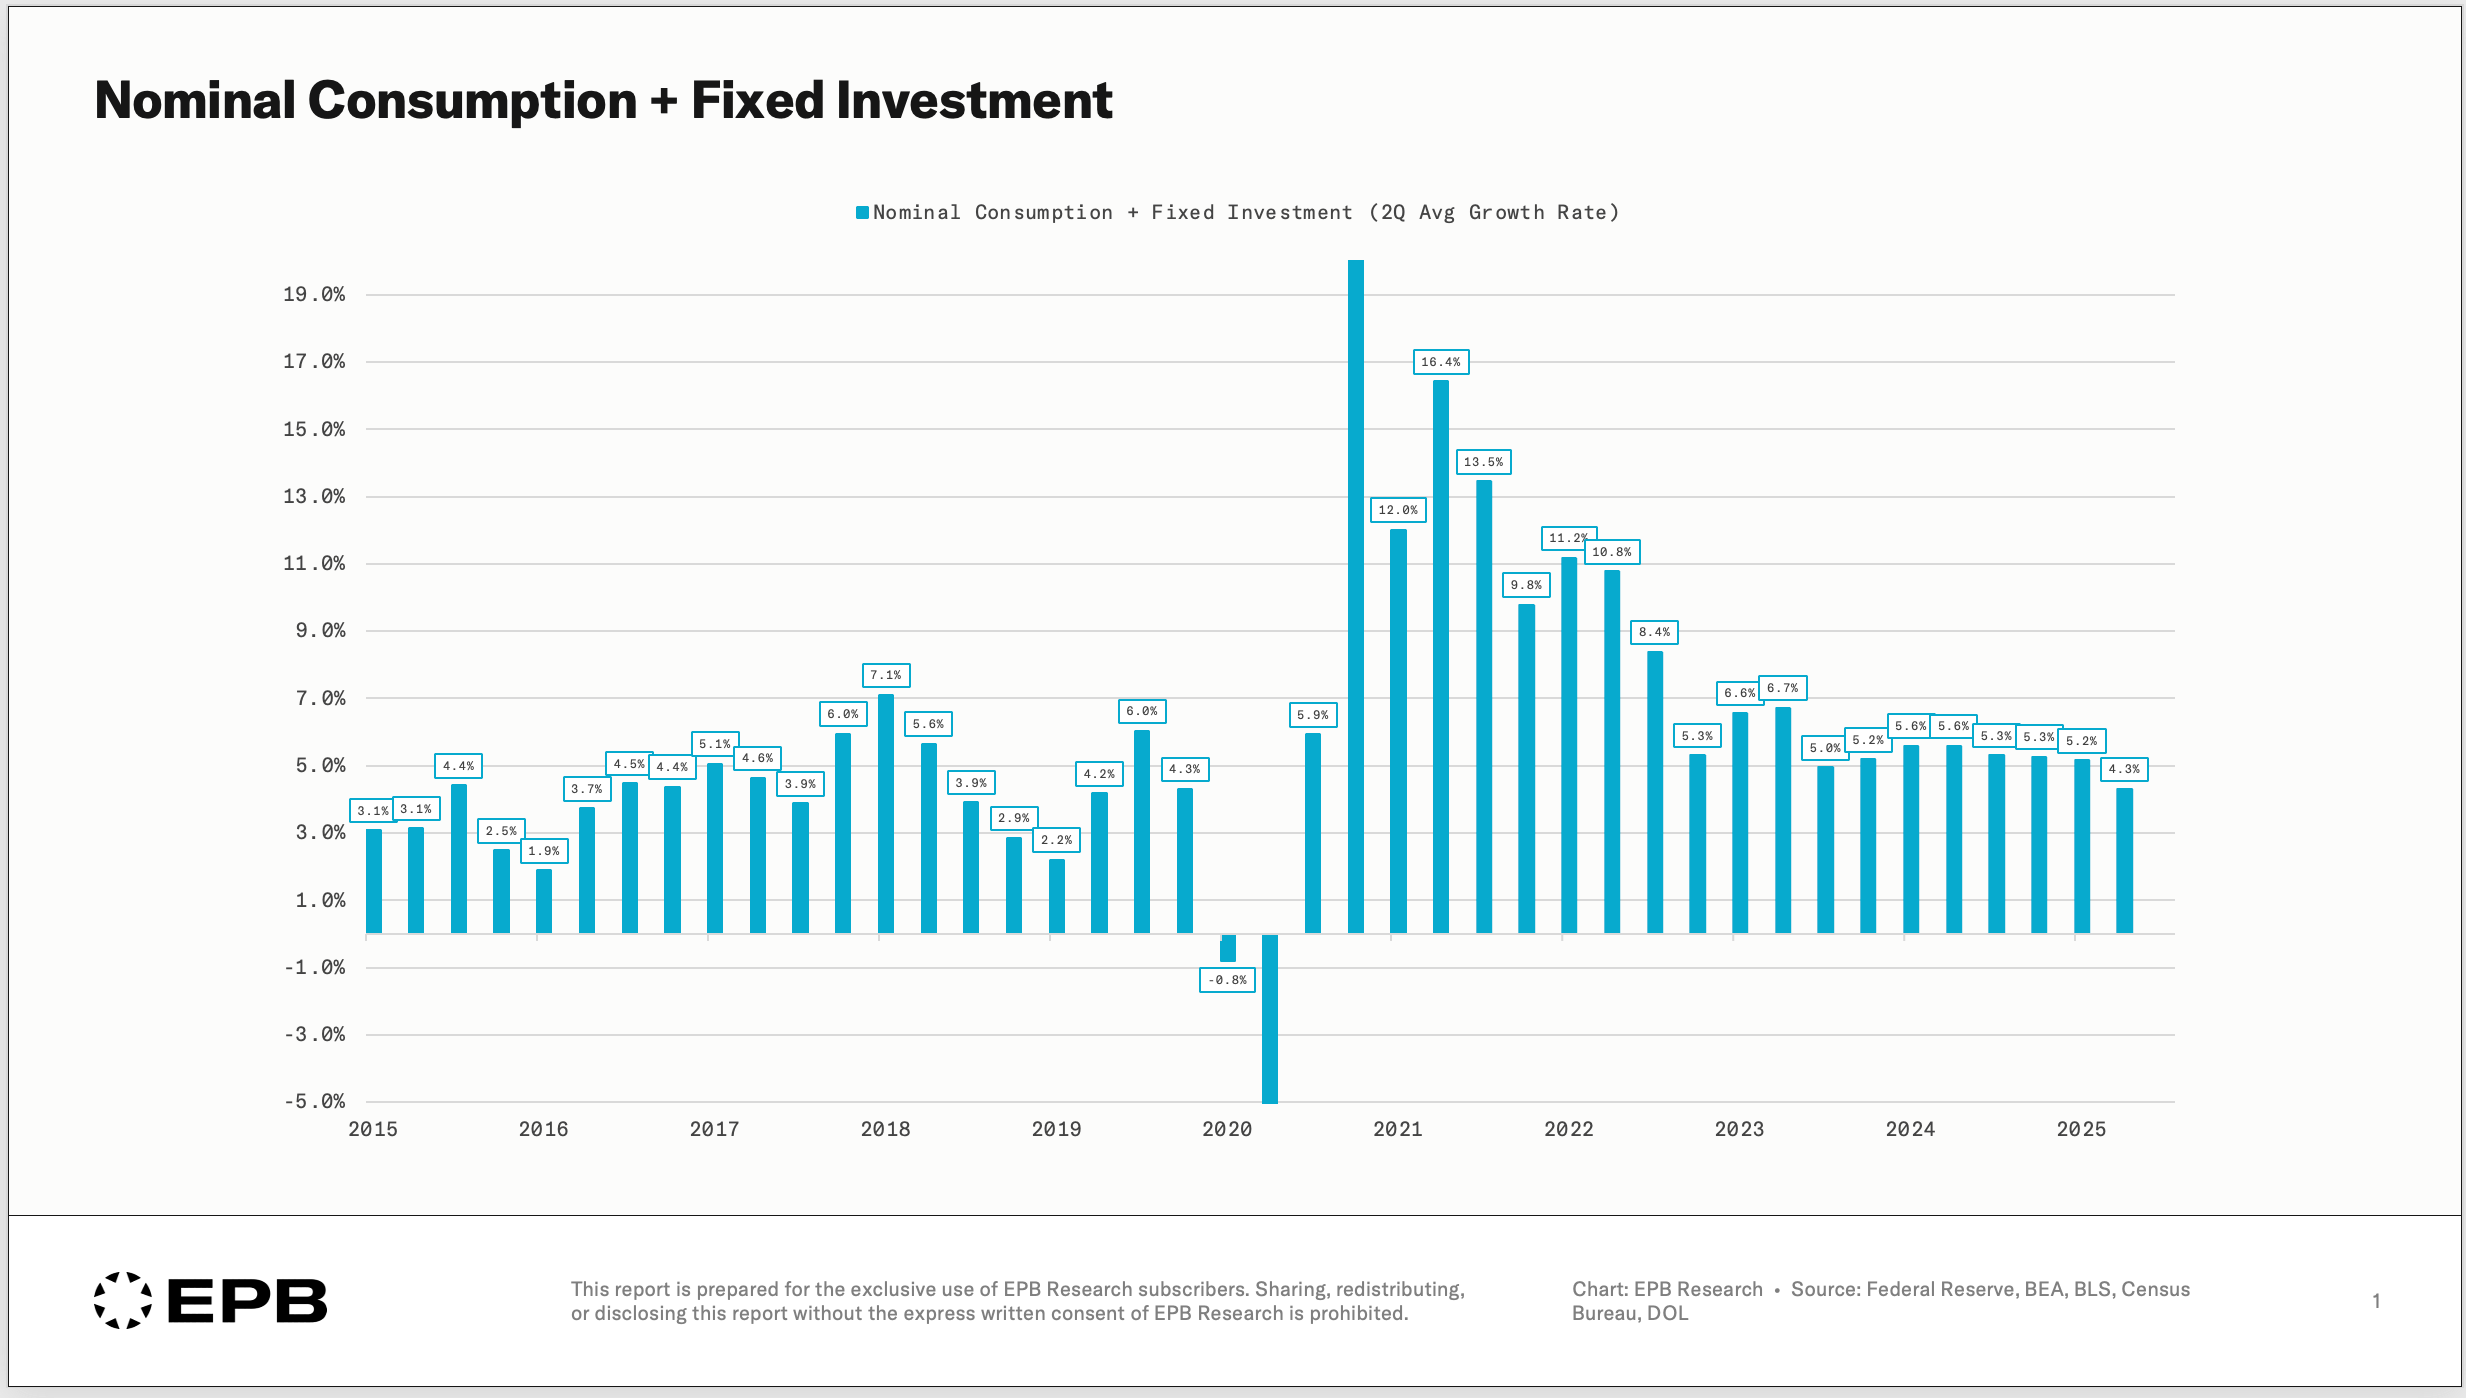
The US economy has been gradually cooling since the peak growth rate of the cycle in 2022, when stunning nominal growth numbers in the 10% range were achieved on the heels of massive pandemic-era support.
Fast forward to 2025, and core nominal growth has declined to 4.3%, the slowest pace since the lockdowns and a pace equal to the average pre-pandemic period when the labor market was far weaker.
While there are clear signs of a cooling labor market, such as a low hiring rate, a reduction in full-time employees, and a rise in the unemployment rate, the economy has been able to avoid large-scale layoffs and thus avoid recession despite three years of decelerating economic activity.
How have companies been able to handle these slowing economic conditions for almost three years without resorting to more aggressive layoffs?
In this post, we’ll see how elevated profit margins are giving businesses more room and time to absorb slowing economic conditions without resorting to wide-scale layoffs - but we’ll also show how cracks are clearly visible and how some industries may be running out of breathing room before layoffs become unavoidable.
Historic Profit Margins
In a purely capitalist, free market economy, profit margins are supposed to be a highly mean-reverting series. If profit margins get too high, new competition enters the market and “competes” for those margins, compressing them down over time.
This was broadly true for the US economy for many decades, but there’s been a subtle change to profit margin dynamics after the 2008 crisis.
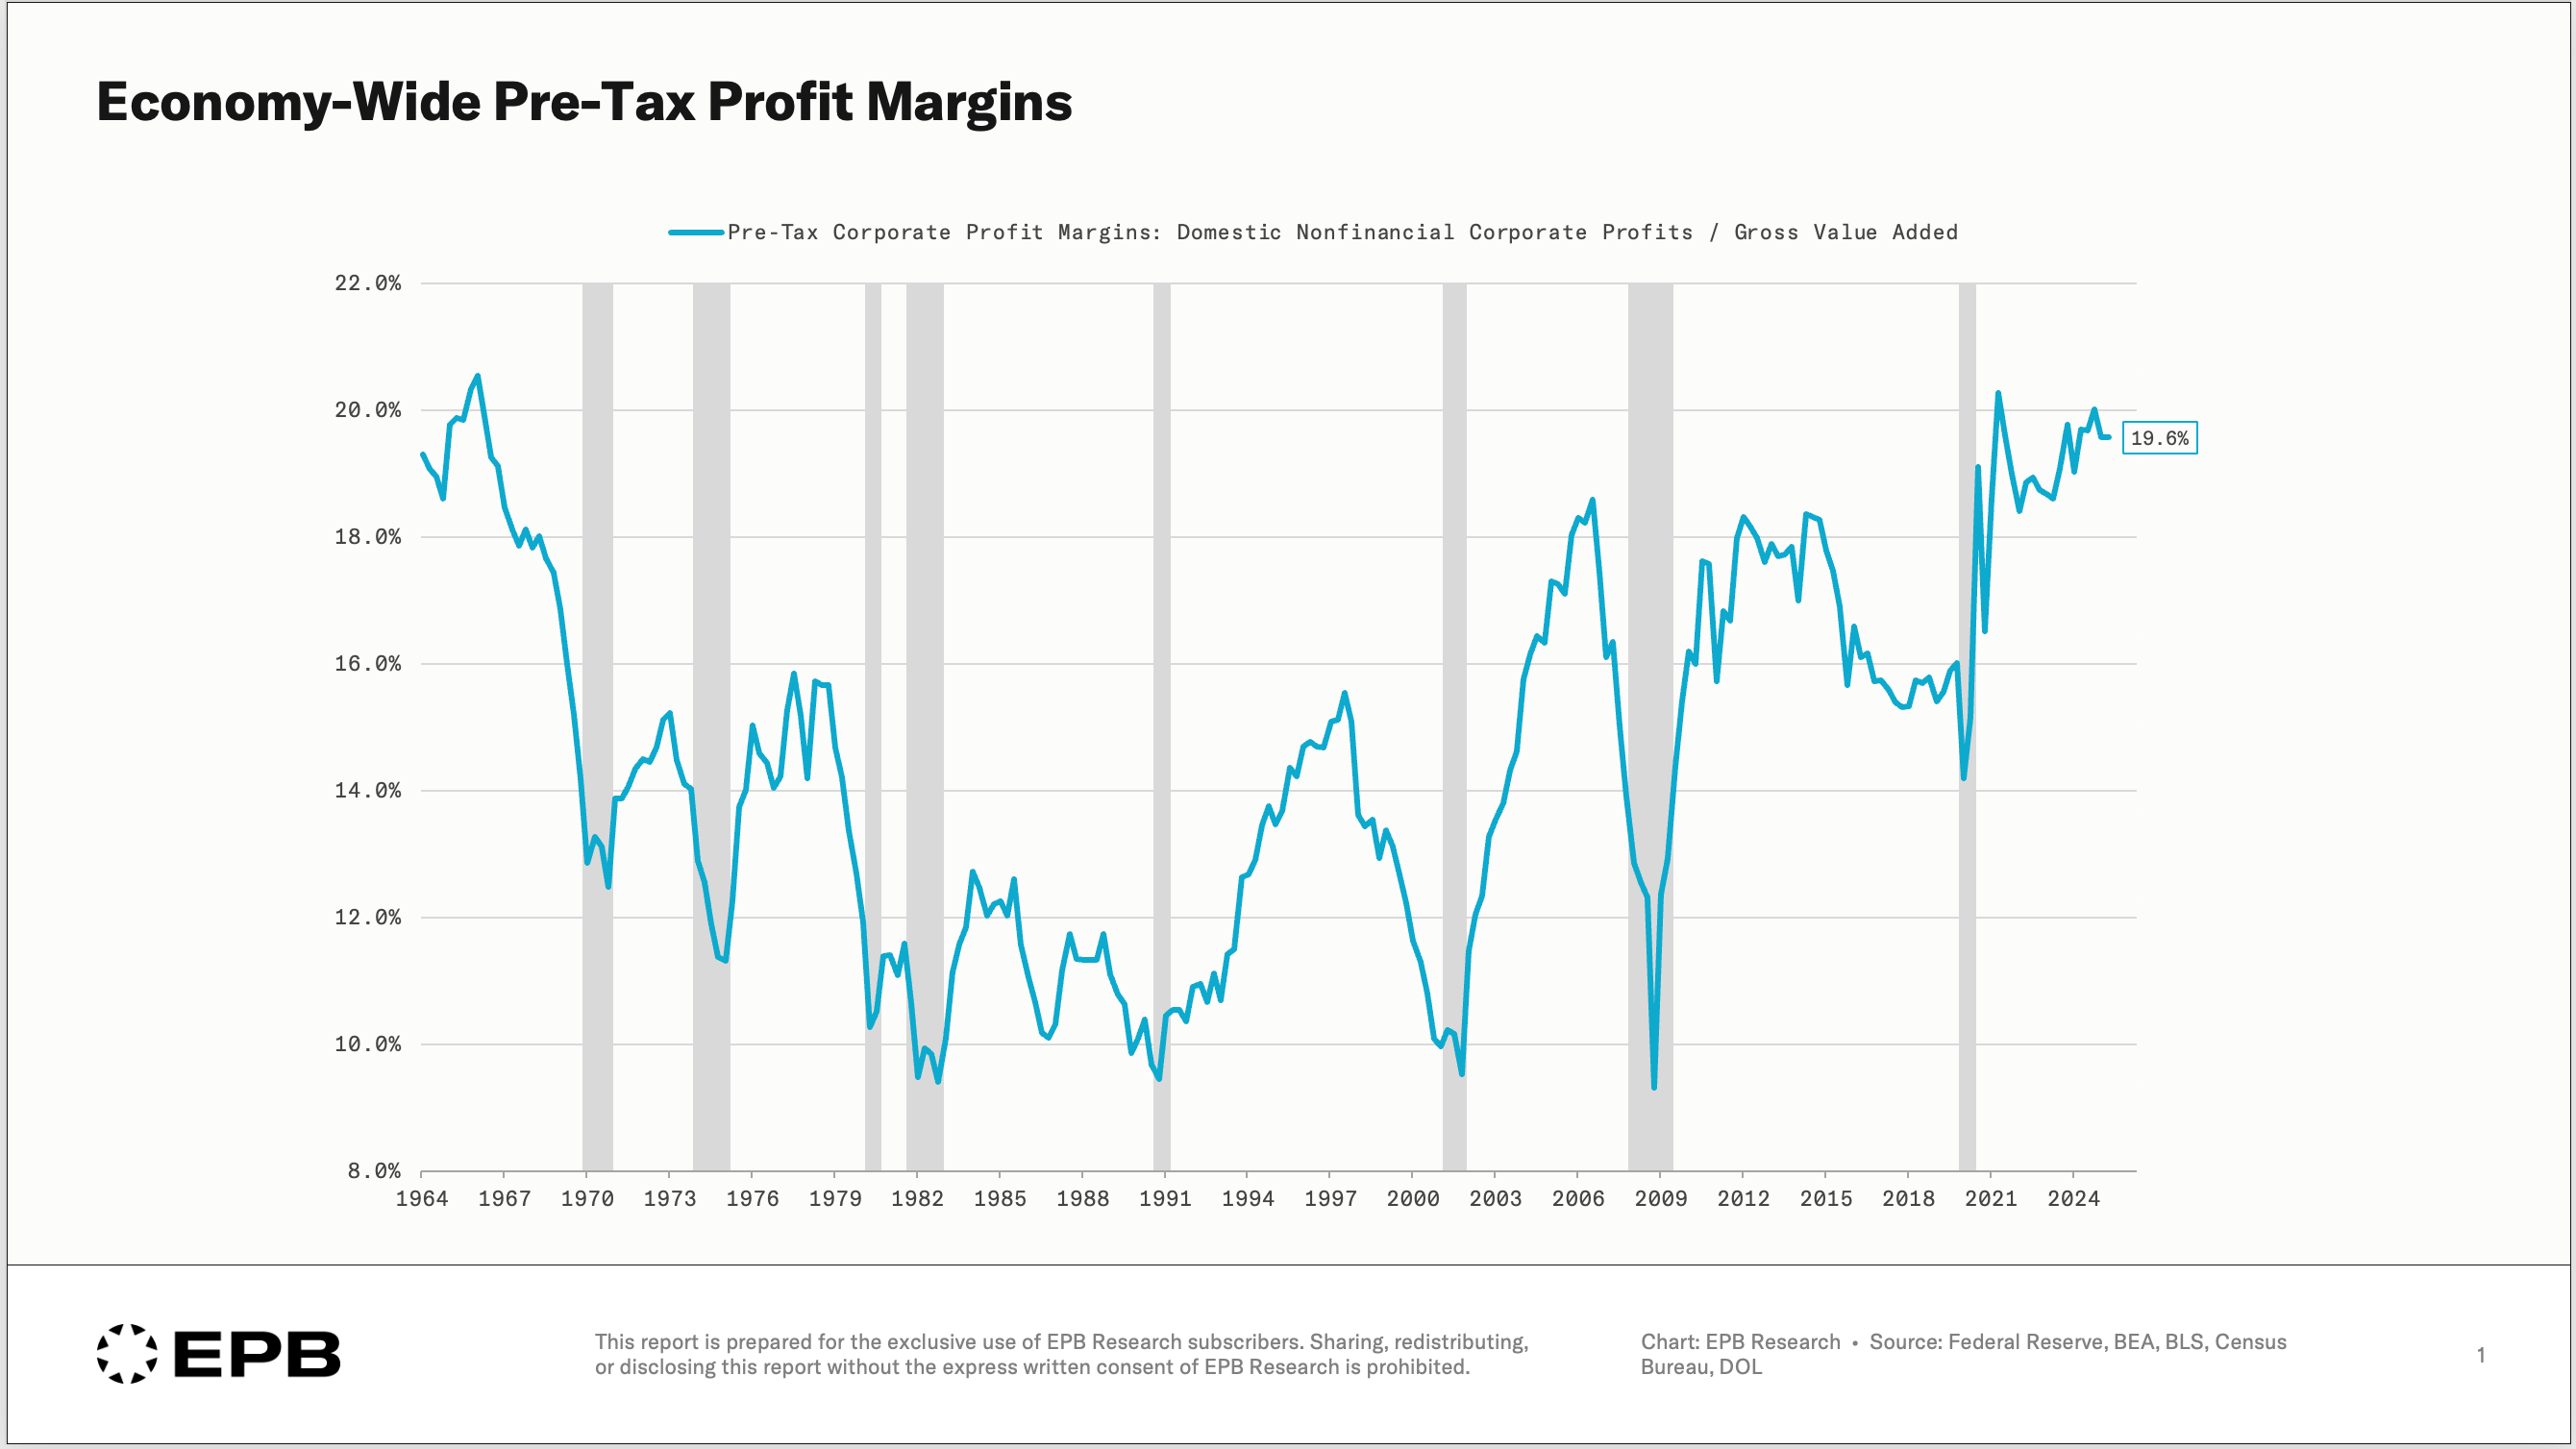
Profit margins found a floor near 10% for five business cycles in a row, spanning from the late 1970s to the early 2010s, but after the 2008 recession, profit margins never fell below 15% aside from one quarter in the pandemic.
Elevated profit margins for more than a decade are not natural in a purely free market-driven economy, and after the pandemic, this issue only got worse.
Across the entire economy, pre-tax profit margins are running near 20%, a staggering number that has given businesses plenty of breathing room to absorb slowing business conditions without resorting to layoffs.
If economic conditions slow, a business can absorb the margin hit with a large cushion, or it can implement a few first-line defenses to preserve margins, such as reducing full-time work, slowing hiring, and cutting back on hours - all measures we’ve seen businesses take already.
But it’s clear that at 20% margins, businesses don’t have the sense of urgency to initiate mass layoffs that they do if margins are 10% and falling.
Yes, It’s Big Tech - But That’s Not The Whole Story
When presented with data on this secular increase in margins, the most common response is that the mega-cap technology companies are responsible for the change.
While this is true to some degree, it does not explain the whole story.
This chart shows that the cumulative operating margins of the six major tech companies are higher than the economy-wide average and still rising to a record 30%.
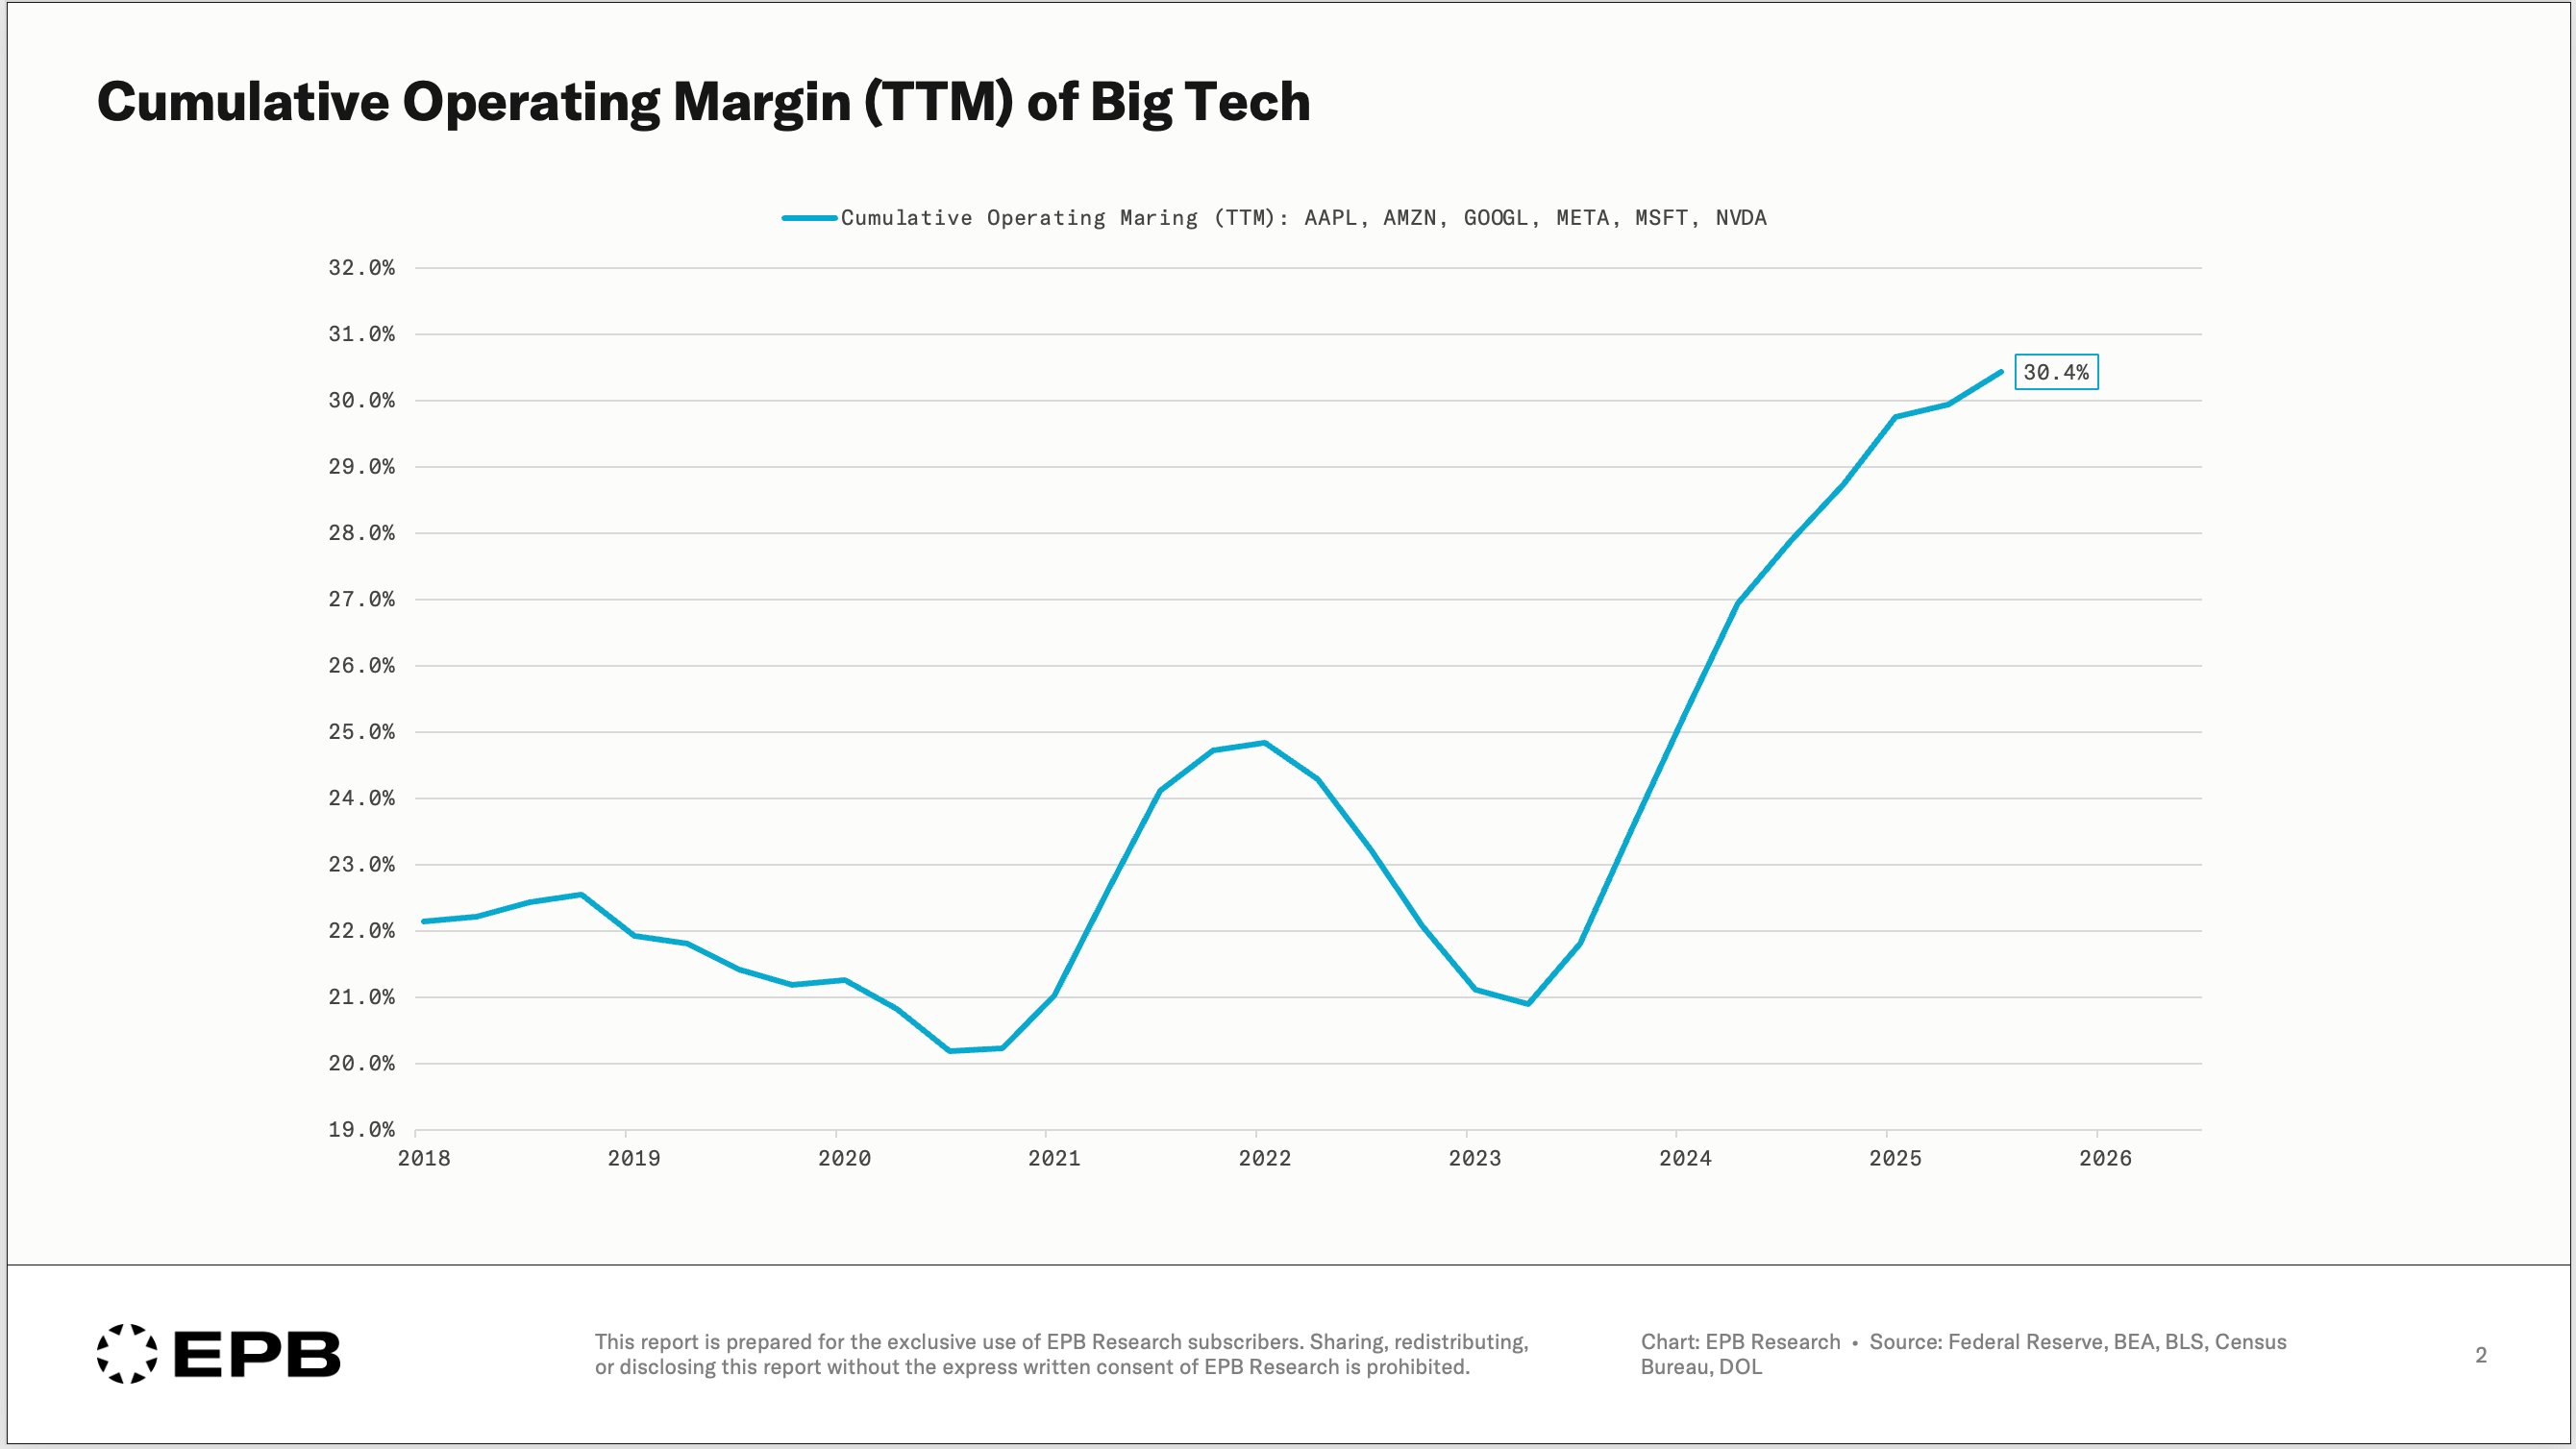
There is no doubt that the major technology companies have monopoly-like characteristics and command above-average profit margins, but this doesn’t explain the full story because we have seen this margin expansion in nearly all industries - even the highly cyclical businesses.
Record Margins For Cyclical Industries Now Compressing
A case could be made that the mega-cap technology companies are not highly cyclical, but that argument cannot be made for industries like residential construction and manufacturing.
Profit margins in residential construction exploded to 20%, the highest level on record in 2022, and the same dynamic was seen in manufacturing.
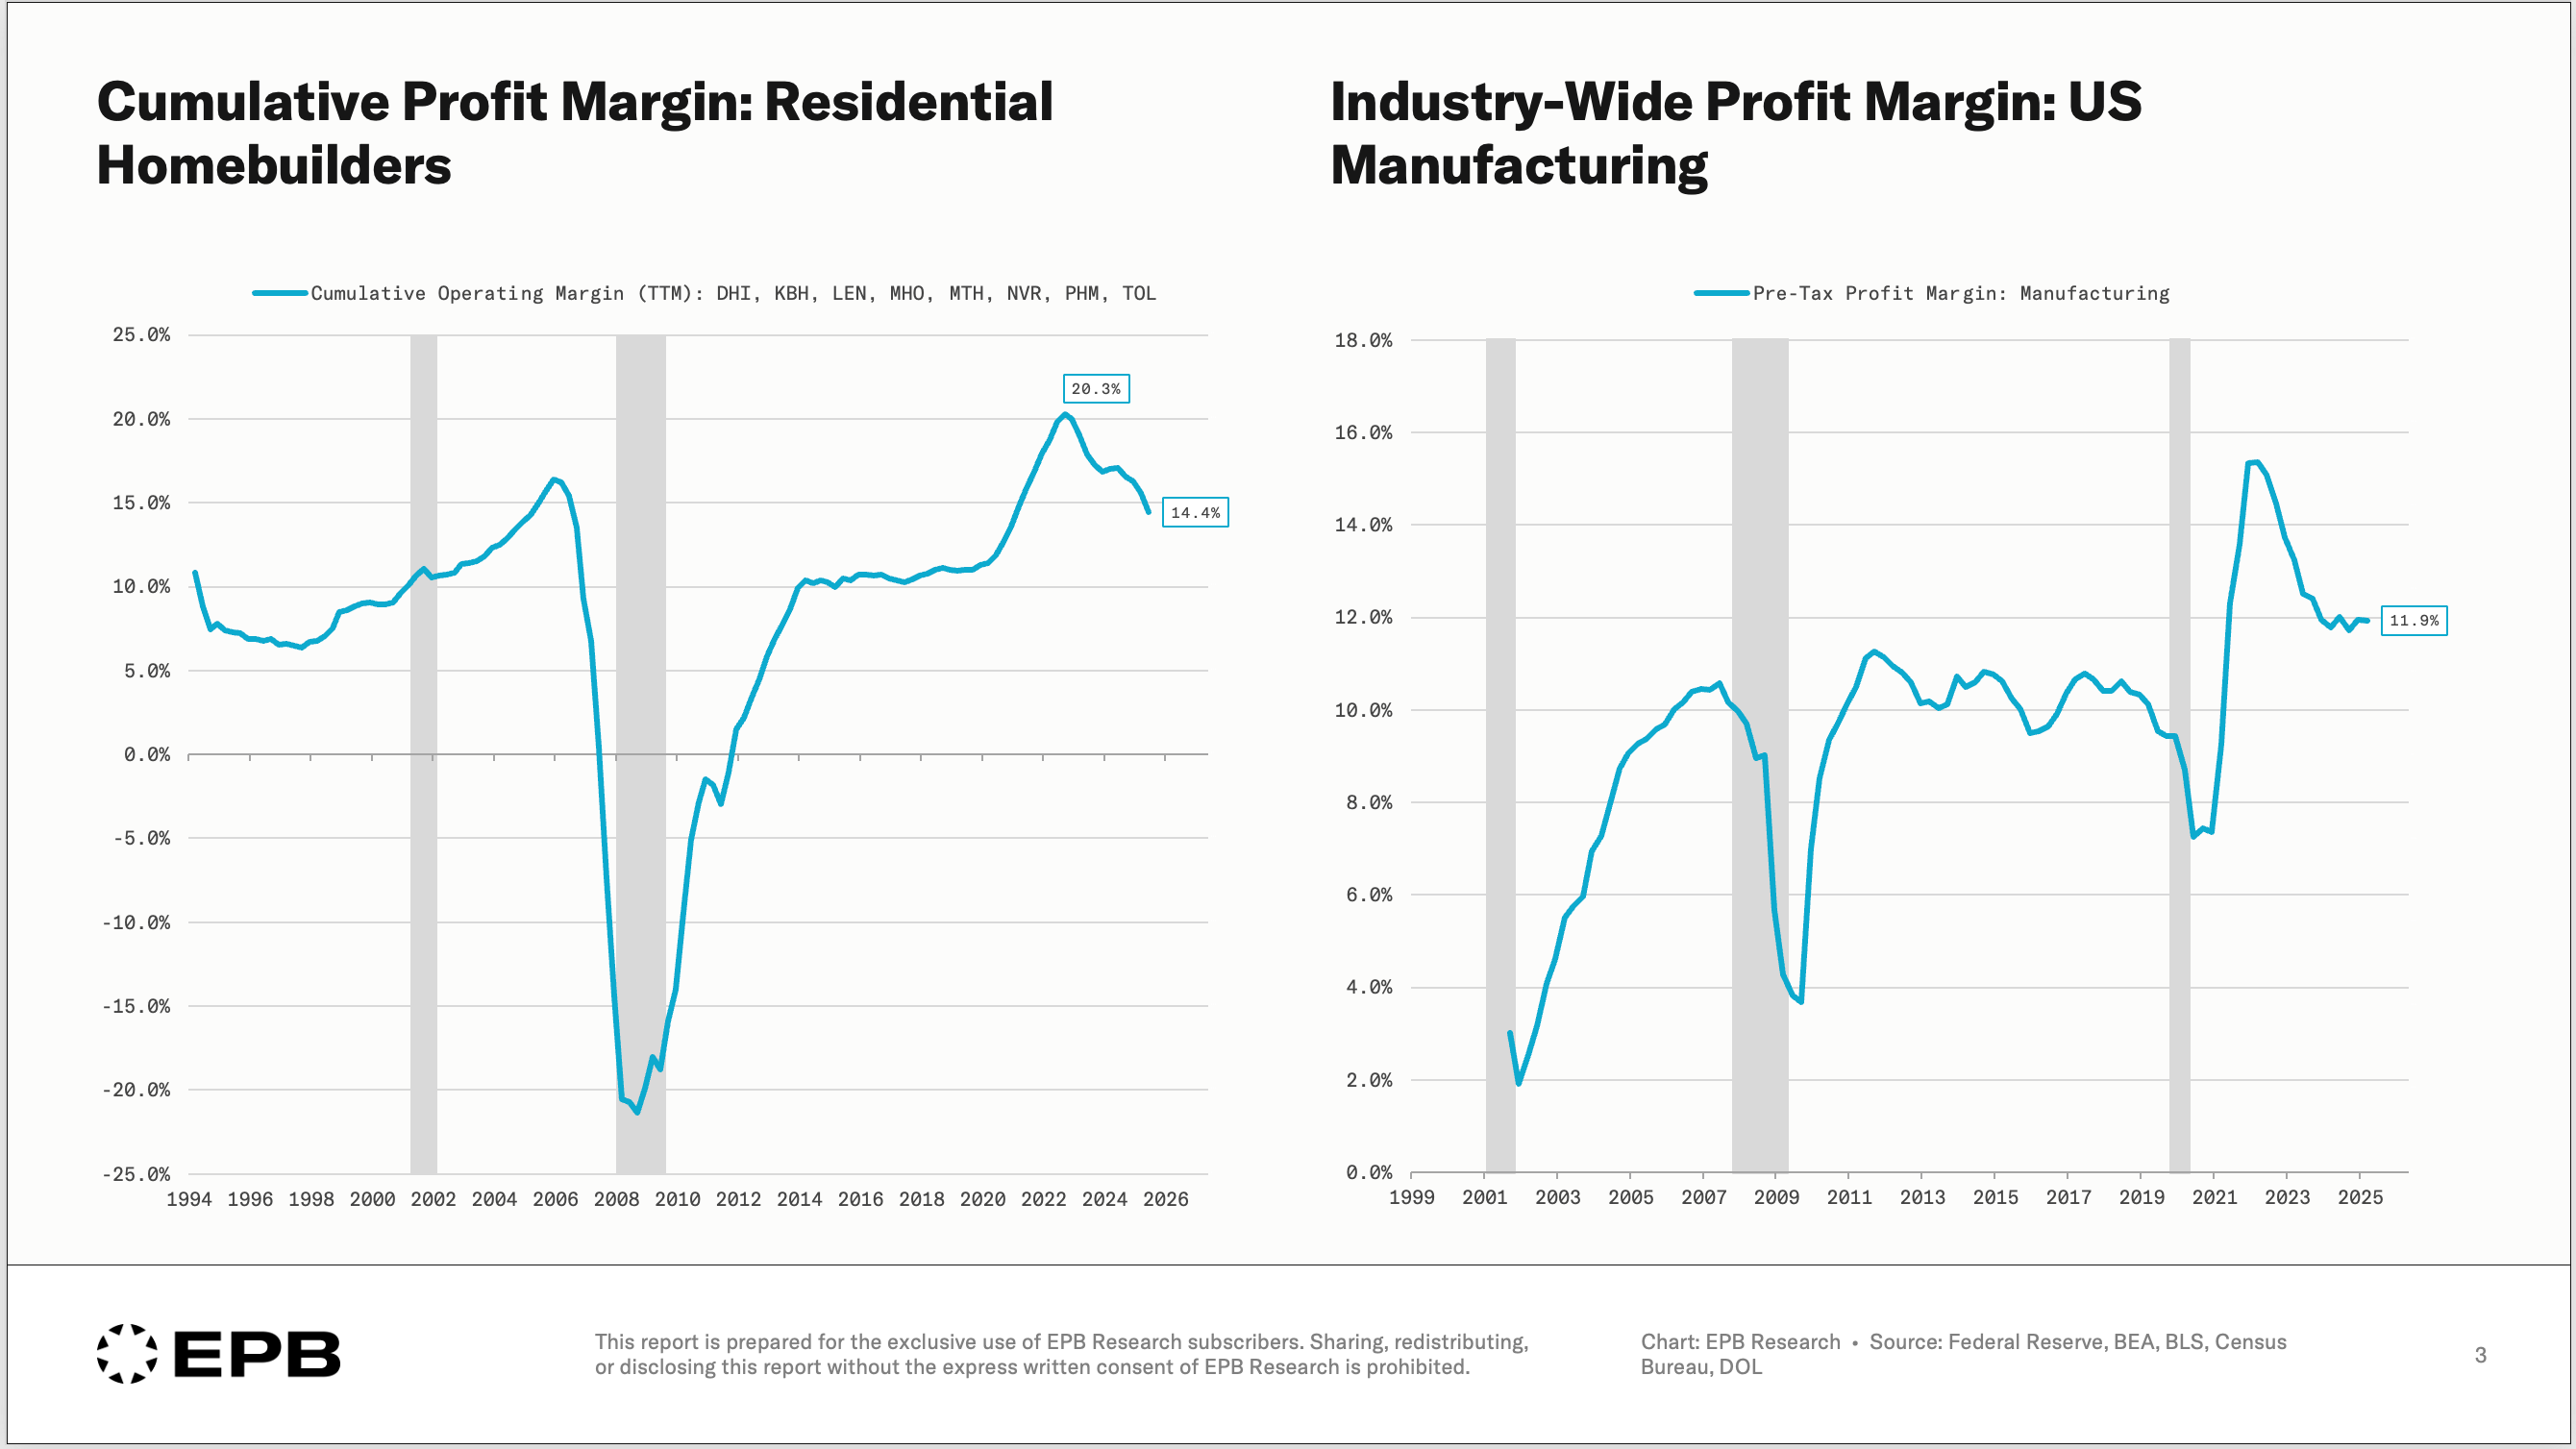
As economic growth peaked in 2022, margins started to compress for these cyclical businesses, which is normal and expected. However, what has been abnormal is that the cyclical industries have been slowing for nearly three years, margins have been compressing, but margins for both residential construction and manufacturing are higher today than before the pandemic.
Focusing on residential construction, profit margins have compressed 600bps from 20% to 14%, a very large decline. At any other point in history, a 600bps compression in profit margins would have likely led to layoffs as companies scrambled to protect rapidly falling profitability.
However, today, a 600bps decline in margins has left companies still more profitable than they were just six years ago - enough to make them throttle labor intensity and stop hiring, but not enough to force wide-scale layoffs.
We can see this dynamic playing out in our Cyclical Employment Index, something we cover each month in our premium Business Cycle Trends Updates.
In the EPB Four Economy Framework, the Cyclical Employment Index focuses on nonfarm payrolls of the Cyclical Economy - the part of the labor market that always moves first and drives the vast majority of job losses during recessions.
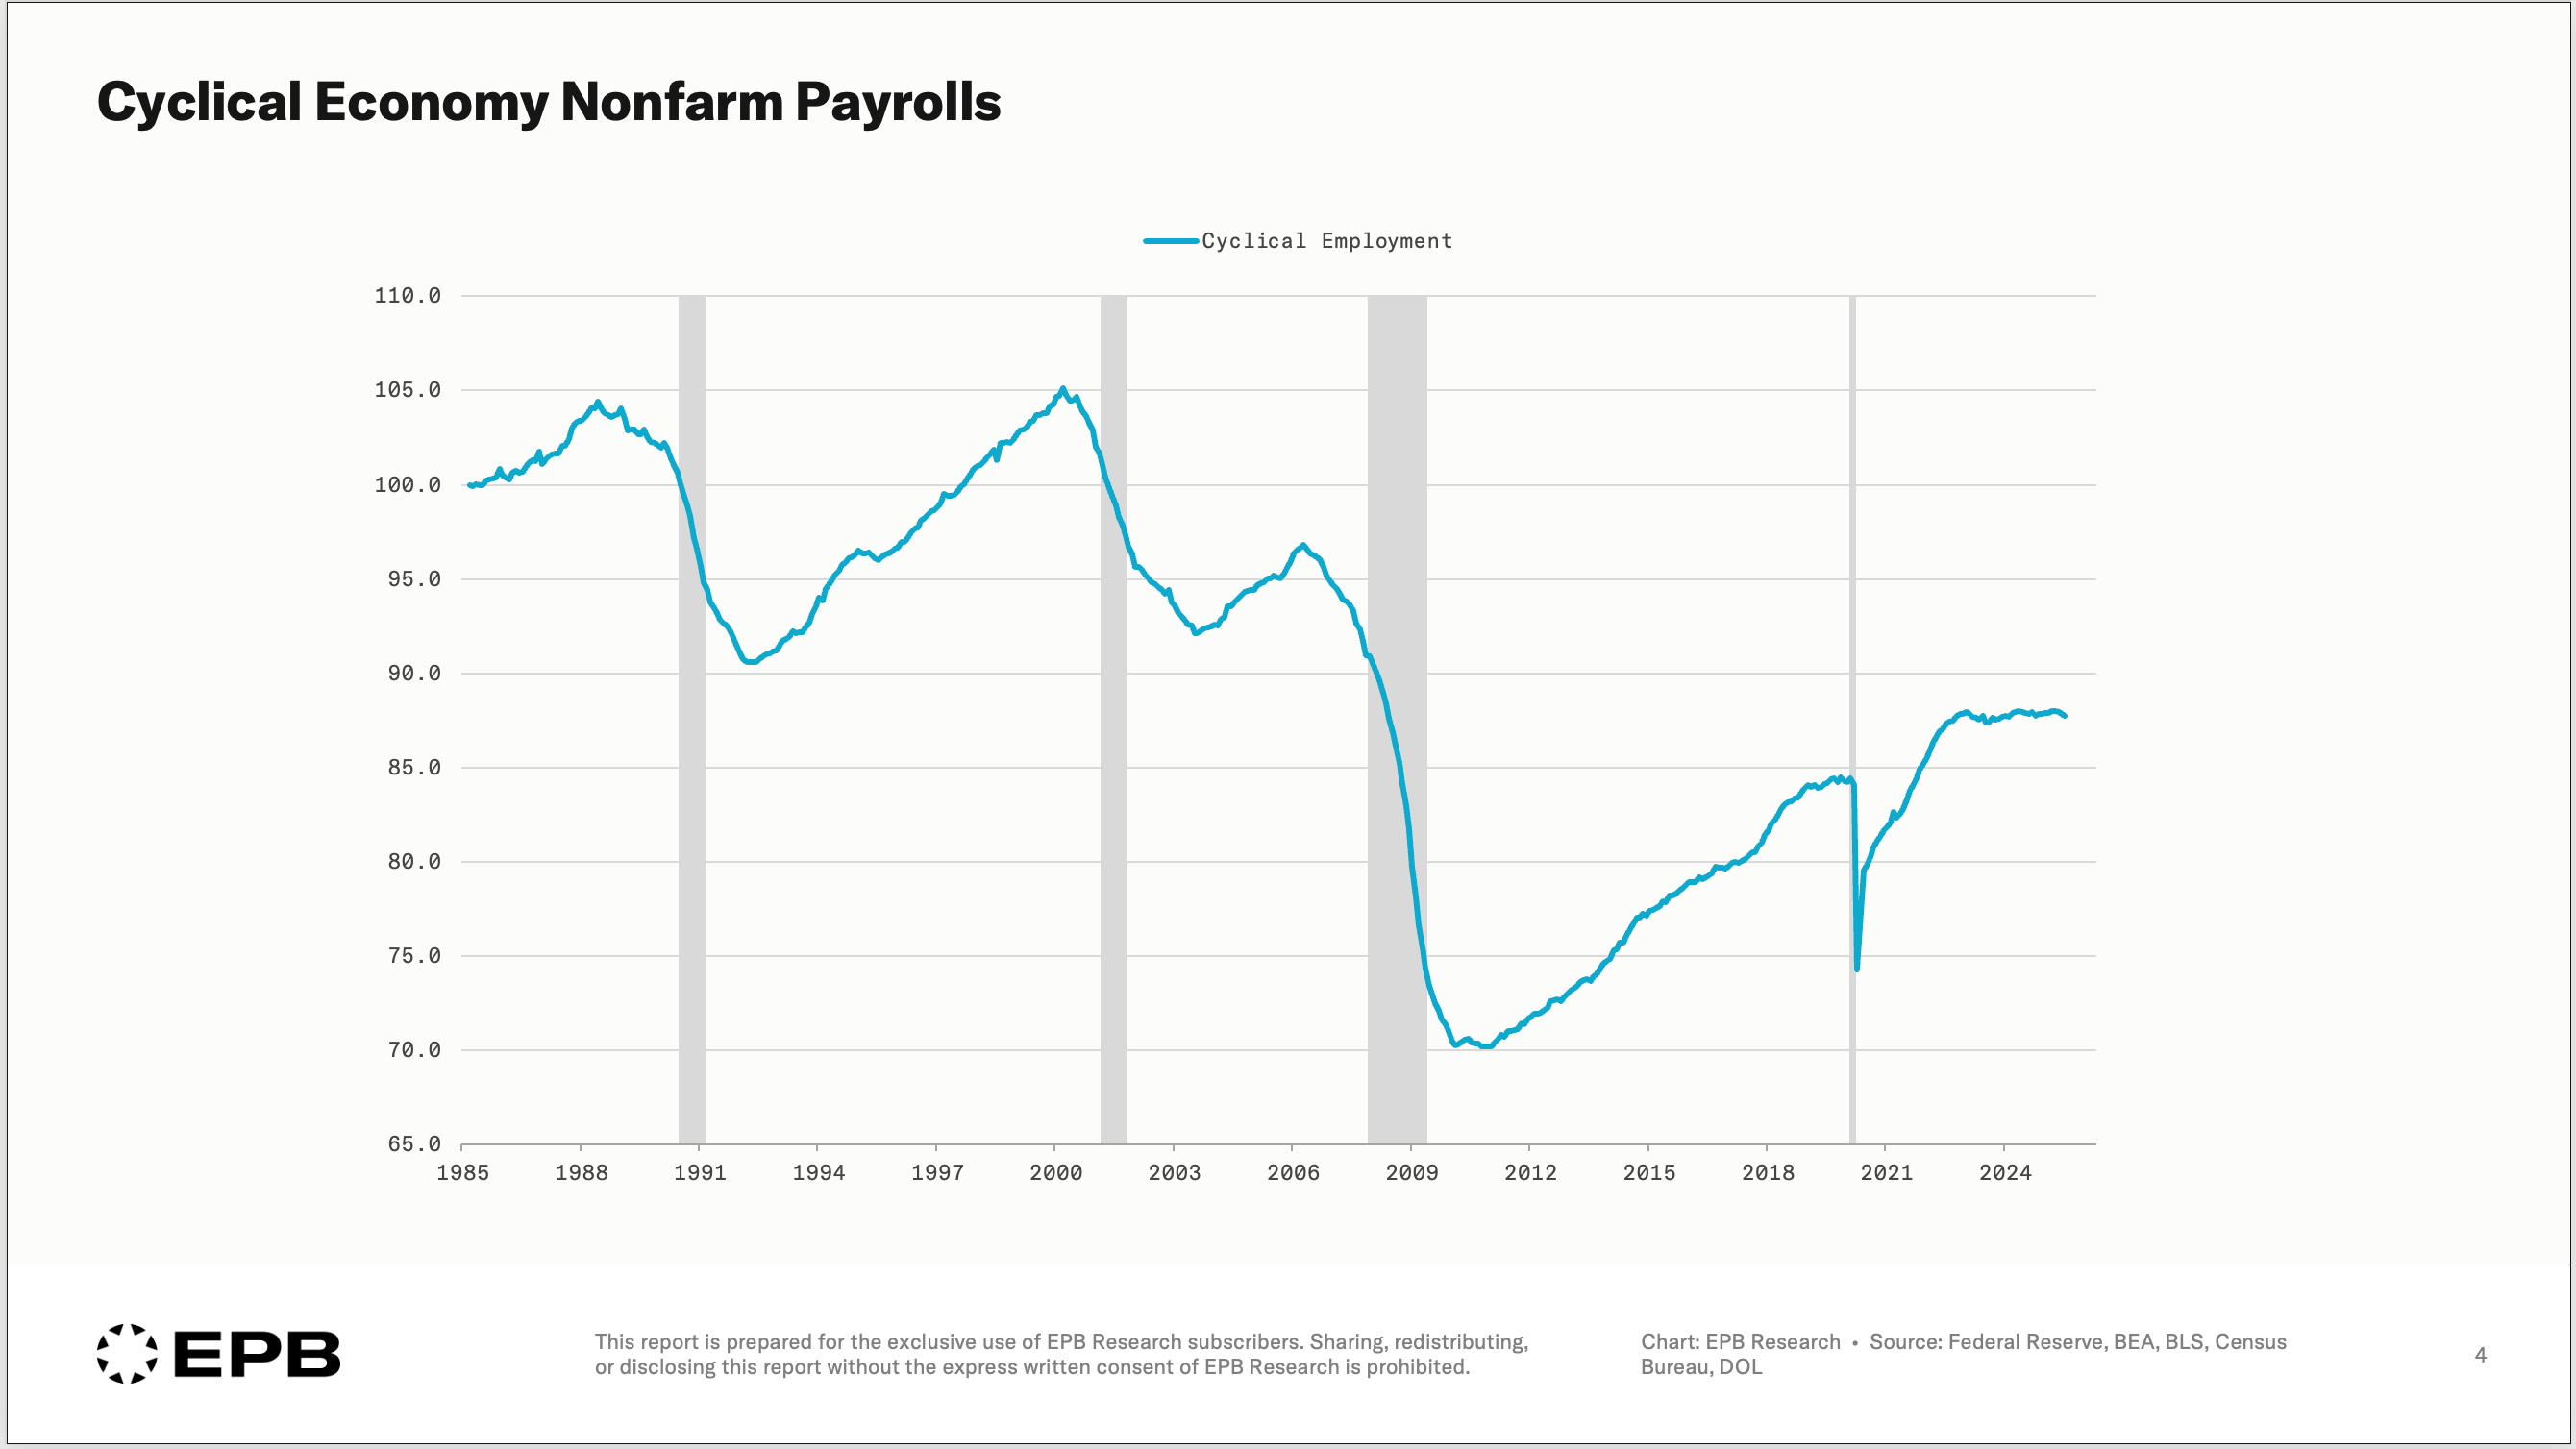
The chart shows how in past recessions, Cyclical Employment would lead downturns and fall sharply. Today, we’ve seen a very unusual dynamic that lines up with the profit margin story. Cyclical Employment has gone completely flat for almost three years.
This represents businesses having a complete freeze on hiring and throttling labor intensity, but not moving to the deep layoffs that drive the recessionary process.
It also explains some of the more complicated economic dynamics in the post-pandemic world, where the economy has been slowing for multiple years, and it has been very harsh on key cyclical industries like residential construction, manufacturing, and transportation. Still, the broader economy has been able to march along without the downstream pressure created by layoffs in the Cyclical Economy.
Cracks Are Forming & What To Watch For
While payrolls have been moving sideways for three years, we can objectively see businesses taking the early steps or the “cracks” forming in the labor market by looking at labor intensity metrics.
This index compiles several measures of labor intensity, including full-time employment, the ratio of part-time employment by reason for part-time employment, and the short-term layoff rate.
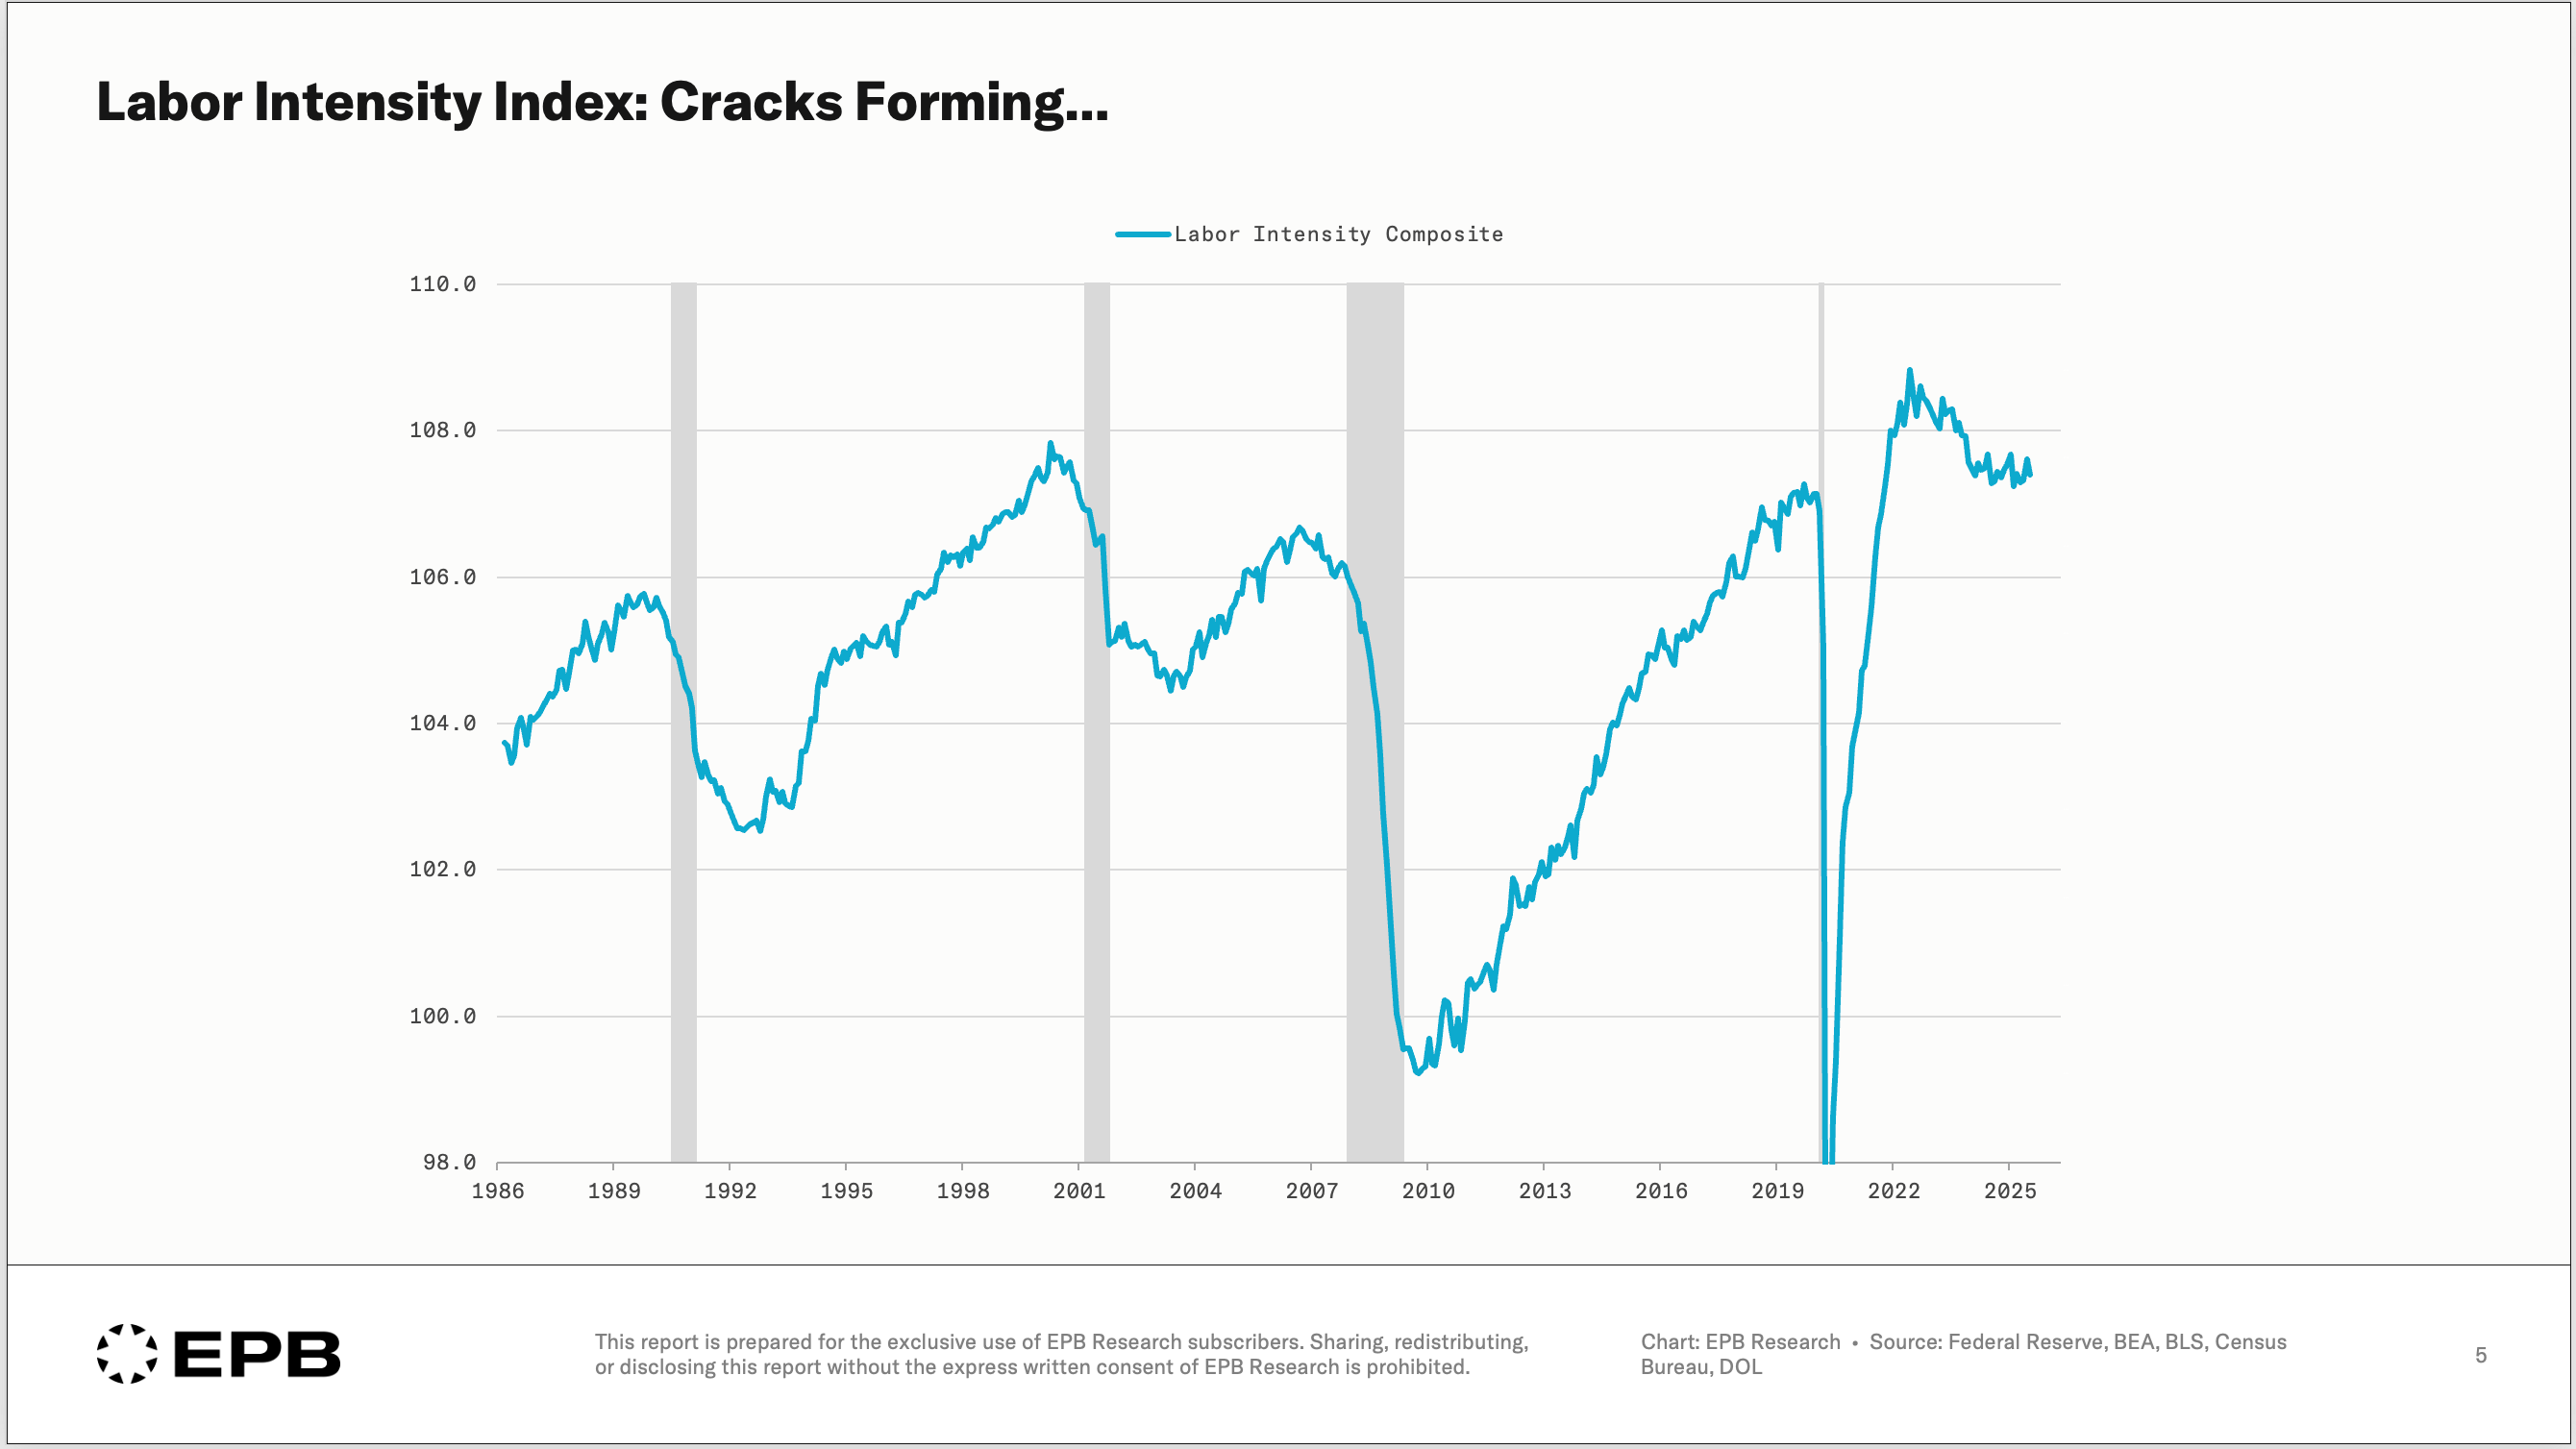
Labor intensity has been dropping since 2022, when margins peaked and started to compress.
This is somewhat surprising because, despite margins peaking at levels that were double the pre-pandemic average for cyclical industries, businesses wasted no time at all and throttled labor intensity immediately at the first sign of slowing demand.
This resulted in a profit margin compression of approximately 600bps over three years for residential construction, providing them with more than three years of cushion to absorb slowing economic conditions while maintaining a higher level of profitability than before the lockdowns.
Cyclical industries like residential construction and manufacturing always move first in terms of demand, profit margins, and job losses. The margin compression in residential is already 600bps and is not slowing down despite the hiring freezes and throttling of labor intensity.
Tariffs hit the goods economy particularly hard, so margin compression may accelerate in the second half of the year, which could tip the scales from hiring freezes and reducing hours worked to layoffs, something we just started to see in the last few jobs reports for residential workers.
While this post did not have the time to dive into all the reasons why margins have been so high and sticky after the 2008 crisis, it offers a clear view into why the layoff cycle has been slower than usual and also why key cyclical sectors could be running out of breathing room in the coming quarters.
If you want to follow this entire sequence as it unfolds — with more detailed updates, animated video presentations, and forward-looking business cycle comments— you can subscribe to the EPB Business Cycle Research Package below.
At EPB Research, we closely monitor the business cycle sequence using our Four Economy Framework and provide structured updates to profit margins, employment trends, and the resulting asset market implications.
Great work as always. I guess my question is when was the last time that we saw a 40% increase in the money supply over 26 months, an additional 190 billion in liquidity from the BTFP, funding the debt with bills and running this much of a deficit during an upturn?
Perhaps I am myopic and setting aside the political motivations, for me the elephant in the room remains liquidity.
And I think that's done.
We'll see.
Great work!