

Where The Labor Market Stands Today
Analyzing the health of the labor market and the biggest risks for 2026.

The US labor market has evolved in an unusual way over the past several years. A “no hire, no fire” dynamic has prevailed for the better part of two years, leading to a slow rise in the unemployment rate without the recessionary sting of mass layoffs.
In this post, we’ll review the current state of the labor market using our sequential framework and highlight the key labor-market variables to watch in the quarters ahead.
The Headline
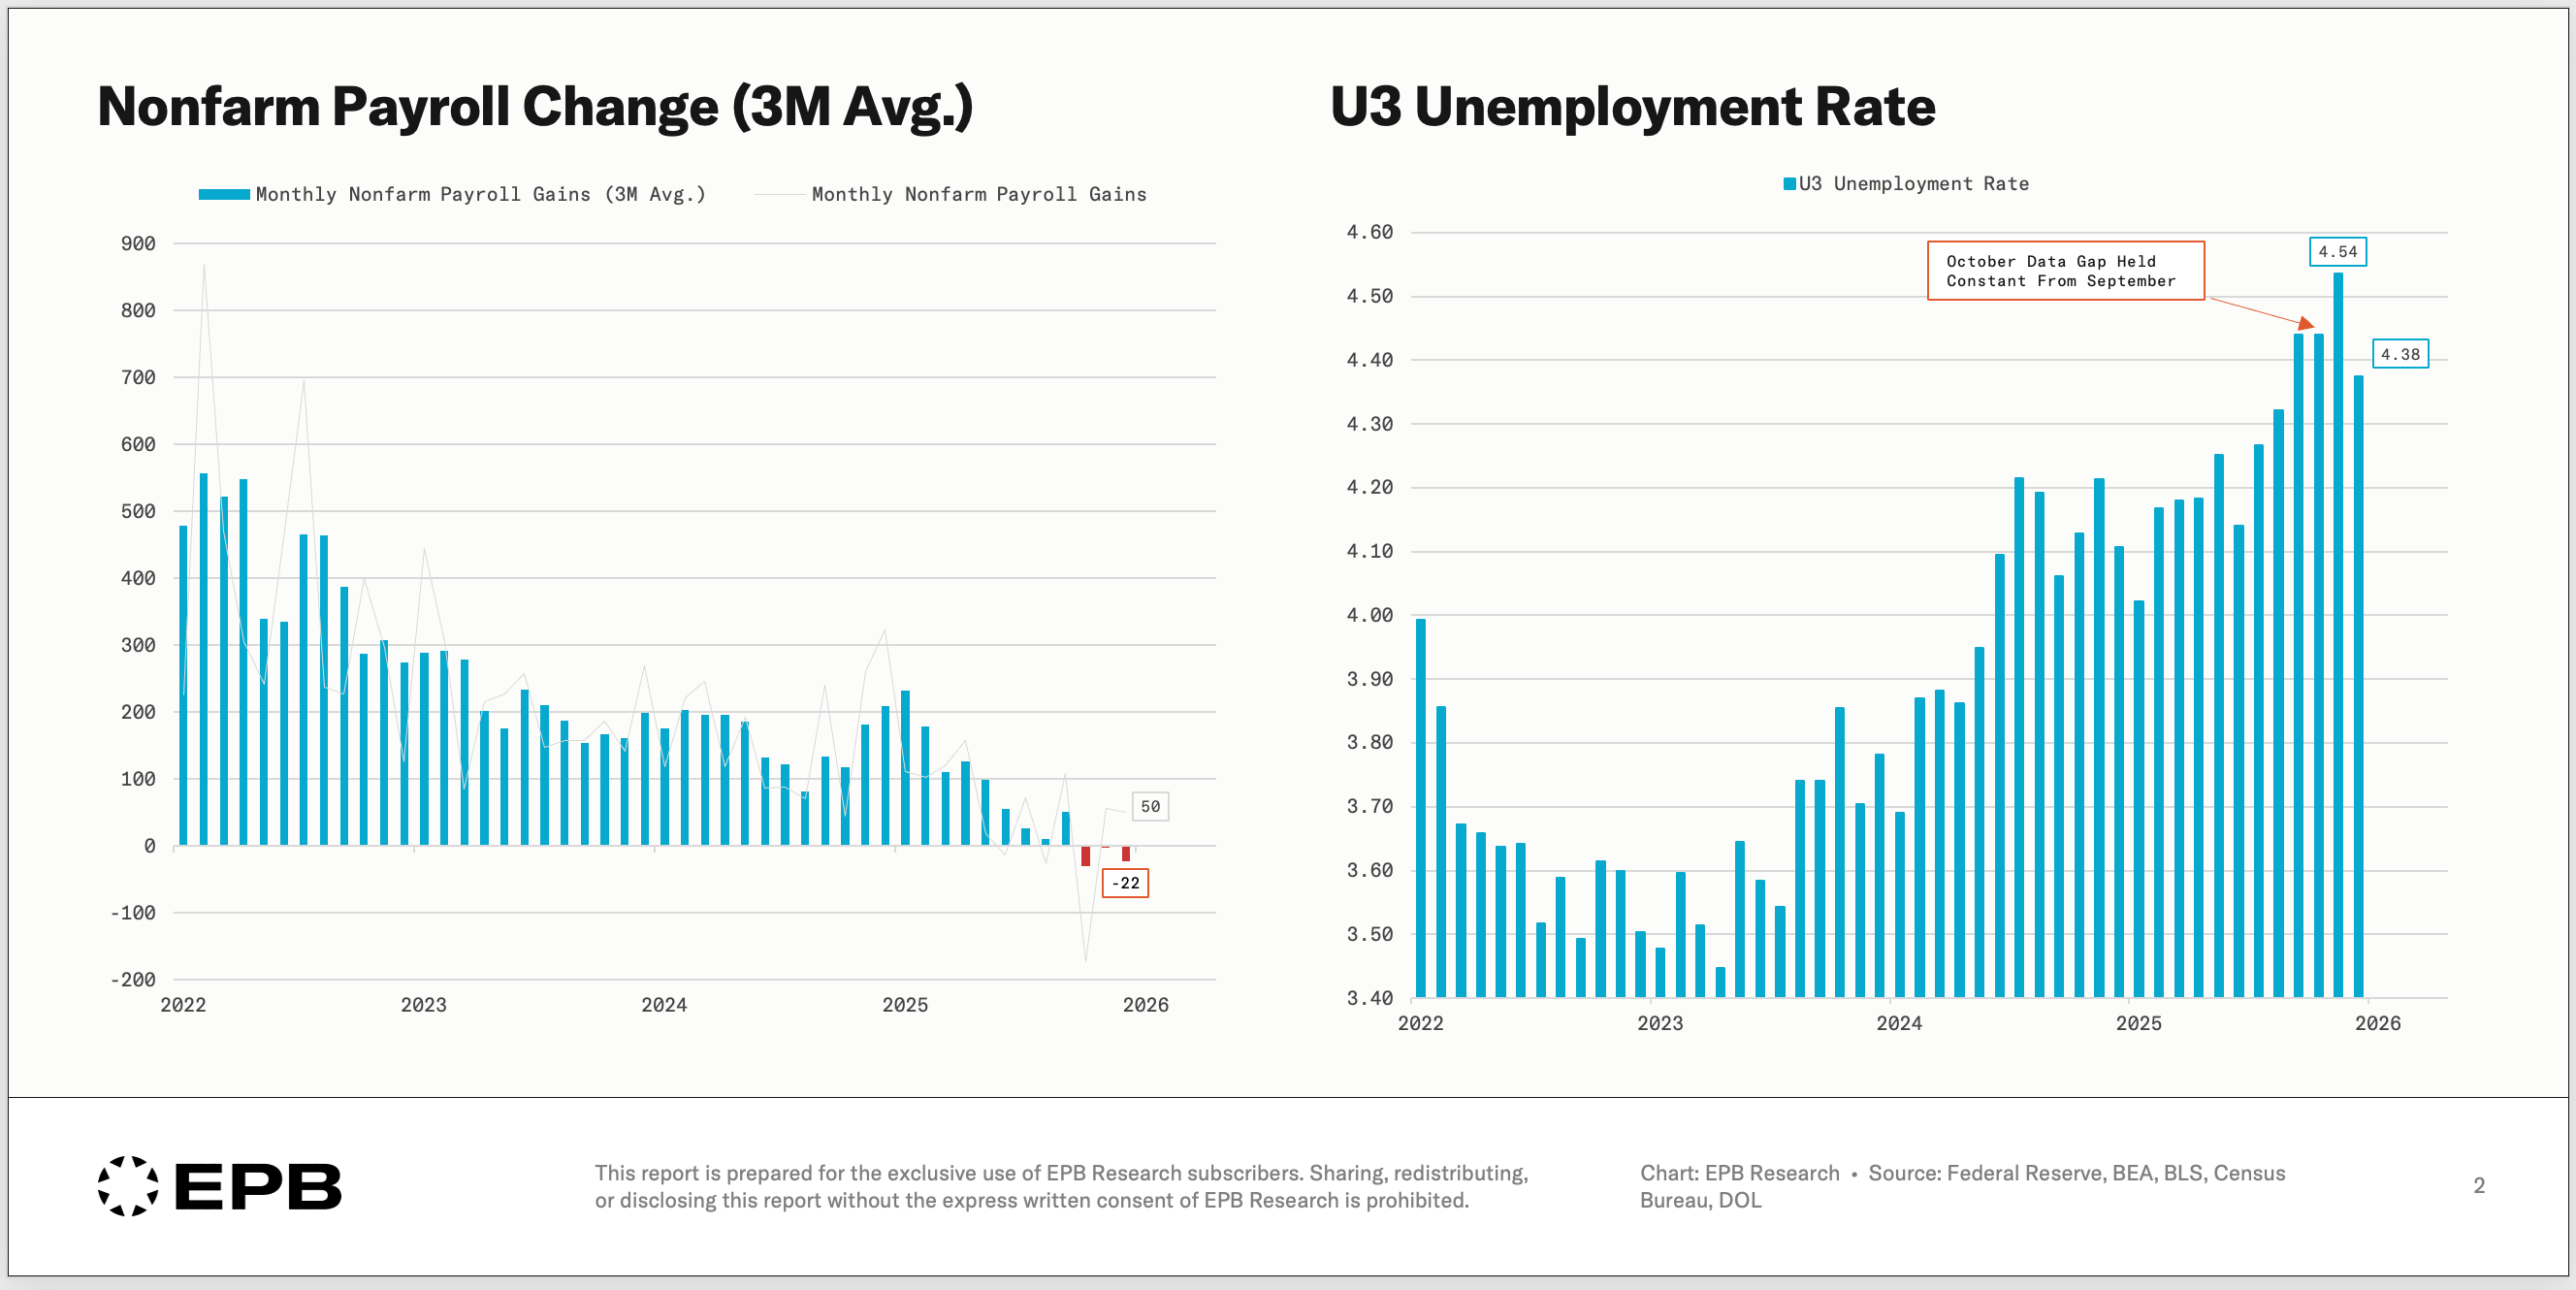
The December employment report showed the economy added 50,000 jobs, with the unemployment rate moving down to 4.4%.
The household survey ratios (where the unemployment rate comes from) are the gold standard labor market metrics because they come with minimal revisions.
At the end of each year, the BLS updates the seasonal adjustment factors, which results in small changes to the unemployment rate, generally 0.1% in either direction. The revisions for November shaved the unemployment rate down from 4.6% to 4.5% and then the December report showed a drop from 4.5% to 4.4%, making the month-over-month drop seem like it was from 4.6% to 4.4%.
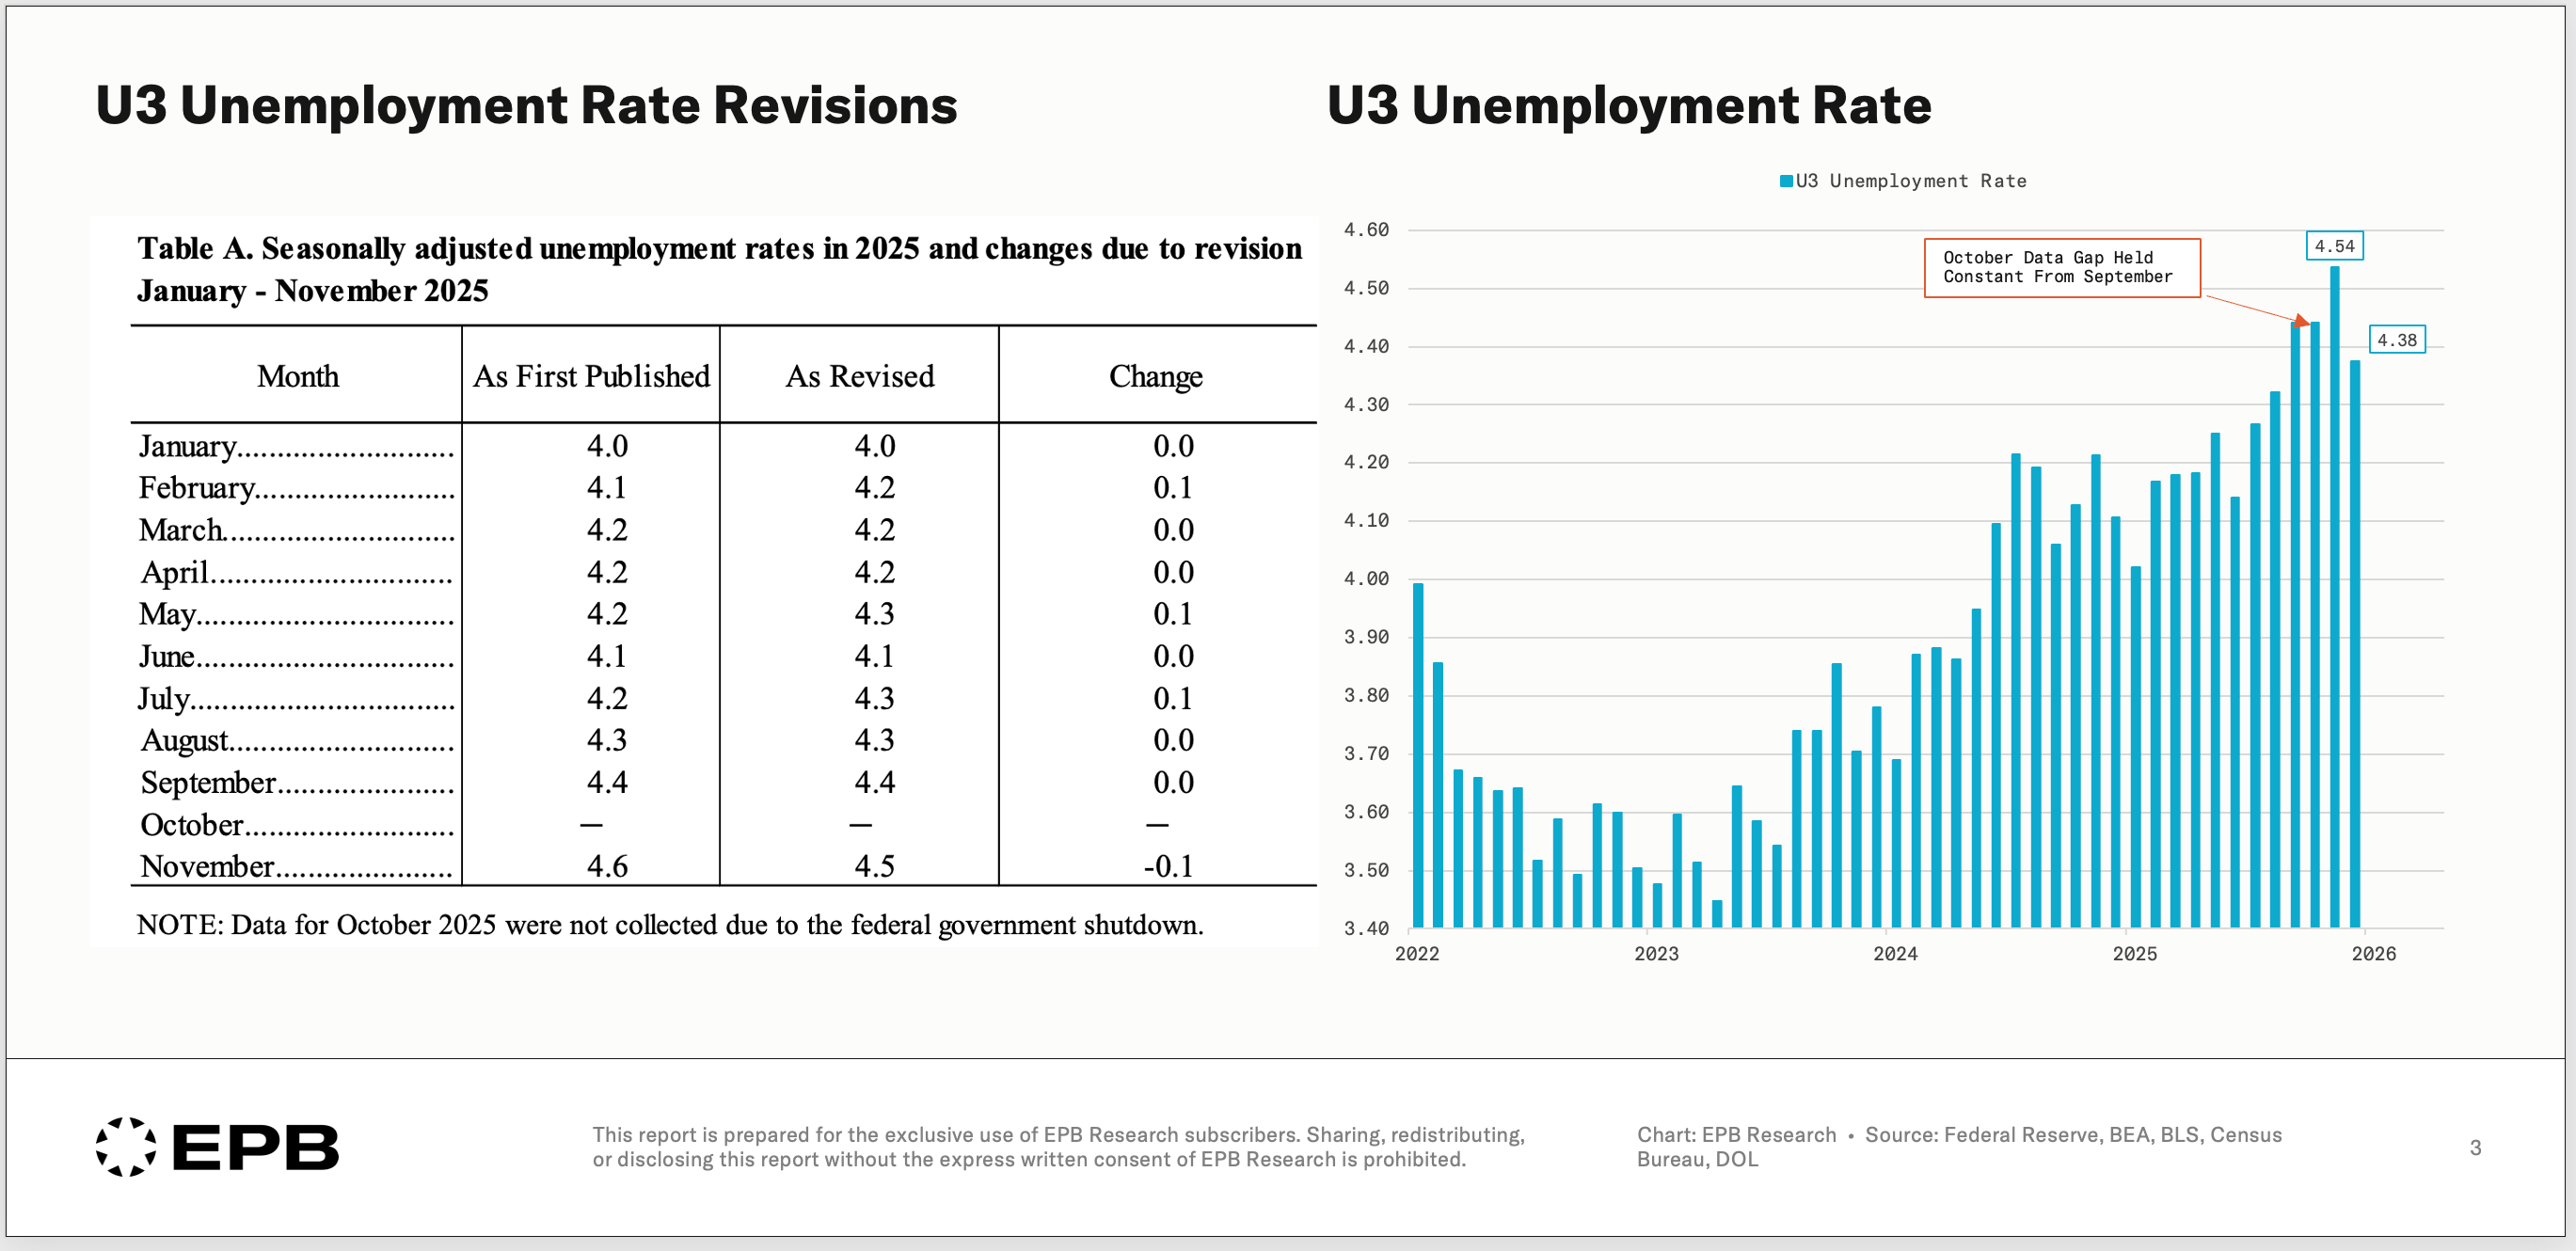
In any case, the unemployment rate fell in December, which is a positive sign for the labor market, and it fell below the September level, so it was a sizable improvement.
(Under)Employment
The two main unemployment rates are the U3 and U6. The U6 unemployment rate is a broader measure, which includes people who are working part-time but would prefer to work full-time, so it’s a measure of unemployment and underemployment.
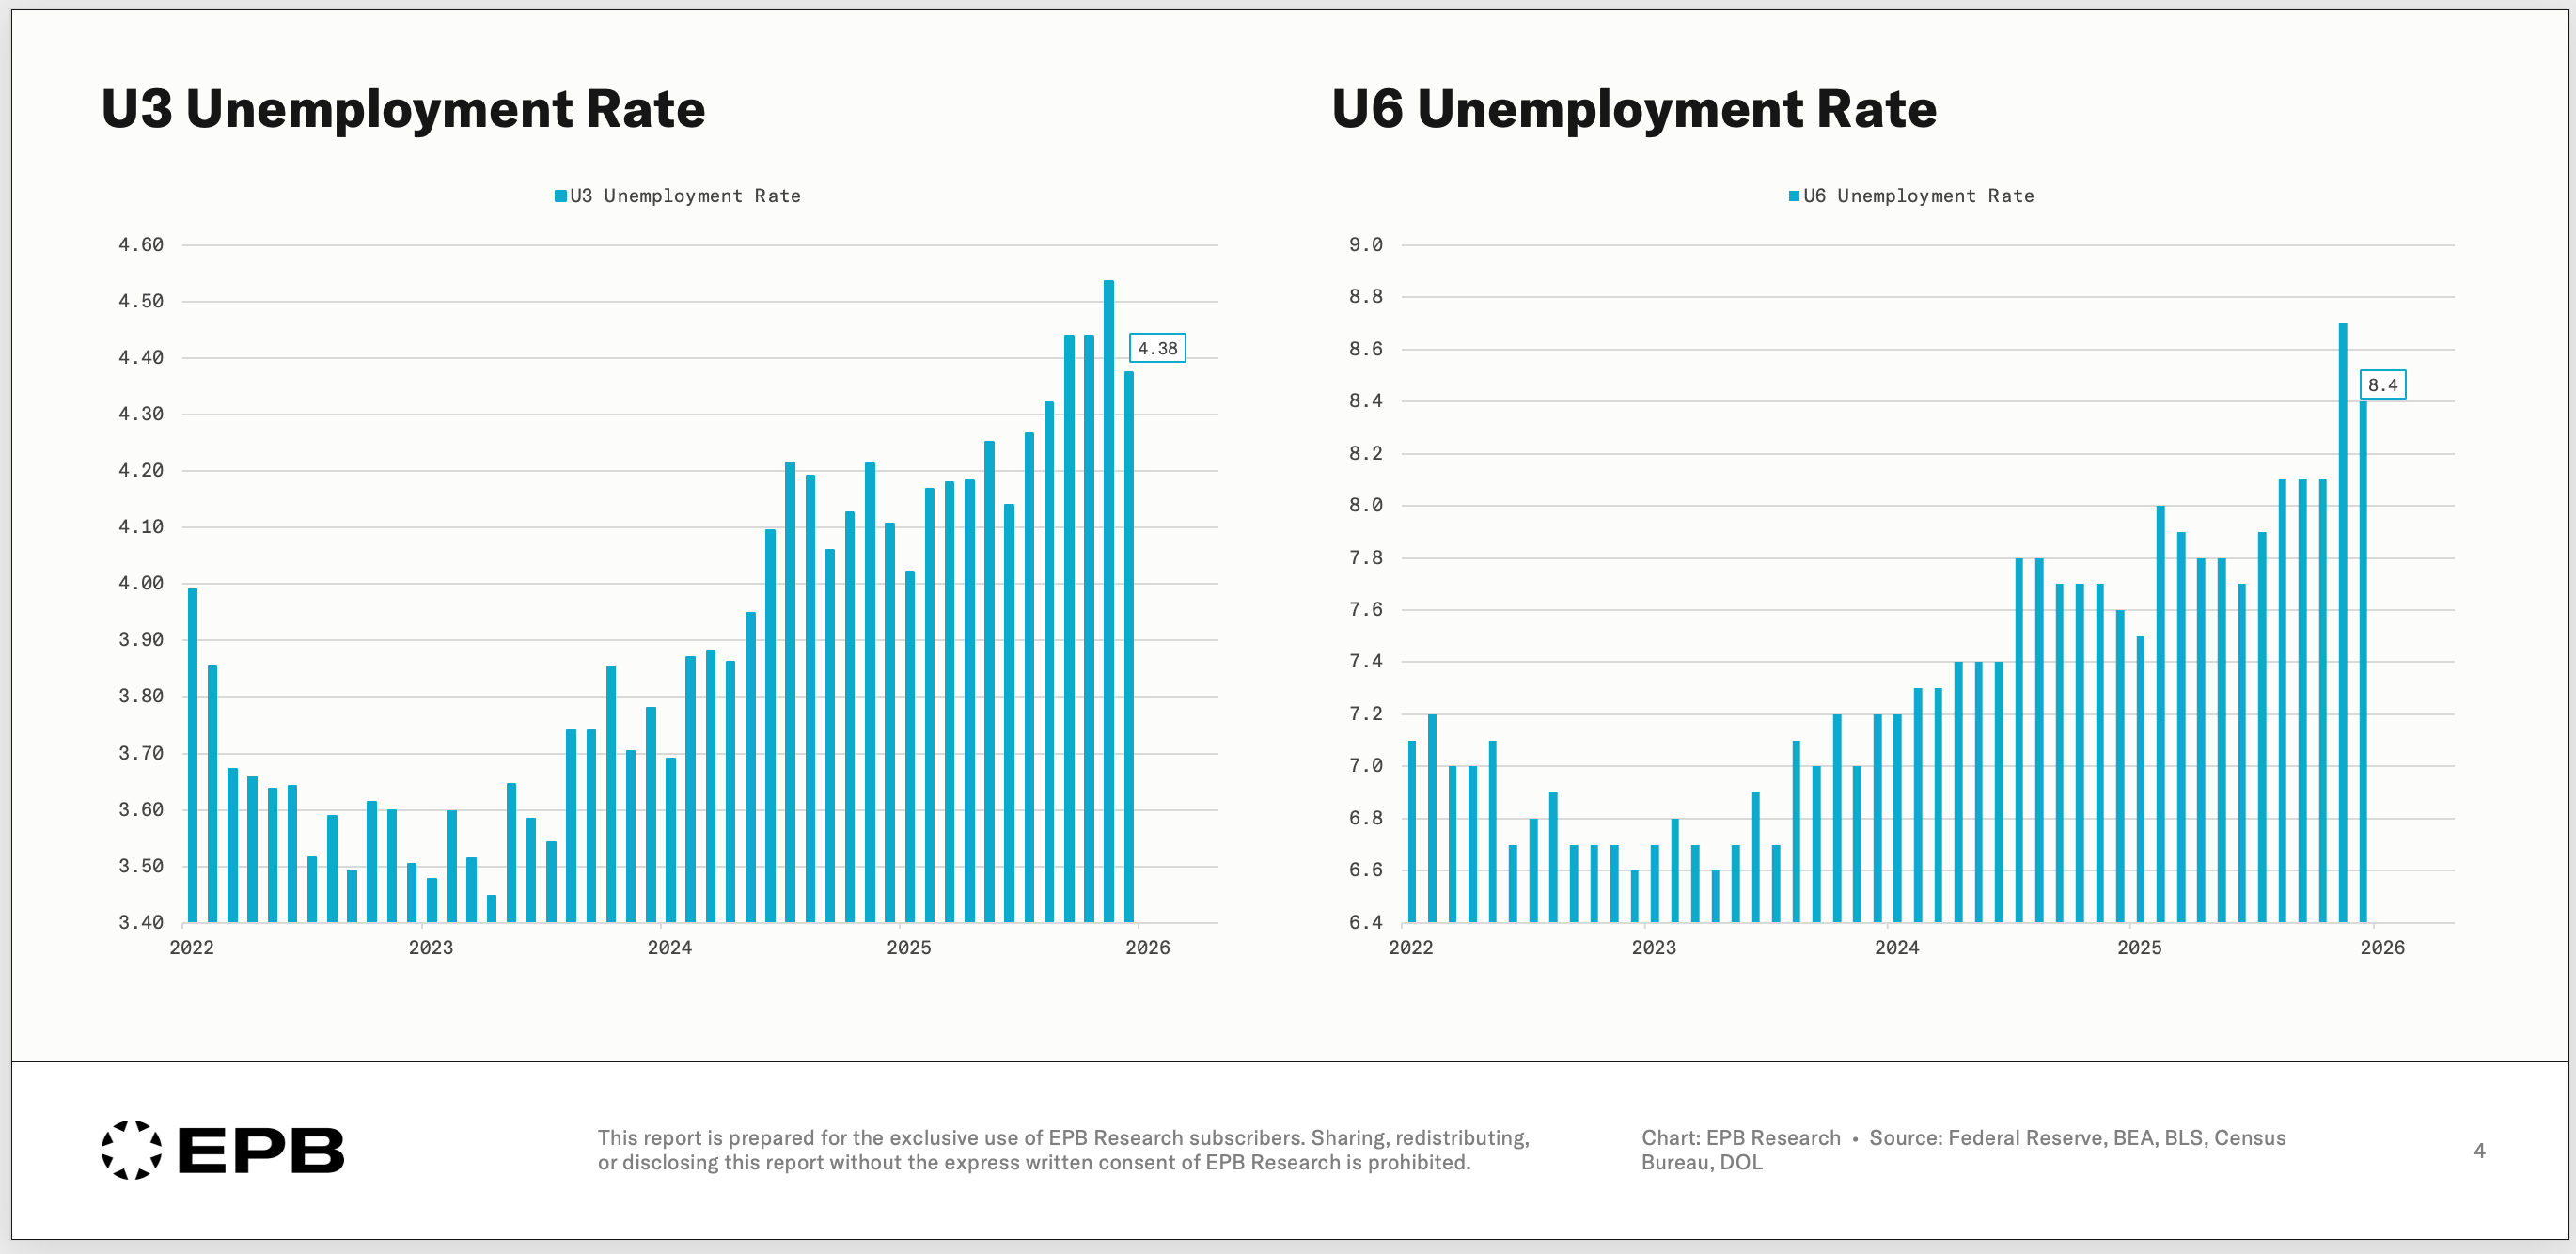
While the U3 rate fell below the September level, the broader U6 rate declined from the November spike but remains 0.3% higher than in August, September, and October.
So the U6 unemployment rate only partially reversed the spike that was expected to be an anomalous reading, suggesting that there was a legitimate rise in the rate of underemployment.
These charts show full-time and part-time employment ratios, and again, we reversed some of the abnormal spike we saw in November, but not the full change.

Full-time employment as a share of the labor force bounced back to 78.8% which was a positive development in December.
The part-time for economic reasons ratio, a driver of the U6 unemployment rate, hardly moved lower and remains very close to a cycle high, so there is a definitive trend in the labor market of underemployment, which is a negative, juxtaposed with a healthy improvement in the U3 unemployment rate, which is a positive.
Sequential Sector Payroll Breakdown
Our sequential business cycle process involves peeling back the layers or sectors of payrolls and narrowing in on the cyclical areas that drive all the changes in the labor market and broader economy.
Total nonfarm payrolls can be split between private and government. Government payrolls have been declining at the Federal level, which is putting downward pressure on the overall numbers.

Private payrolls can be split between construction & manufacturing (cyclical payrolls) and all private jobs excluding construction & manufacturing (non-cyclical payrolls). Cyclical payrolls appeared to rise in November, marking a transition to job gains, but those gains were revised away.

The non-cyclical payrolls, as we’d expect, continue to march higher.
Through our sequential process, we know that virtually all recessionary job losses come from cyclical payrolls.
There are job losses in some non-cyclical areas, but they are never the driver of self-reinforcing downturns.
Splitting cyclical payrolls into construction and manufacturing shows that all the declines are coming from manufacturing. Total construction payrolls edged slightly lower in December after hitting a cycle high in November.

Manufacturing payrolls are in a relentless decline with an accelerating pace starting in April 2025.
To conclude 2025, the cyclical portion of the labor market remains weak, with most of the downward pressure coming from the manufacturing sector.
The major question for the economy in 2026 is whether the monetary easing we’ve seen so far is enough to arrest the labor market declines in these cyclical sectors before they accumulate to several hundred thousand and cause downstream stress in the less cyclical and larger areas of the economy.
No Hire, No Fire Is Hurting The Youth
The increase in the unemployment rate over the last few years has fallen primarily on the youth, with more than a 3-percentage point increase from early 2023. This fits perfectly with the “no hire, no fire” labor market.
As younger age groups graduate from college, the low hiring is preventing them from finding jobs, directly pushing them into the unemployment bucket. Older age groups generally already have jobs, so the low firing rate is preventing unemployment rates from rising as rapidly in these groups.
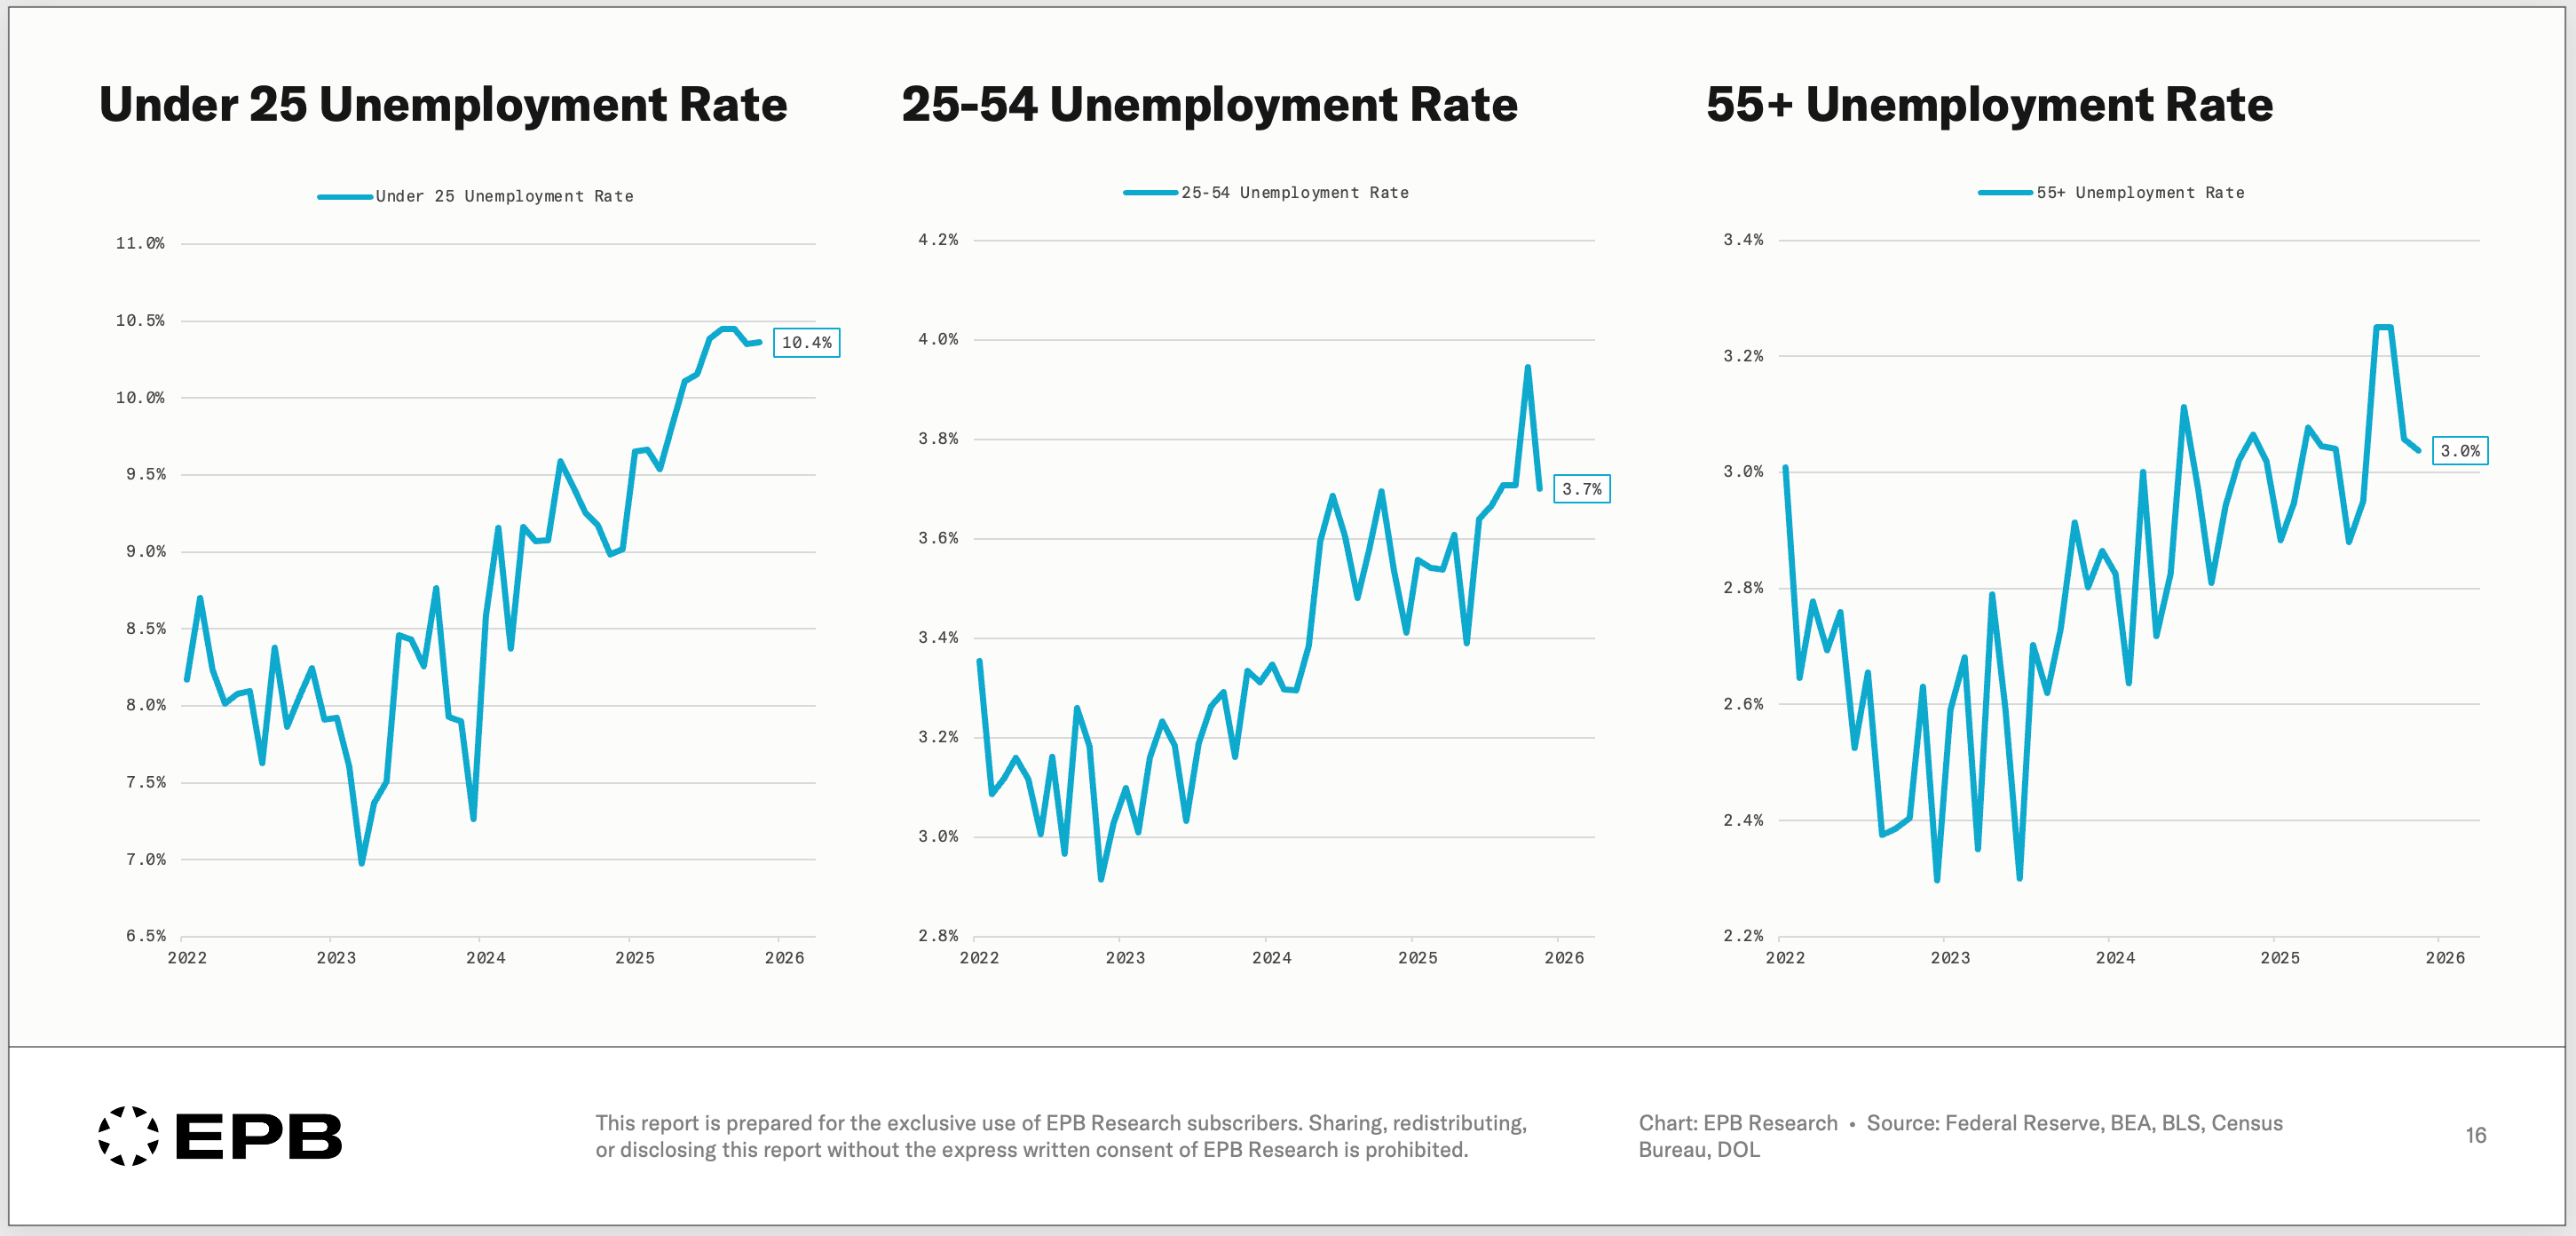
All the reversal in the U3 unemployment rate to close out 2025 came from the 25-54 age group, which is a positive, as this is the most concerning group to see a big rise in unemployment.
Looking Into 2026
Given the low hiring nature of the labor market, there is still plenty of risk that the unemployment rate creeps back above 4.5% and heads towards 4.7% which would require the Fed to adjust their SEP and deliver on more than the one rate cut they have priced in.
The labor market has not soured in a recessionary fashion, as the layoff rate has remained muted.
While layoffs have been muted, low hiring has caused the unemployment rate to rise from roughly 3.5% in early 2023 to nearly 4.5% at the end of 2025.
The biggest risk to the labor market in 2026 is a continued slide in cyclical payrolls, as this would put continued upward pressure on the unemployment rate.
However, if cyclical payrolls stabilize, or simply decline only through attrition rather than outright layoffs, then the labor market is unlikely to create broad recessionary stress in the near term.
Stay Ahead of the Cycle With EPB Research
EPB Research subscribers receive updates on the entire Business Cycle Sequence and granular breakdowns of key themes like employment and inflation, so you’re always in a position to anticipate the next turn, not react to it.
If you found this analysis valuable, please share it with others who might benefit from a more rigorous approach to understanding the Business Cycle.
Construction is being held up by AI datacenter build out. If AI bubble bursts and money dry out we will enter recession fast. If not, we will continue slow bleed throughout 2026 and maybe enter recession 2027. If FED gets new chairman that is Trump puppet that takes down rates without recession, we may get high inflation, and that would take us in to low growth with high inflation.
Unfortunately since the current administration doesn’t know what integrity is how do we know anything is correct in government released numbers
It’s like with Soviet Union
You lie to us and we pretend to believe it
Makes your job very difficult