

The Stock Market Is Not a Leading Indicator. This Is.
The market is better at calling the end of a recession than the beginning. Here's the part of the economy that actually leads the cycle, and how to track it.

Before diving into the post, I wanted to let you know that EPB Research has a free Sunday newsletter.
One email per week with ongoing business cycle education plus live examples of the framework in action. Click the button below to join for free.
Now, let’s talk stock prices and why they are not a leading indicator. At least not a good one…
The stock market is good at telling you when a recession is ending. It’s far worse at telling you when one is about to begin.
That’s a problem because spotting the next downturn early is exactly what most people use it for.
When people want to know where the economy is headed, the first place they look is the stock market.
“The stock market is up, therefore the economy must be doing well.”
The instinct isn’t crazy, or even entirely wrong. The market tries to be forward-looking; it’s even built into official gauges like the Conference Board’s Leading Economic Index, and on average, stocks do peak a couple of months before a recession begins.
But the reality shows that stocks call bottoms far better than tops, so, as an early warning of a coming recession, the signal is one-sided and usually arrives too late to act on.
The economy moves in a predictable sequence, and once you see where stock prices actually fall in that sequence, it all starts to make sense.
At EPB Research, we call it the Four Economy Framework.
Stock prices lead the Aggregate Economy by a couple of months, but they lag the Cyclical Economy, the part that drives the cycle.
In this post, I’ll walk you through that sequence and show you exactly where stocks sit in it, so you know what to track instead, and what it really tells you about where stocks may head next.
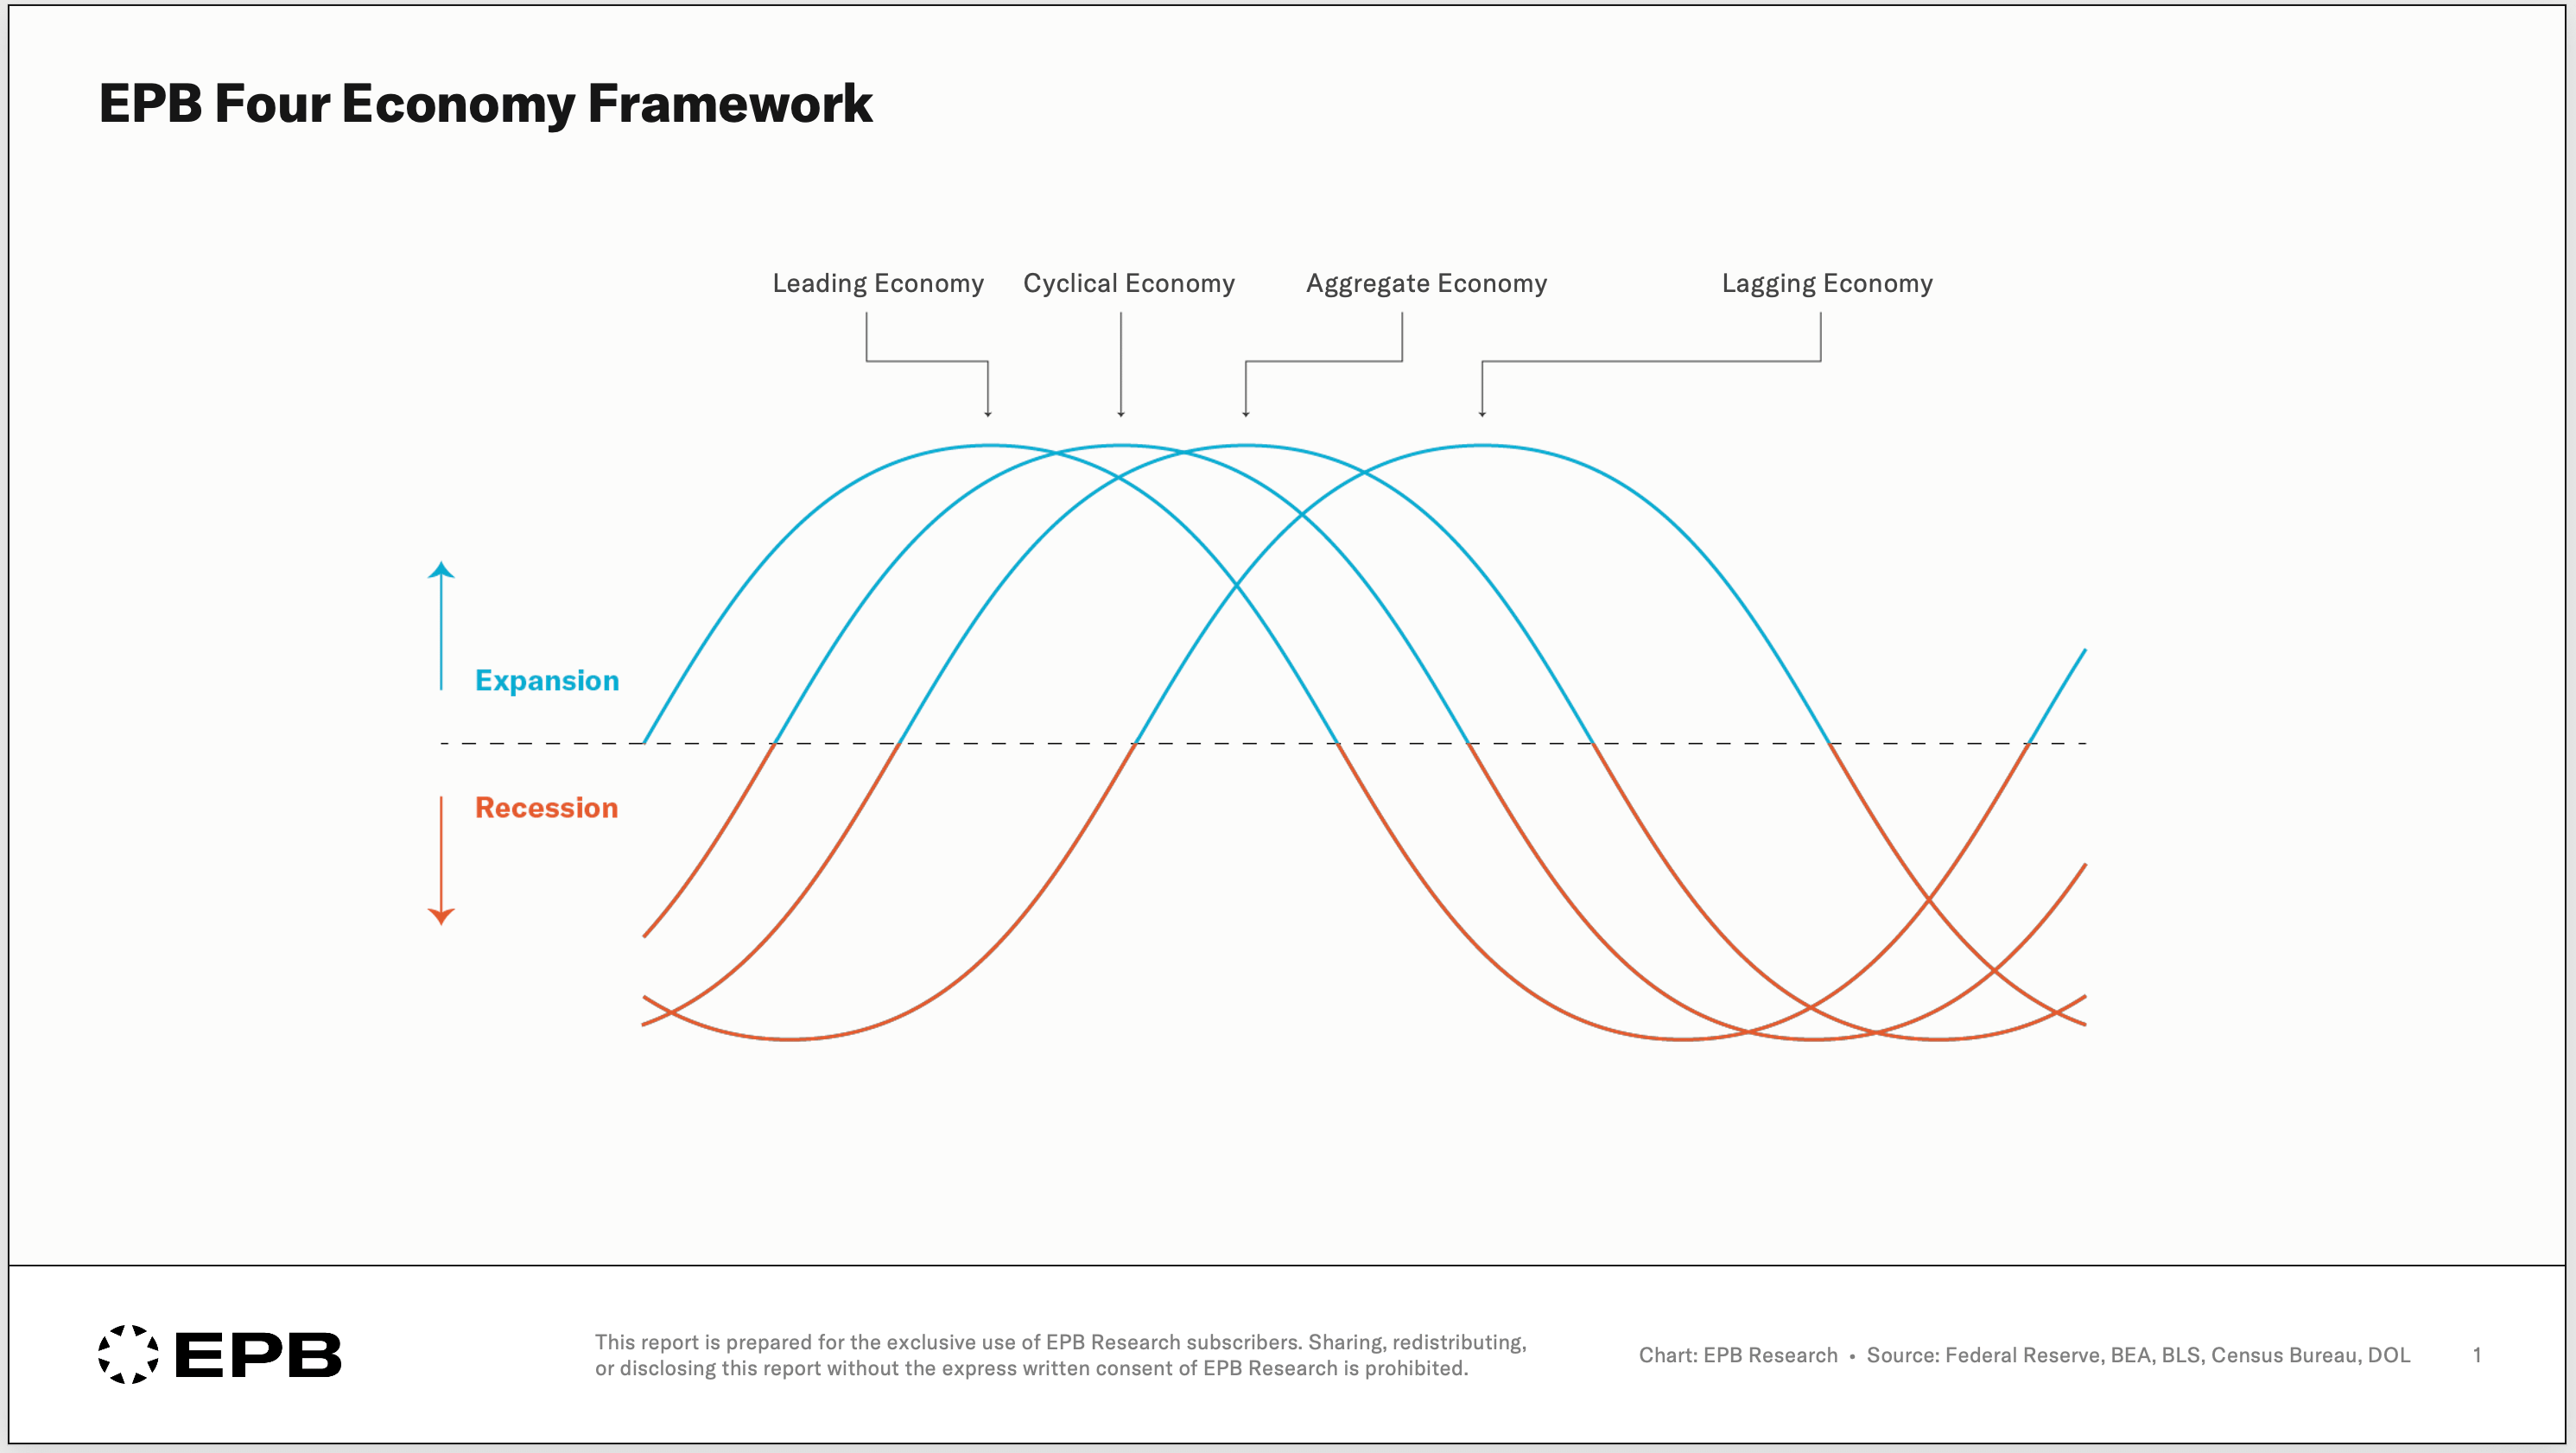
In the Four Economy Framework, we break the business cycle into four distinct buckets: Leading, Cyclical, Aggregate, and Lagging.
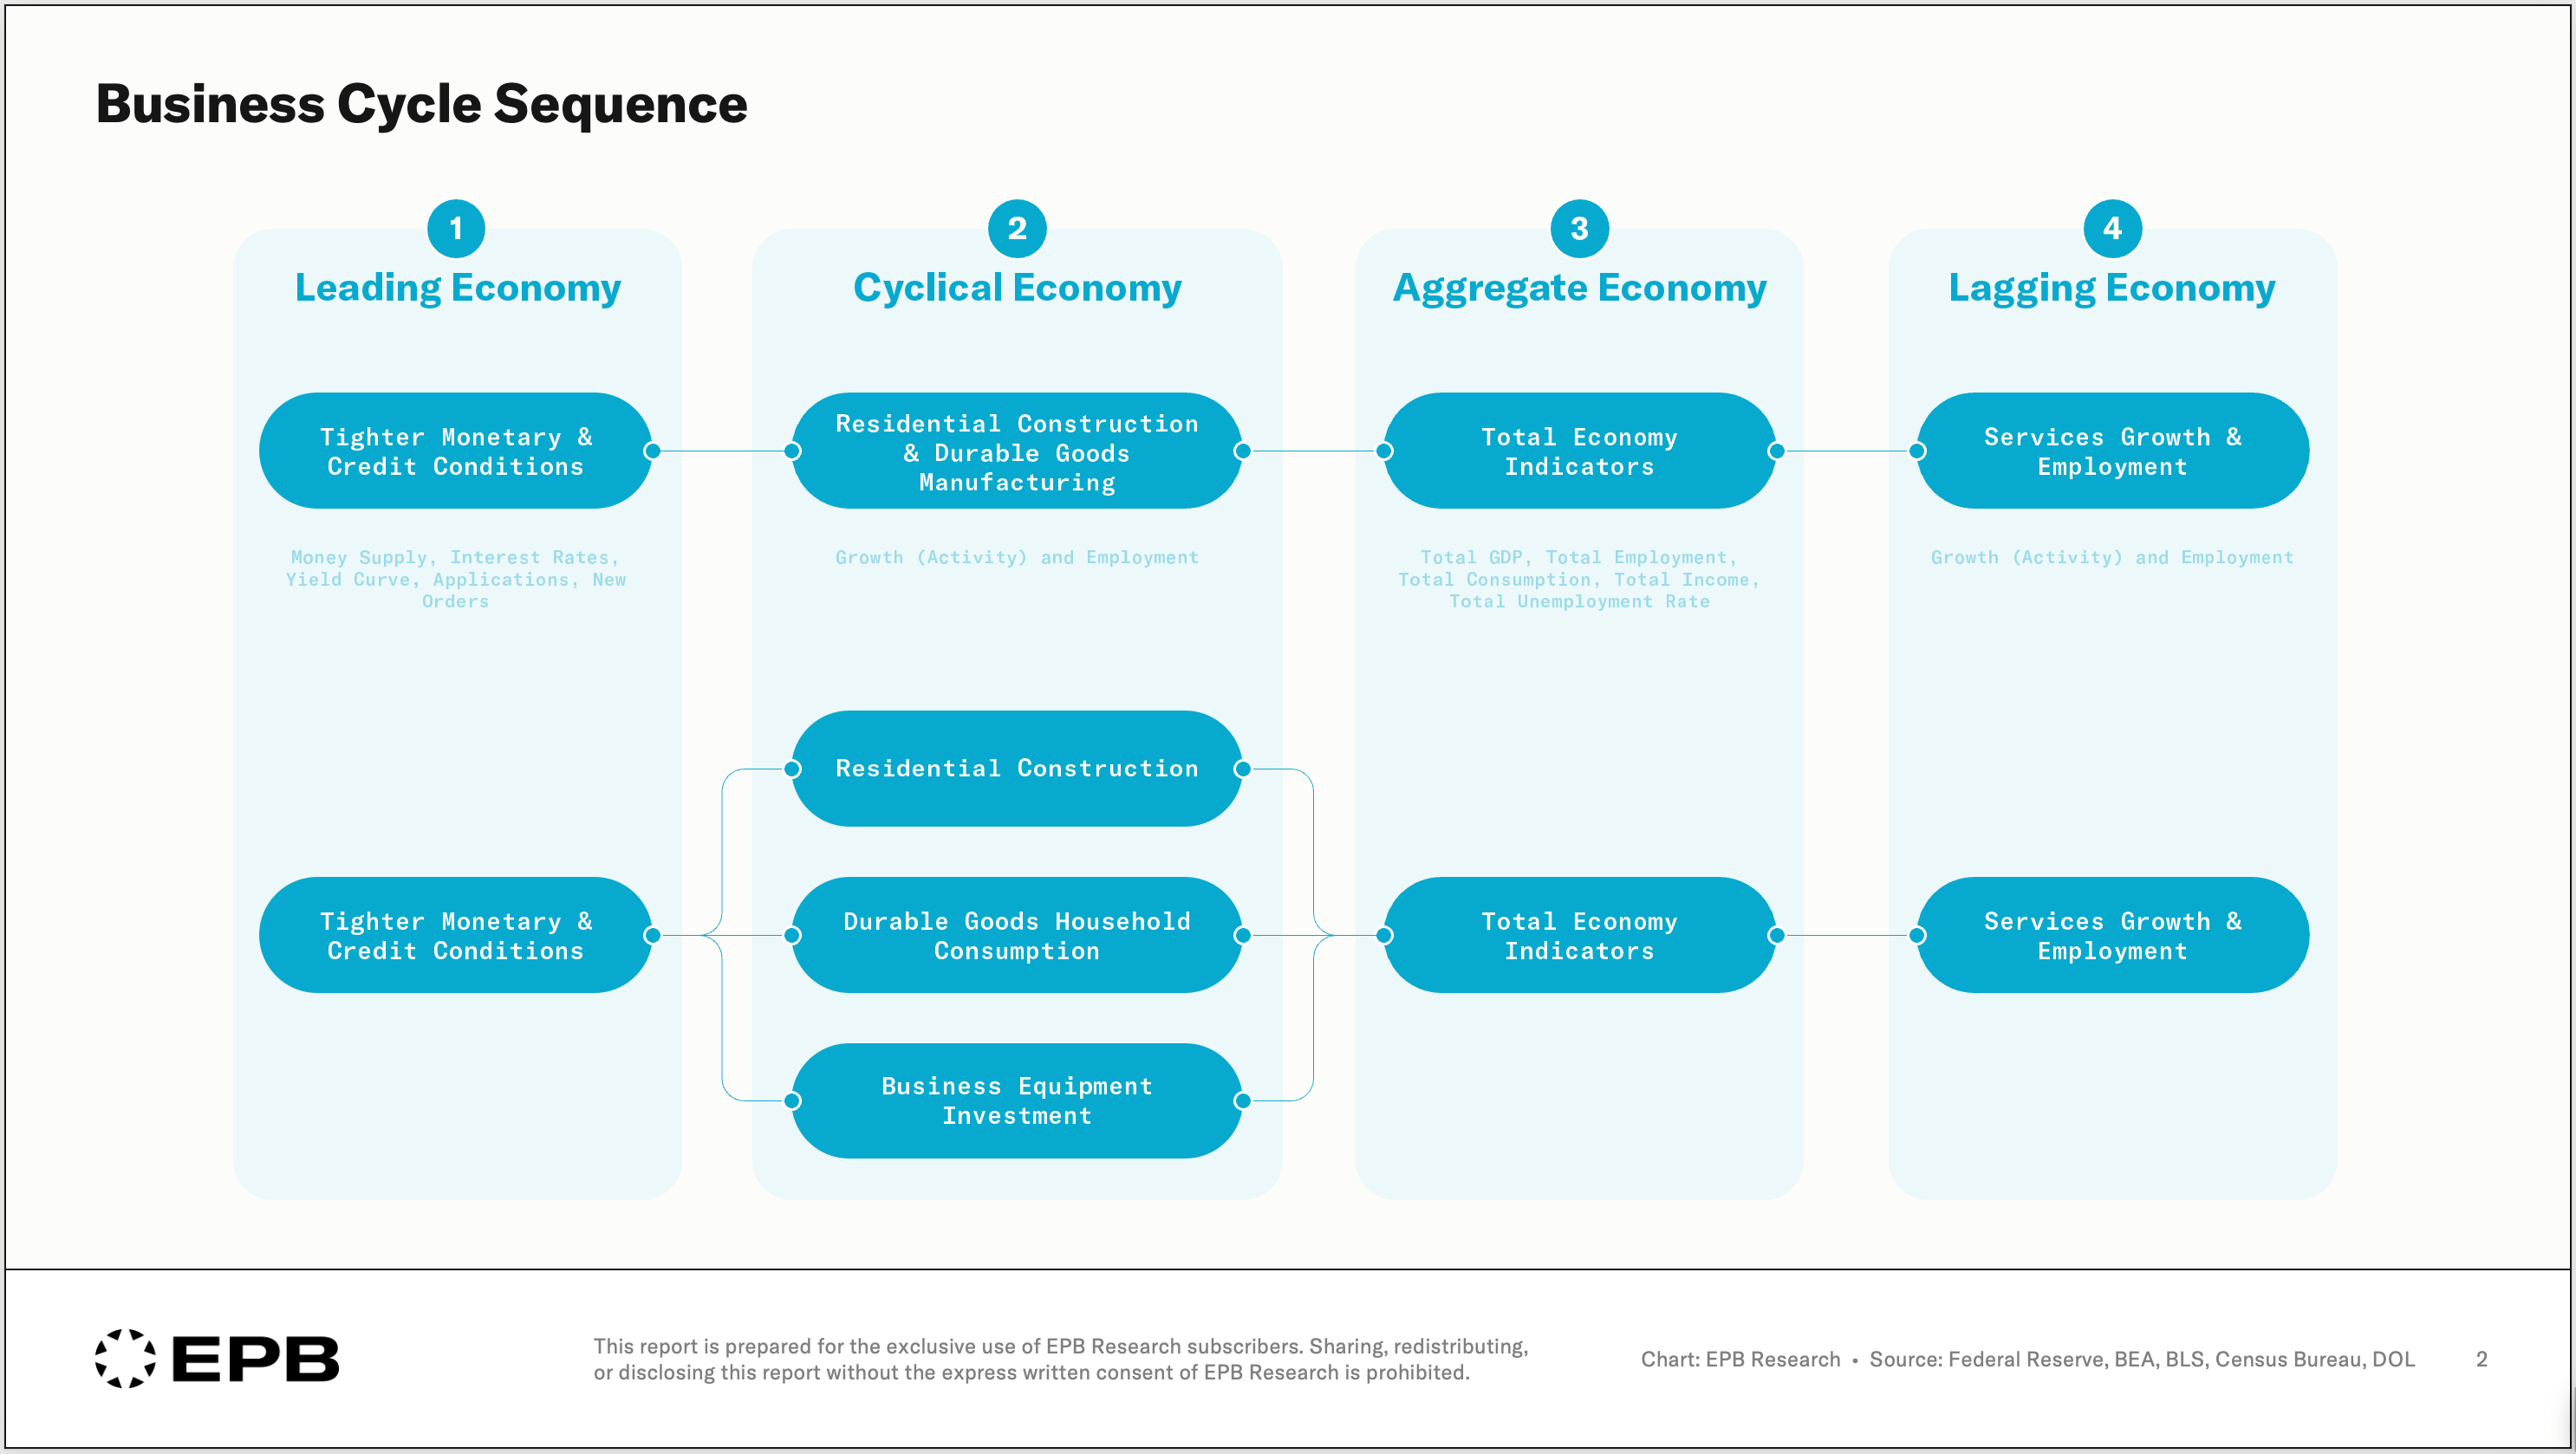
The first bucket measures the availability of money and credit. When following the process at cycle peaks, tighter money and credit lead to declines in growth and employment of the most interest-rate-sensitive industries, which are construction and manufacturing.
The decline in activity and the unemployment caused in construction and manufacturing create the stress and the downturn in spending that only then becomes visible in the broad or Aggregate Economy statistics.
Lastly, components of the Lagging Economy, primarily services consumption and employment, feel the effects, but importantly, it’s a downstream effect of what happened in the Cyclical Economy, not a random event.
The most critical point is that some parts of the economy always move before the average, and some always move after it. The whole game is knowing which part you’re looking at.
Almost all economic analysis starts with the Aggregate Economy. These are the broad economic measures like GDP, unemployment rate, personal income, and personal consumption.
At EPB, we have an Aggregate Economy Index that combines these indicators into one measure, and you can see the peaks and troughs line up with the start and end dates of recessions.
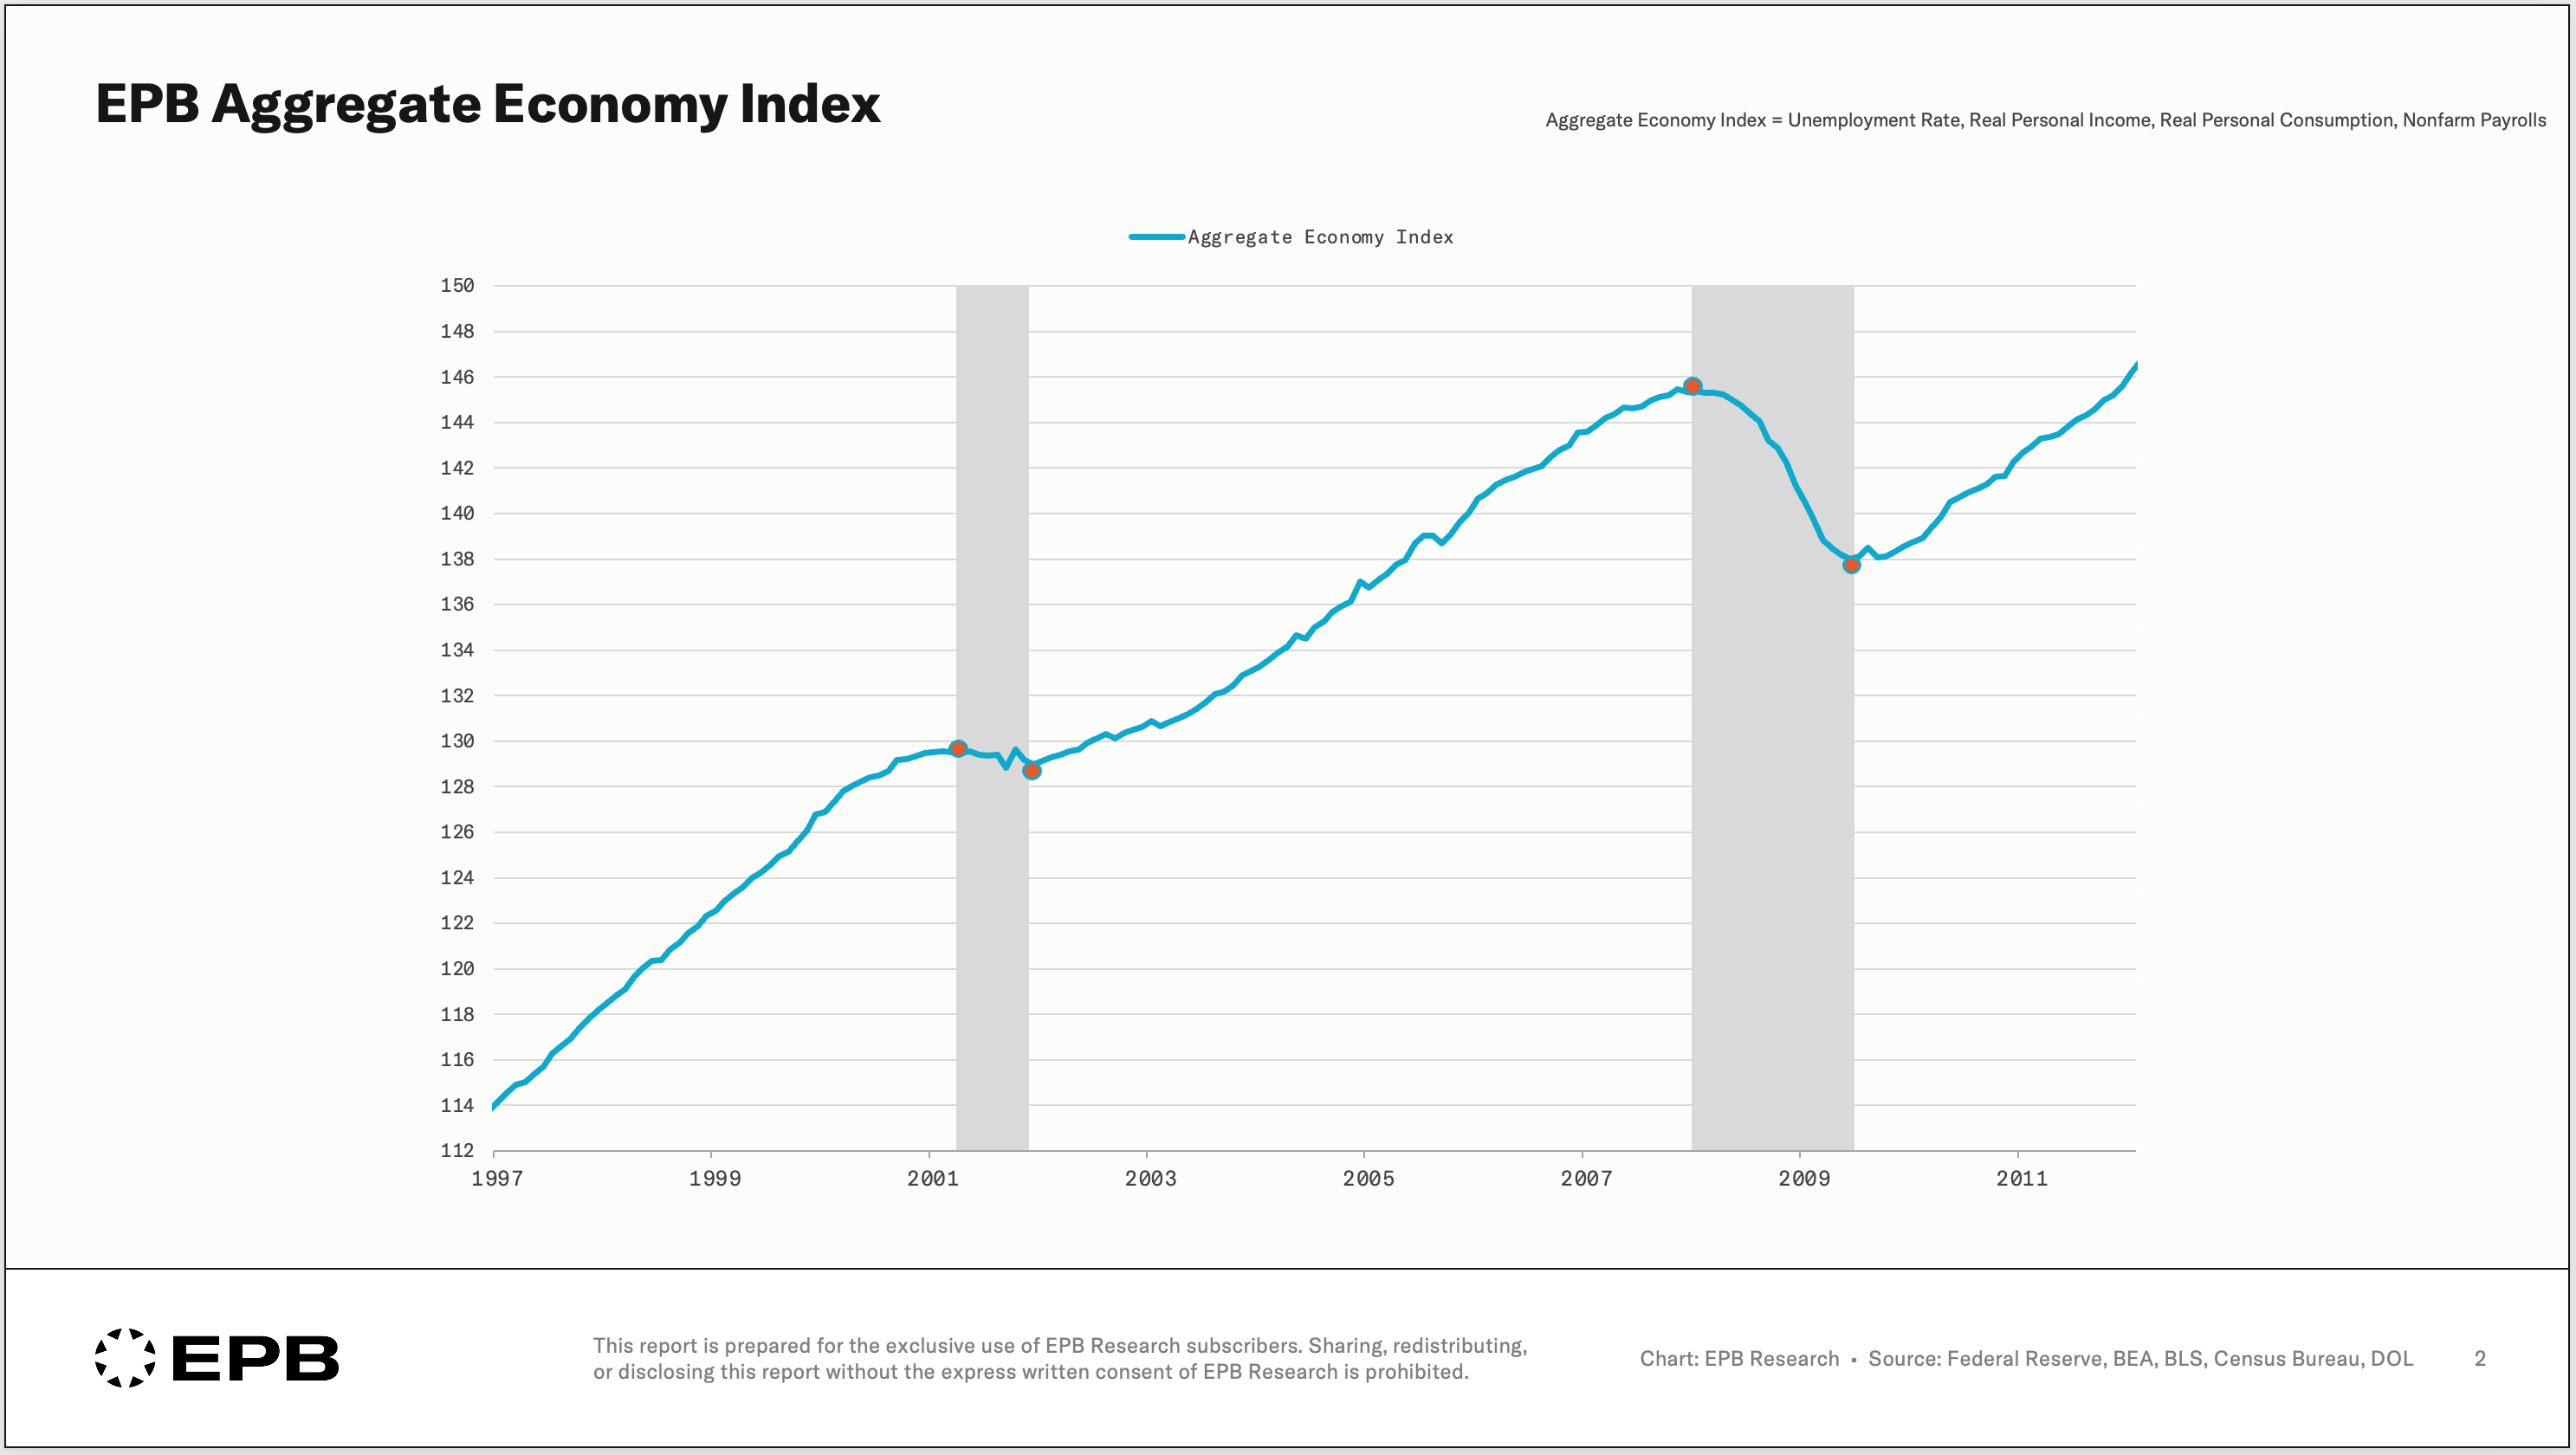
Starting your analysis here, which is what virtually everyone does, seems useful. You know exactly how the economy looks today.
But there’s a logical trap. If the Aggregate Economy is the thing that defines a recession, then anything that moves with it can only ever tell you a recession has already started. You can’t be early by watching the part of the economy that defines the cycle itself. By the time it turns, you’re already living in it.
Now this is where the “stocks lead the economy” belief comes from…
If you line up S&P 500 earnings against that broad economy in the 2001 and 2008 recessions, you can see that earnings peak a little before it. Not by much, but they do turn first.
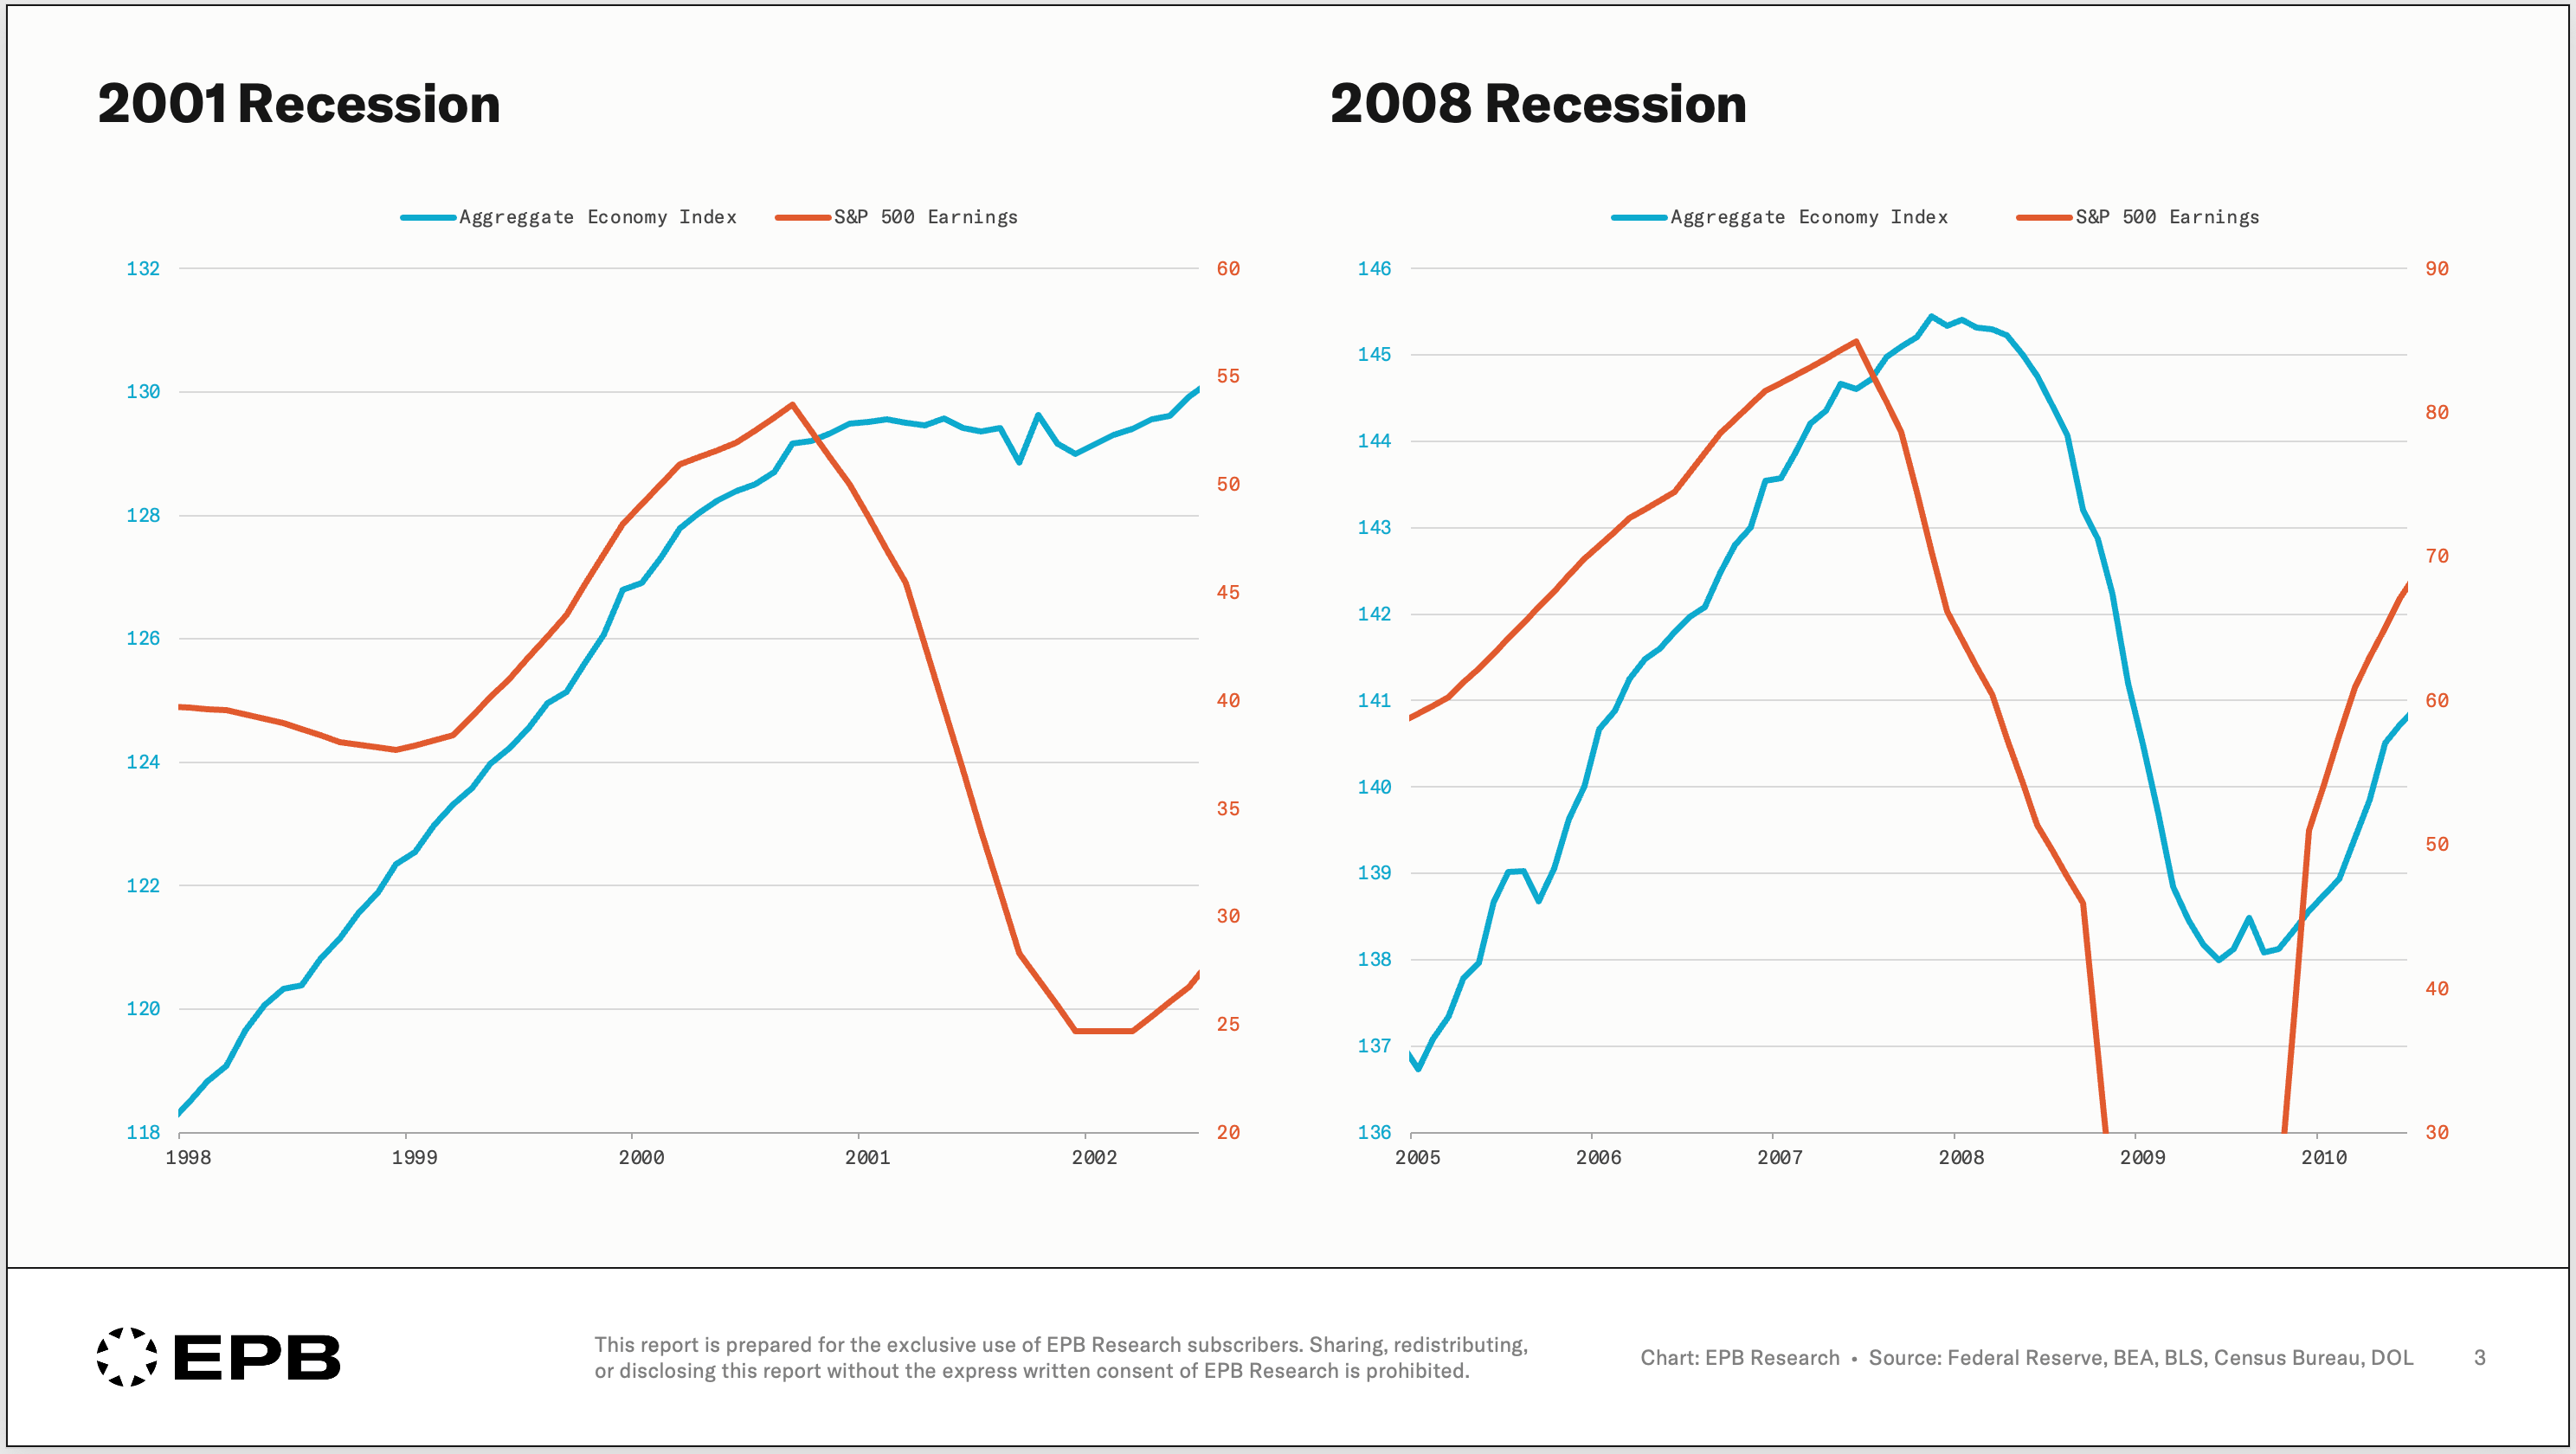
And since stock prices track earnings closely, stocks also peak a few months ahead of a recession.
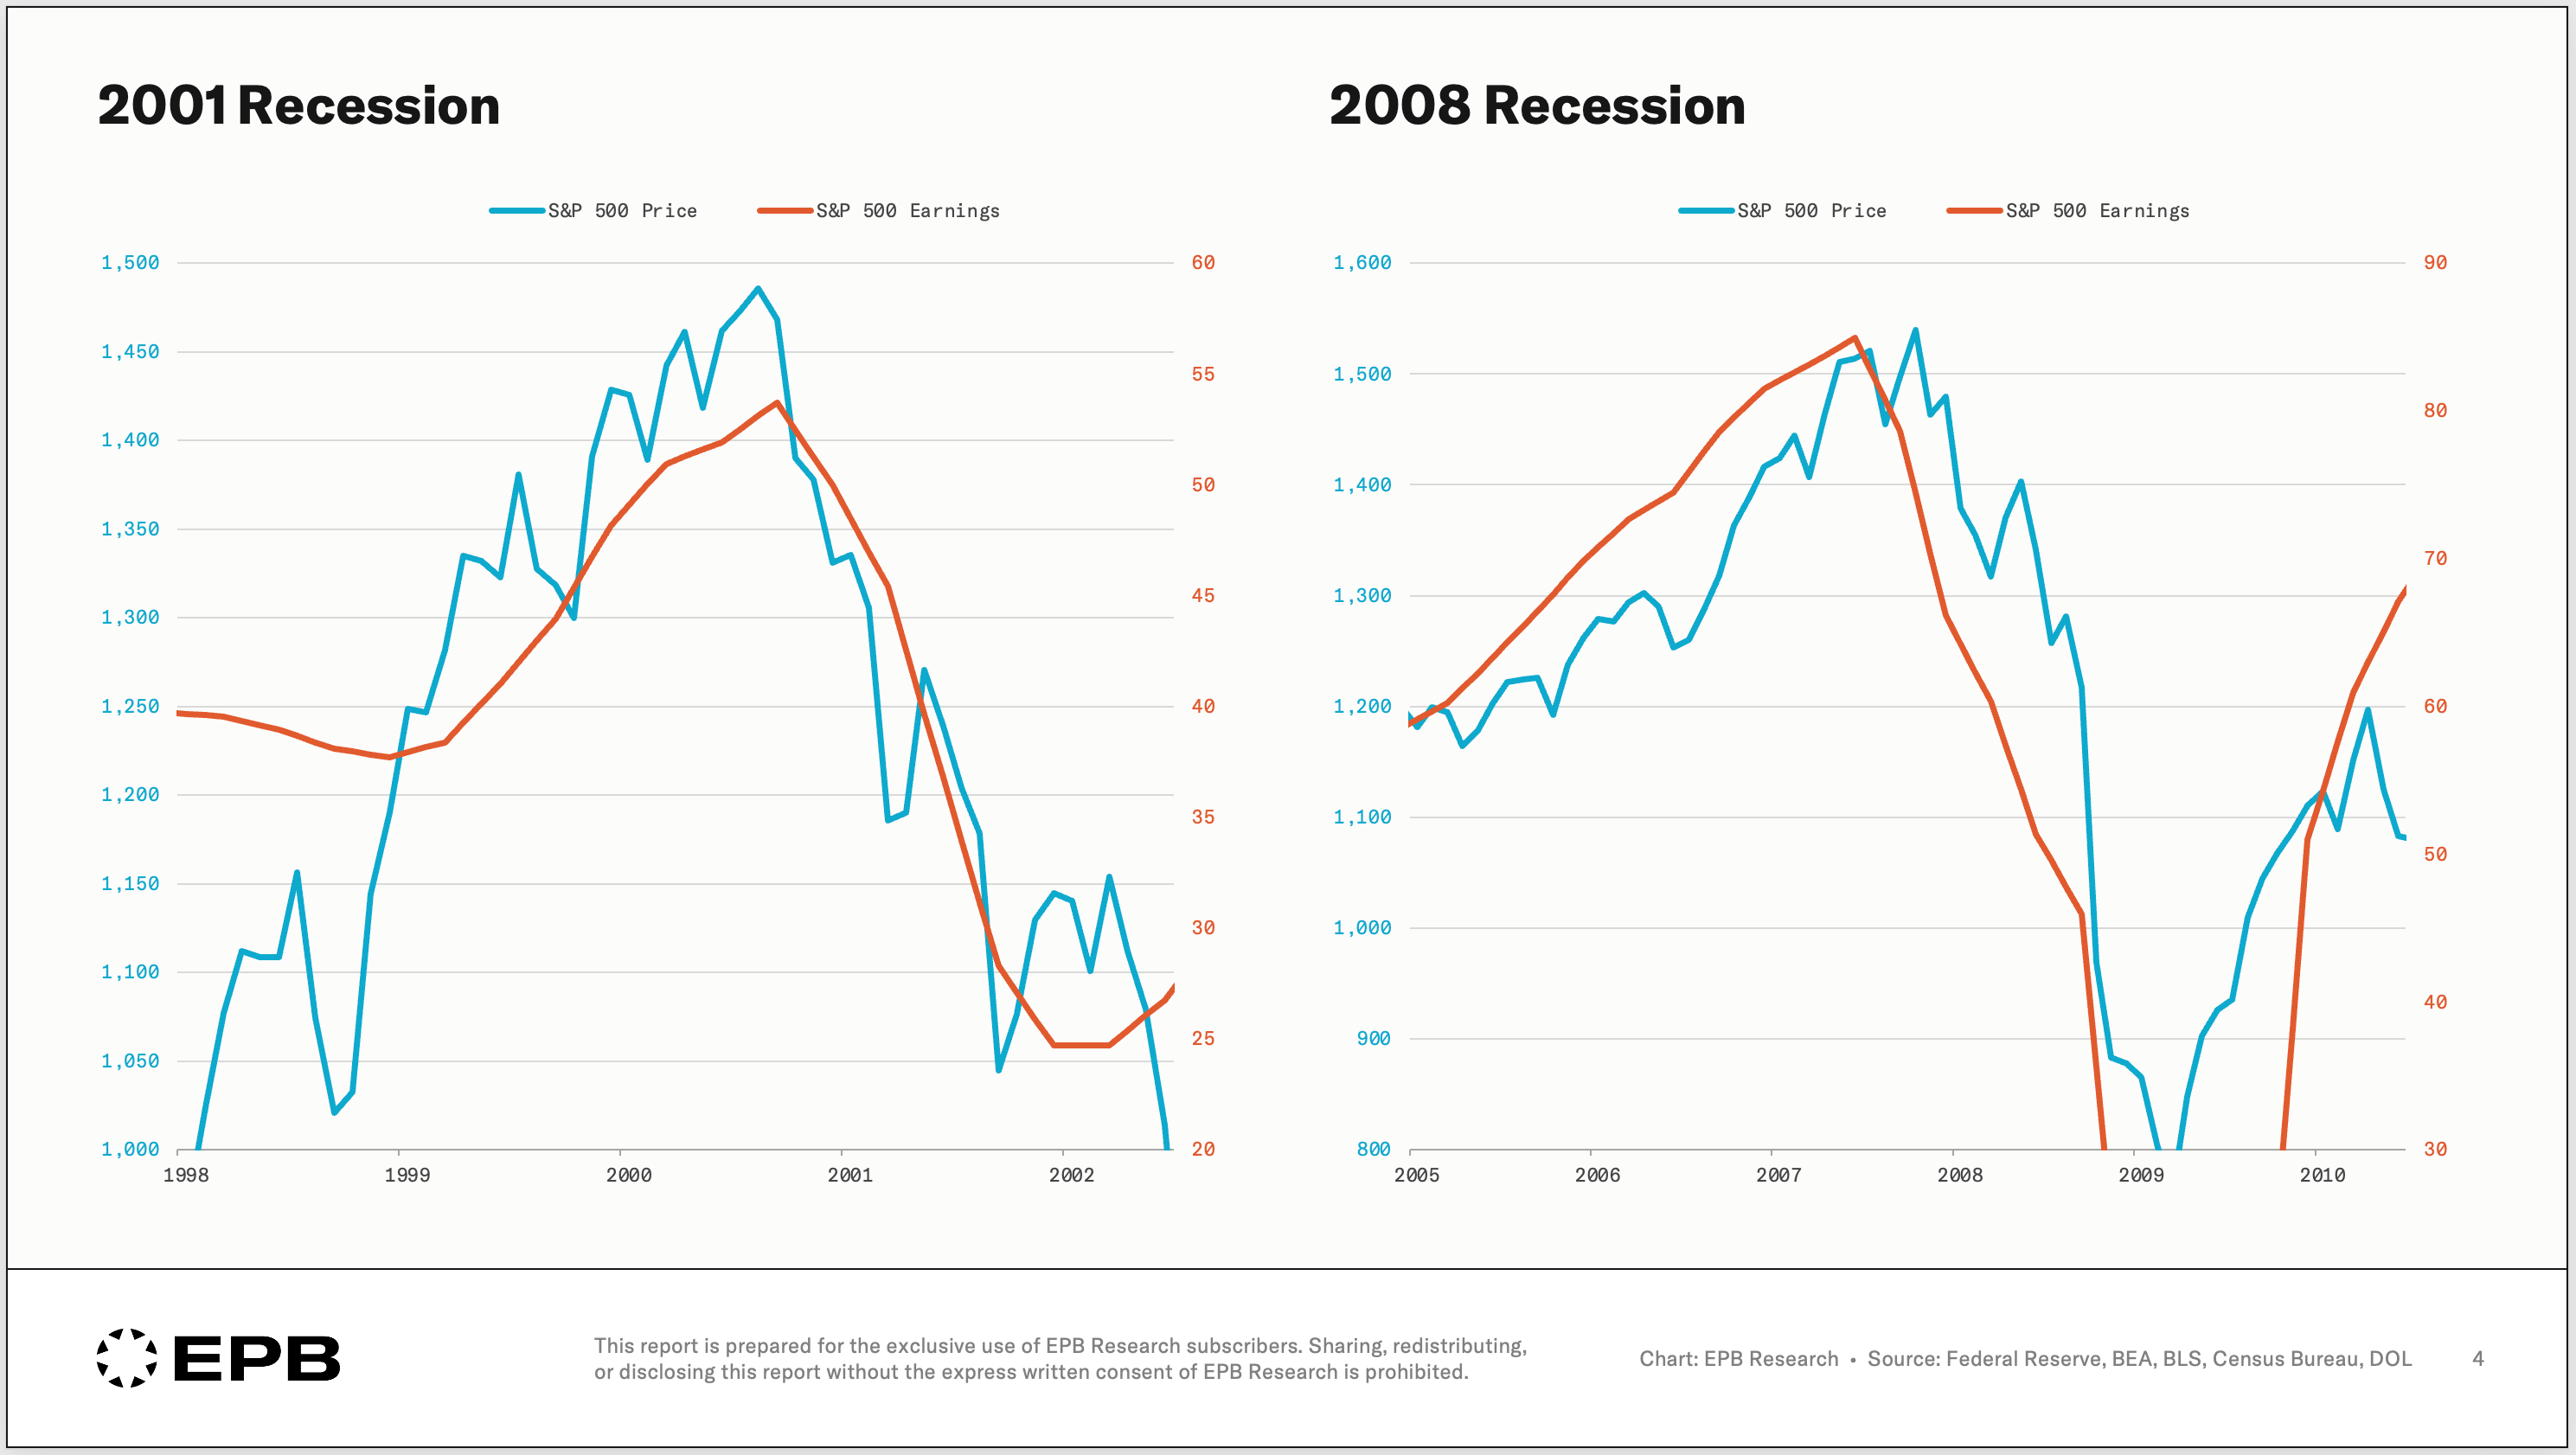
So the myth is half true. Stocks really do lead the broad economy, just barely. It’s not enough to give you a warning, and sometimes, stock prices or earnings don’t lead at all.
Why bring up earnings, instead of just watching the price? Because a stock price is underlying earnings multiplied by a multiple, which is more random, harder to predict, and based on things like sentiment or risk appetite.
The earnings part is far more predictable. If you want a clean signal, you watch earnings and leave out the noise of animal spirits.
When you do, you find something important the headlines miss. In the two most recent recessions, stock prices didn’t lead earnings. They lagged them. Earnings rolled over first, and the market followed.
This leads to the real question…
If earnings lead the broad economy (slightly), and stocks just follow earnings (on average), then what makes earnings turn?
The answer is the Cyclical Economy.
Remember that the Cyclical Economy measures growth and employment in construction and manufacturing, and this bucket of economic data peaks and rolls over well before earnings do.
In the 2001 recession, the EPB Cyclical Economy Index peaked before earnings.
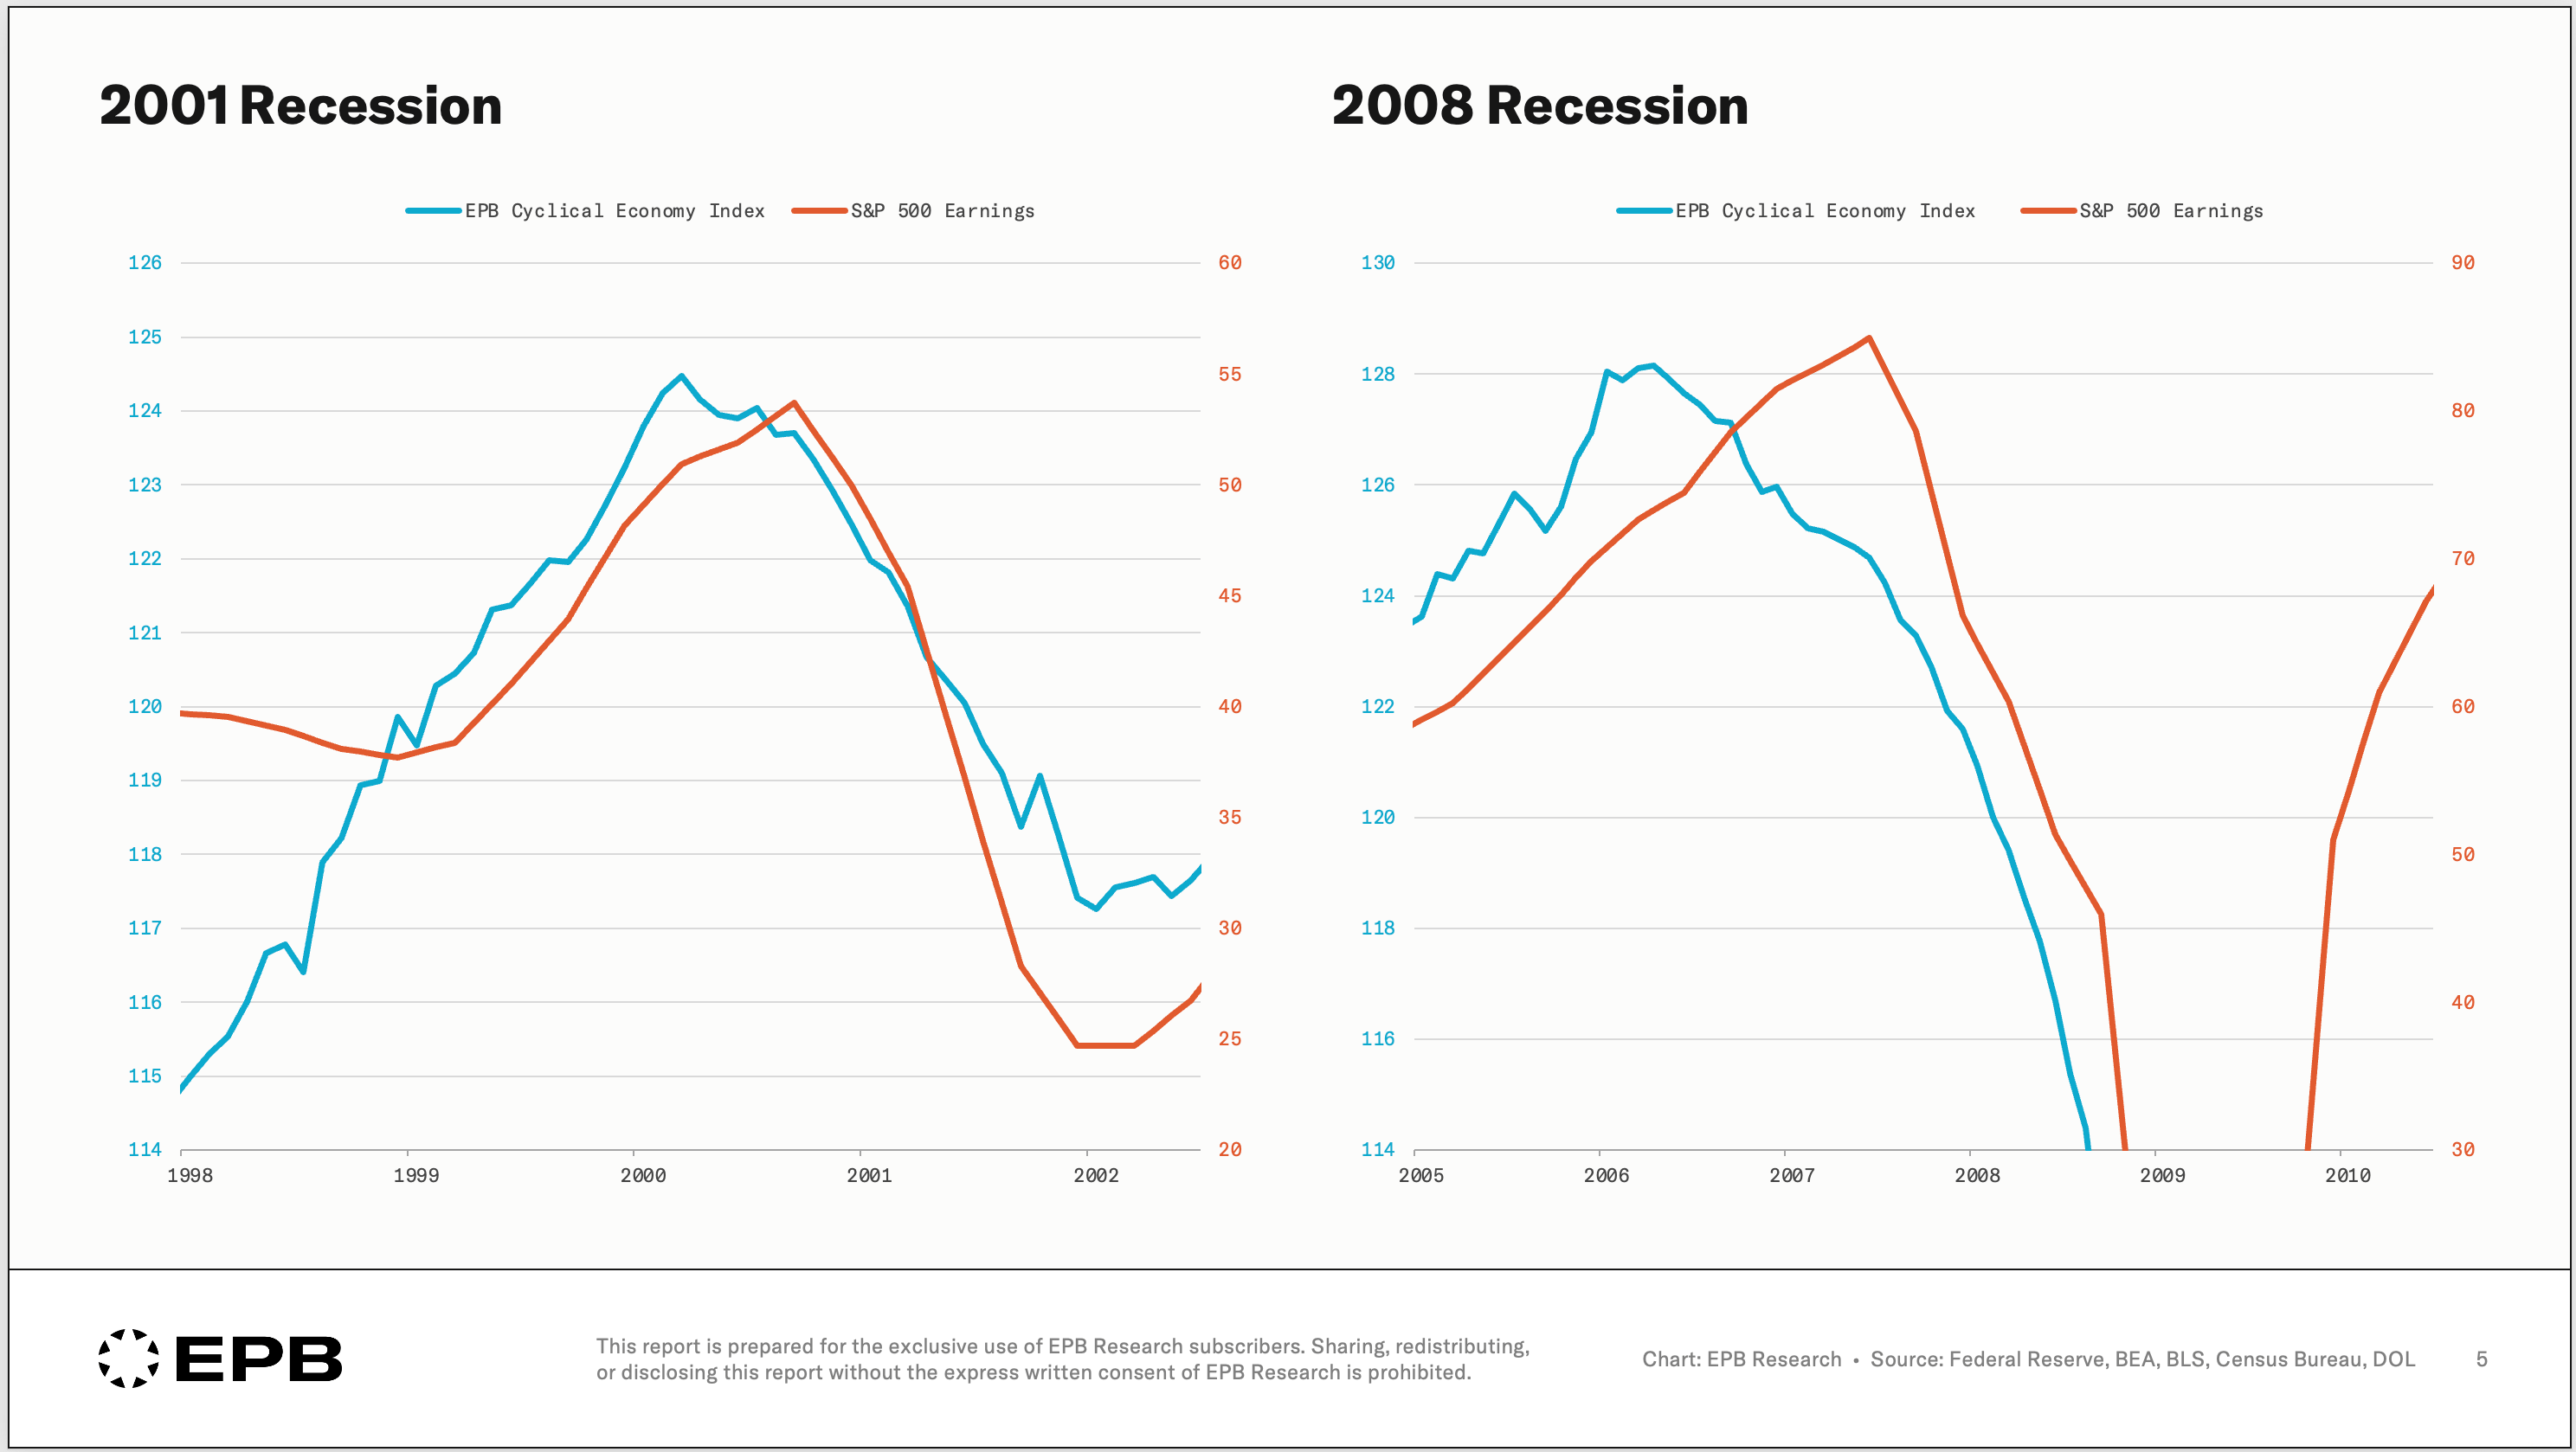
In the 2008 recession, the cyclical data turned more than a year ahead of earnings, around the summer of 2006, while the stock market kept climbing into late 2007.
So the order that’s played out repeatedly is: the Cyclical Economy turns first, then earnings, then stock prices, and only then the Aggregate Economy and official recession.
The reason is mechanical, as we described earlier.
Money and credit tighten, and construction and manufacturing feel it first because they’re the most credit-sensitive corners of the economy.
Their decline pulls down earnings, falling earnings pull down stocks, and the lost jobs and income from construction and manufacturing drag the broad economy into recession.
Construction and manufacturing are a small slice of the economy today, but size isn’t the point. They’re the engine, and the engine always turns first.
There’s one more distribution to think about. “Stocks” isn’t even one thing. Stock prices generally refer to blue-chip indexes like the S&P 500, but there are other asset classes like real estate, corporate credit, and an entire spectrum within those classes, too.
There’s a sequence to the ups and downs of those assets as well. Some assets are more economically sensitive and track more closely with the Cyclical Economy, while others are more services-oriented and track more closely with the Aggregate Economy.
Putting everything together, the lesson is simple.
The thing to watch isn’t stock prices.
Many people watch stock prices to tell them what the economy is going to do, which is then supposed to inform them of stock prices? The logic amounts to nothing more than trend following, which is a perfectly fine strategy, but it’s not to be confused with economic analysis.
It’s the front of the sequence: money, credit, and most importantly, the Cyclical Economy that drives everything downstream of it.
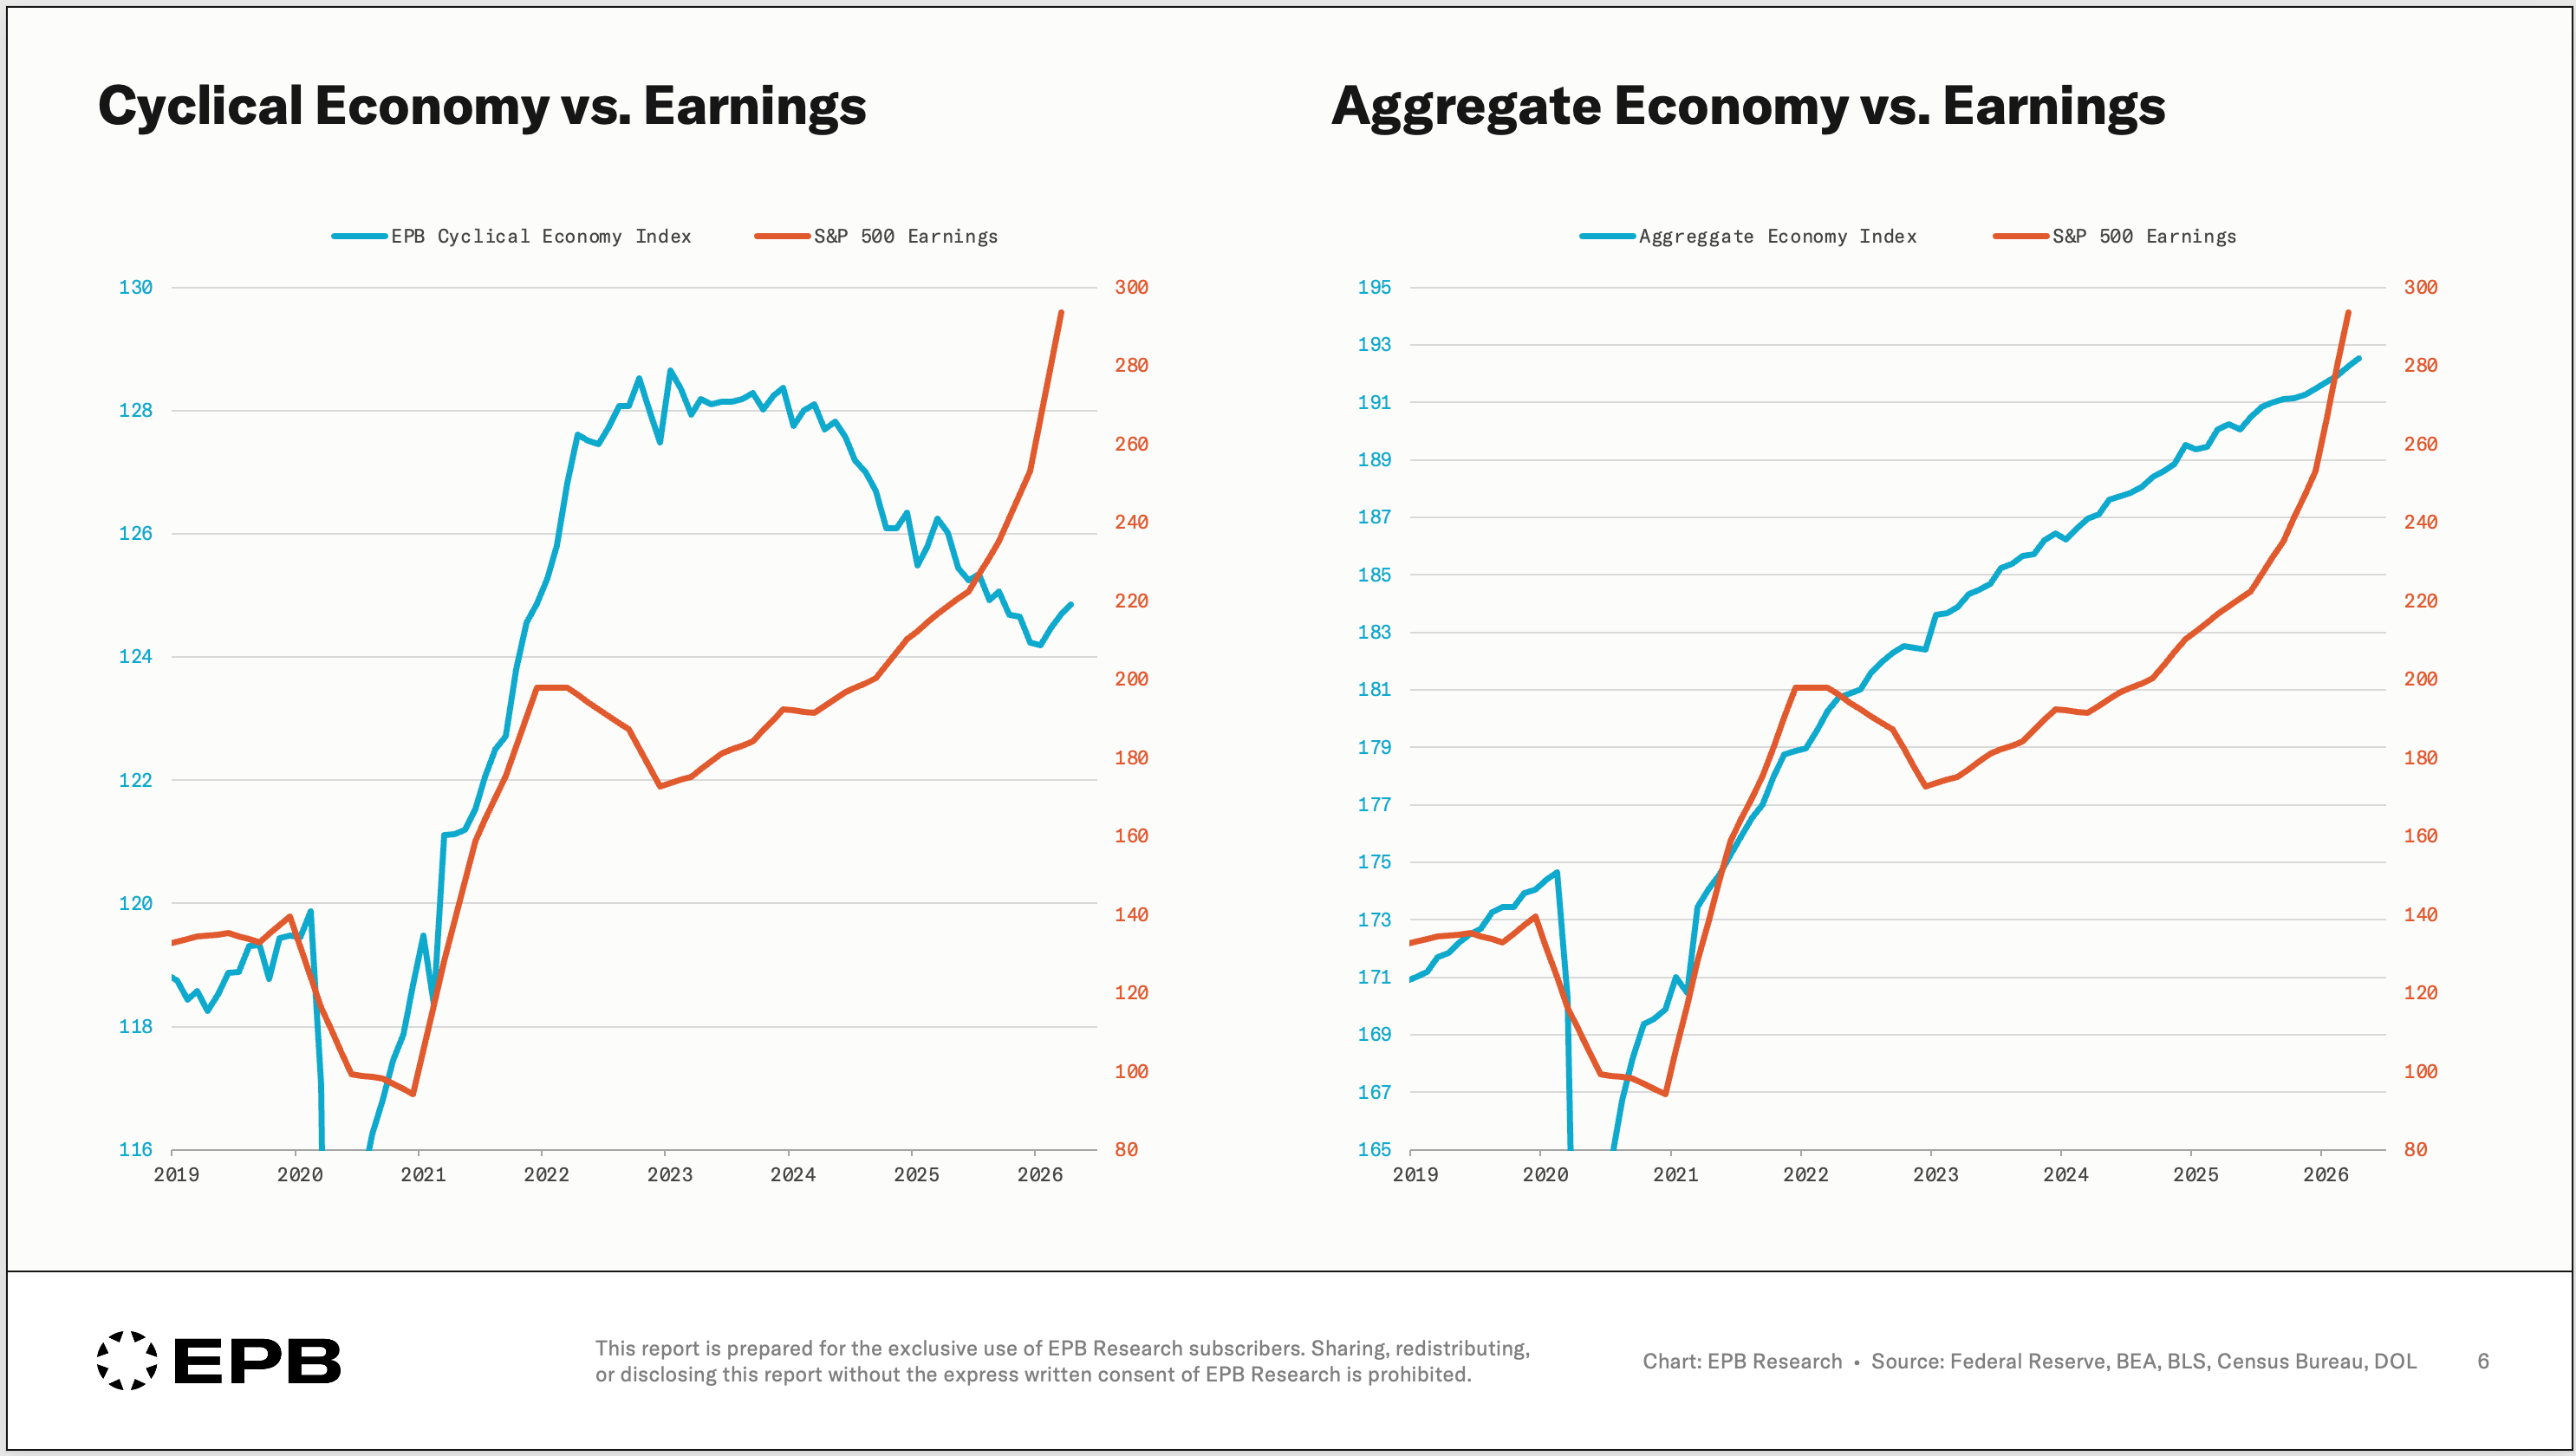
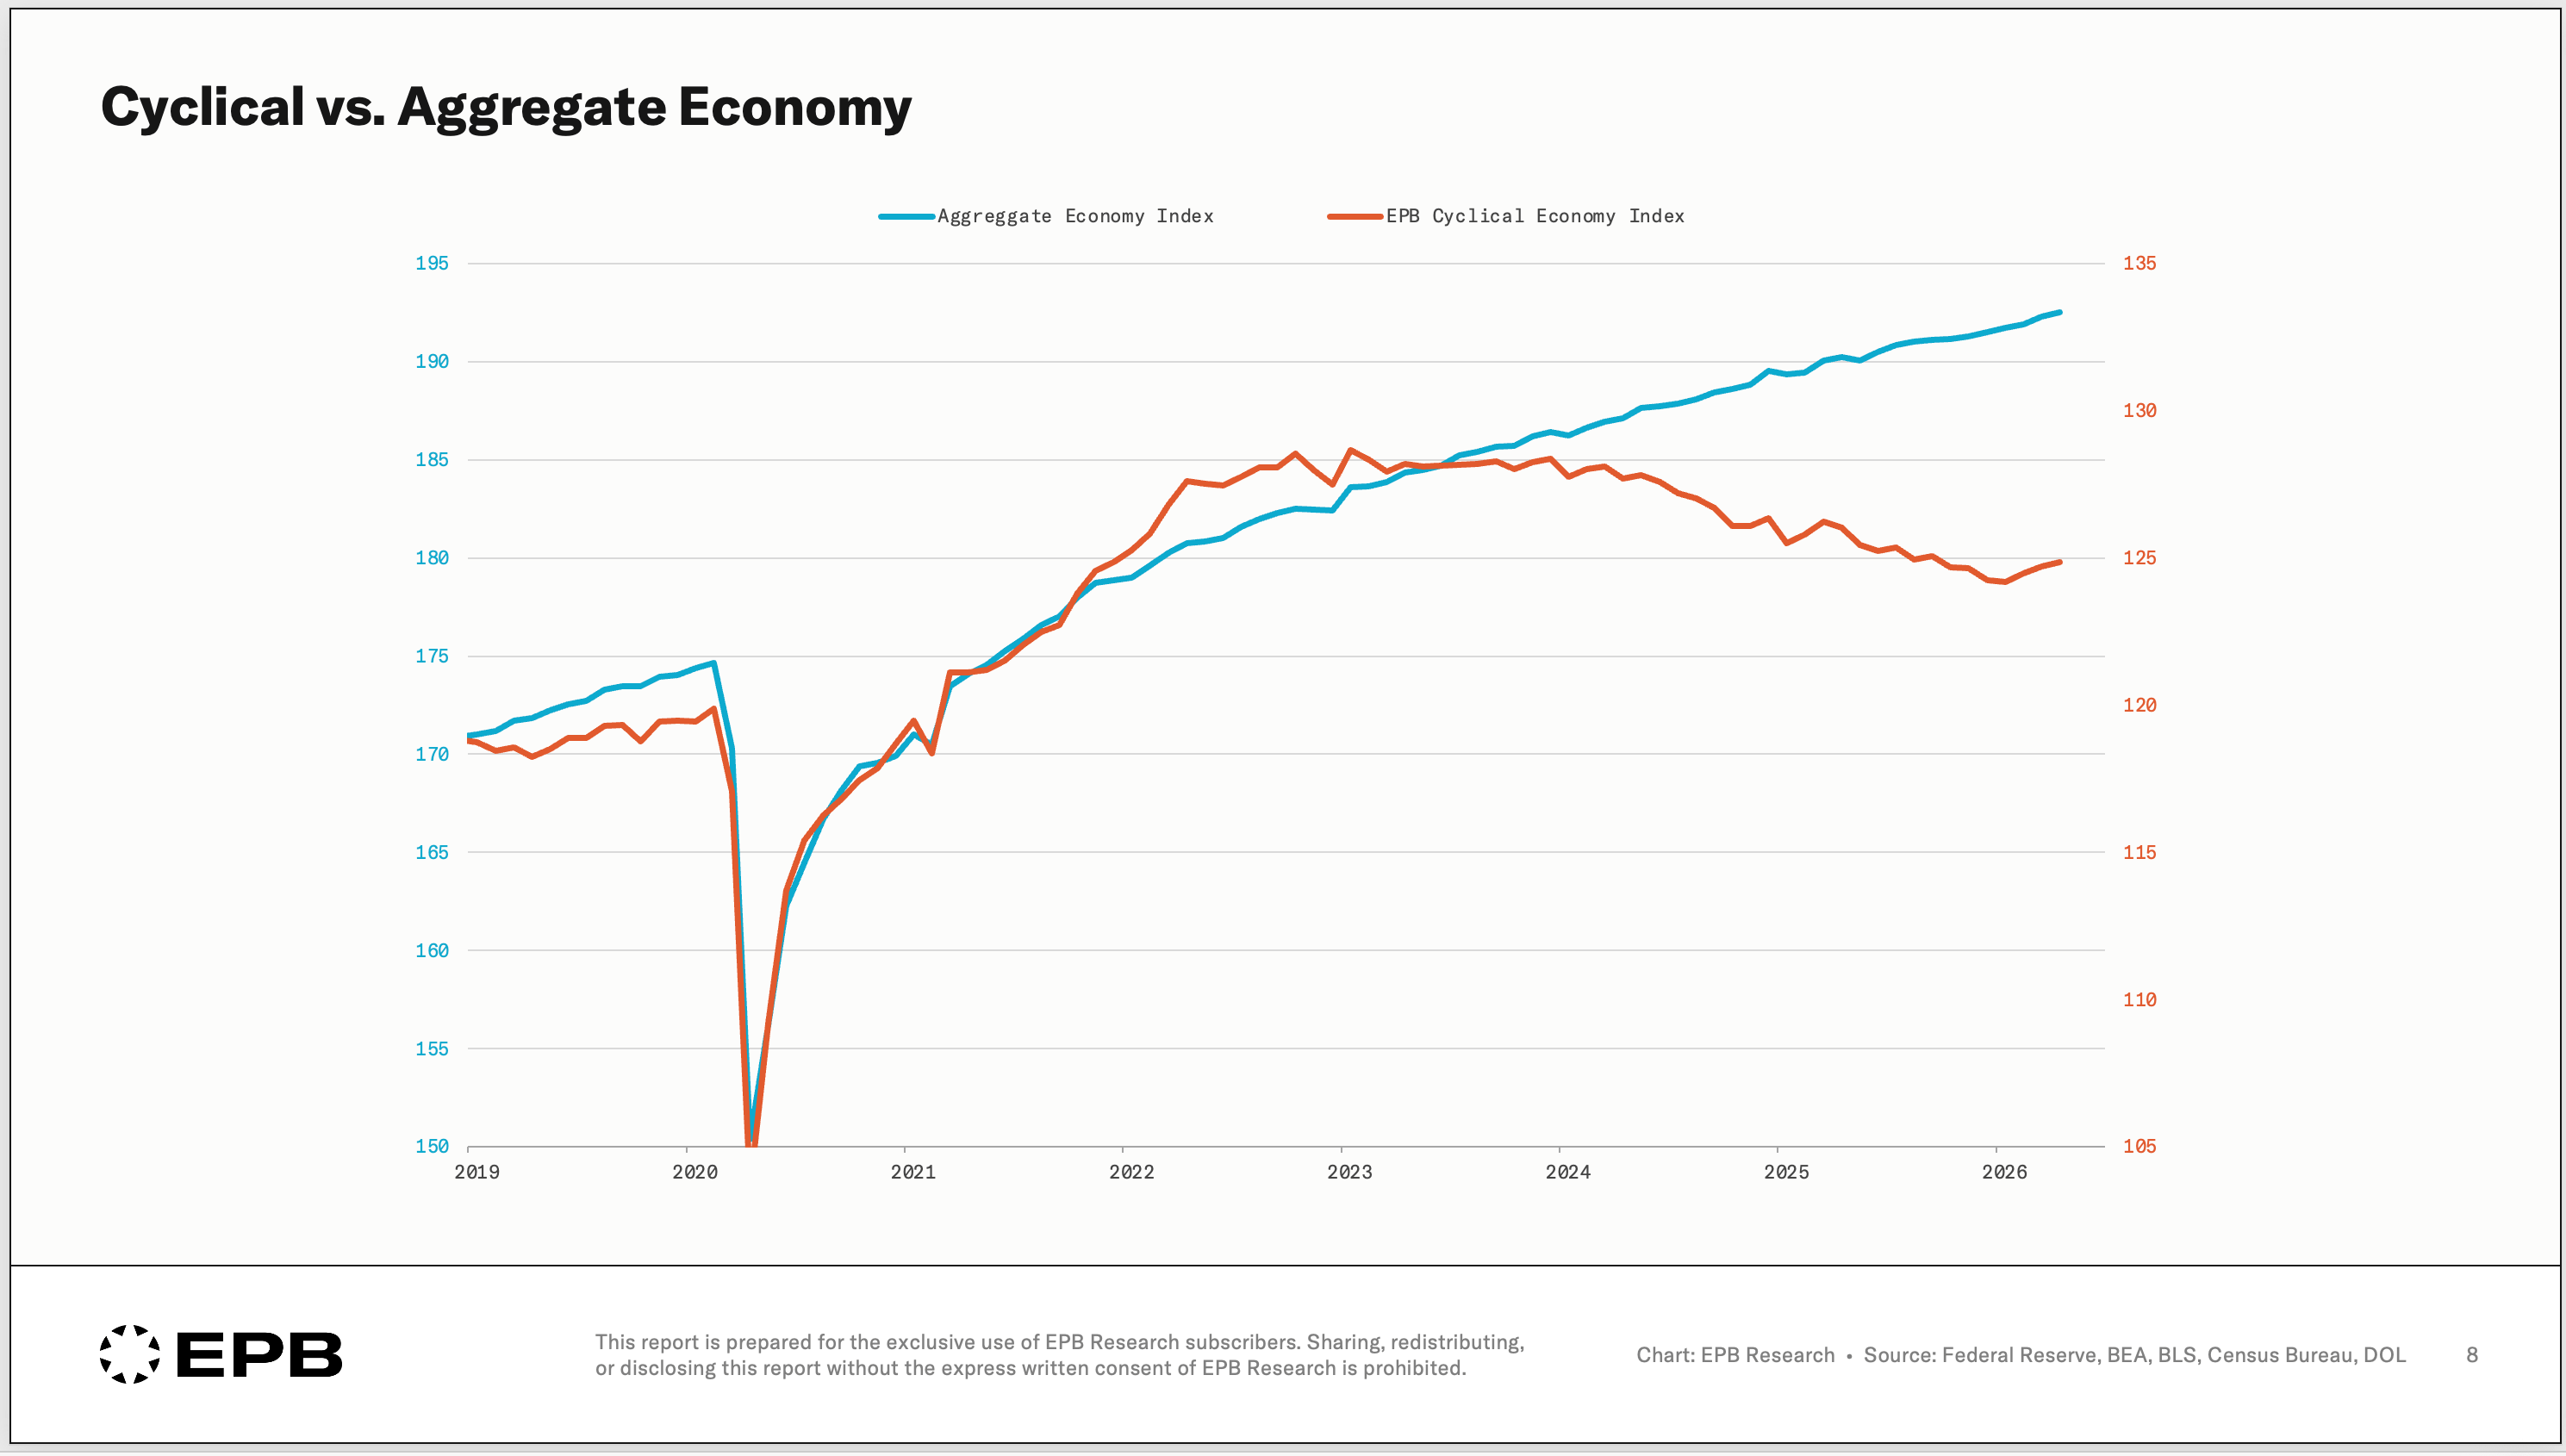
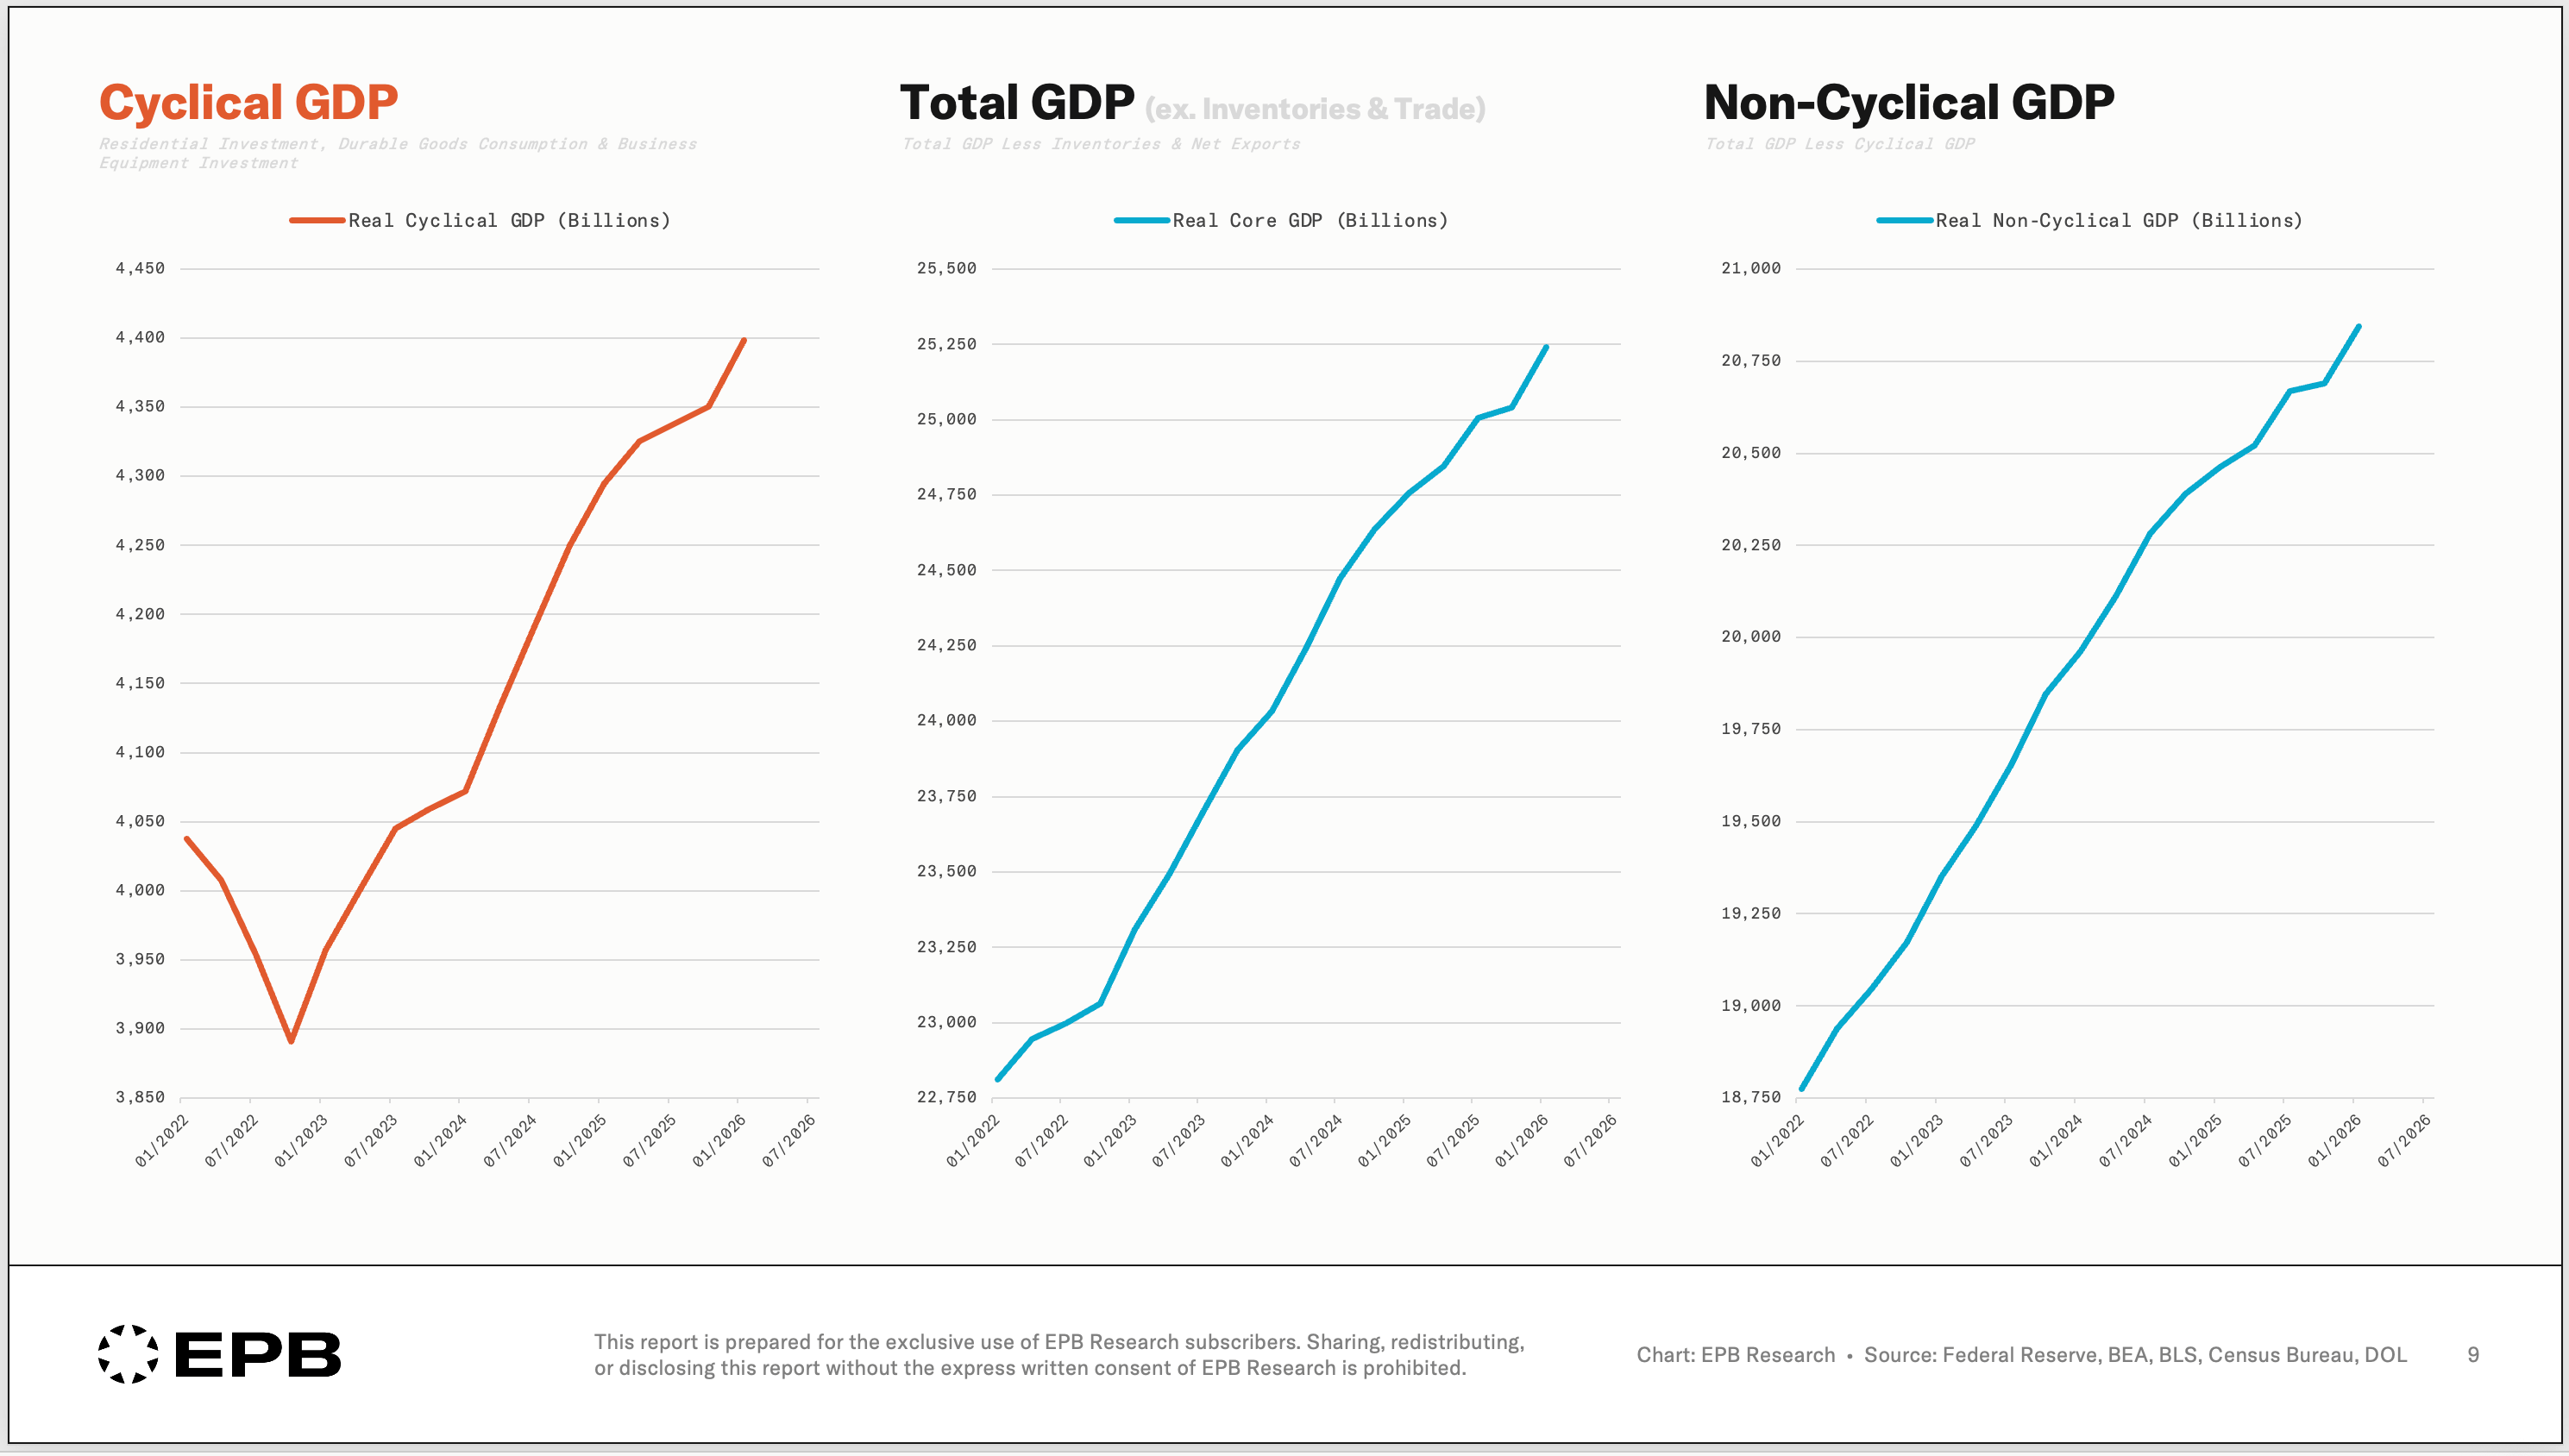
Today, for instance, we see a divergence: the Cyclical Economy has been falling, albeit quite mildly, while the Aggregate Economy continues to rise.
Another proxy we use, Cyclical GDP, hasn’t confirmed that softening yet.
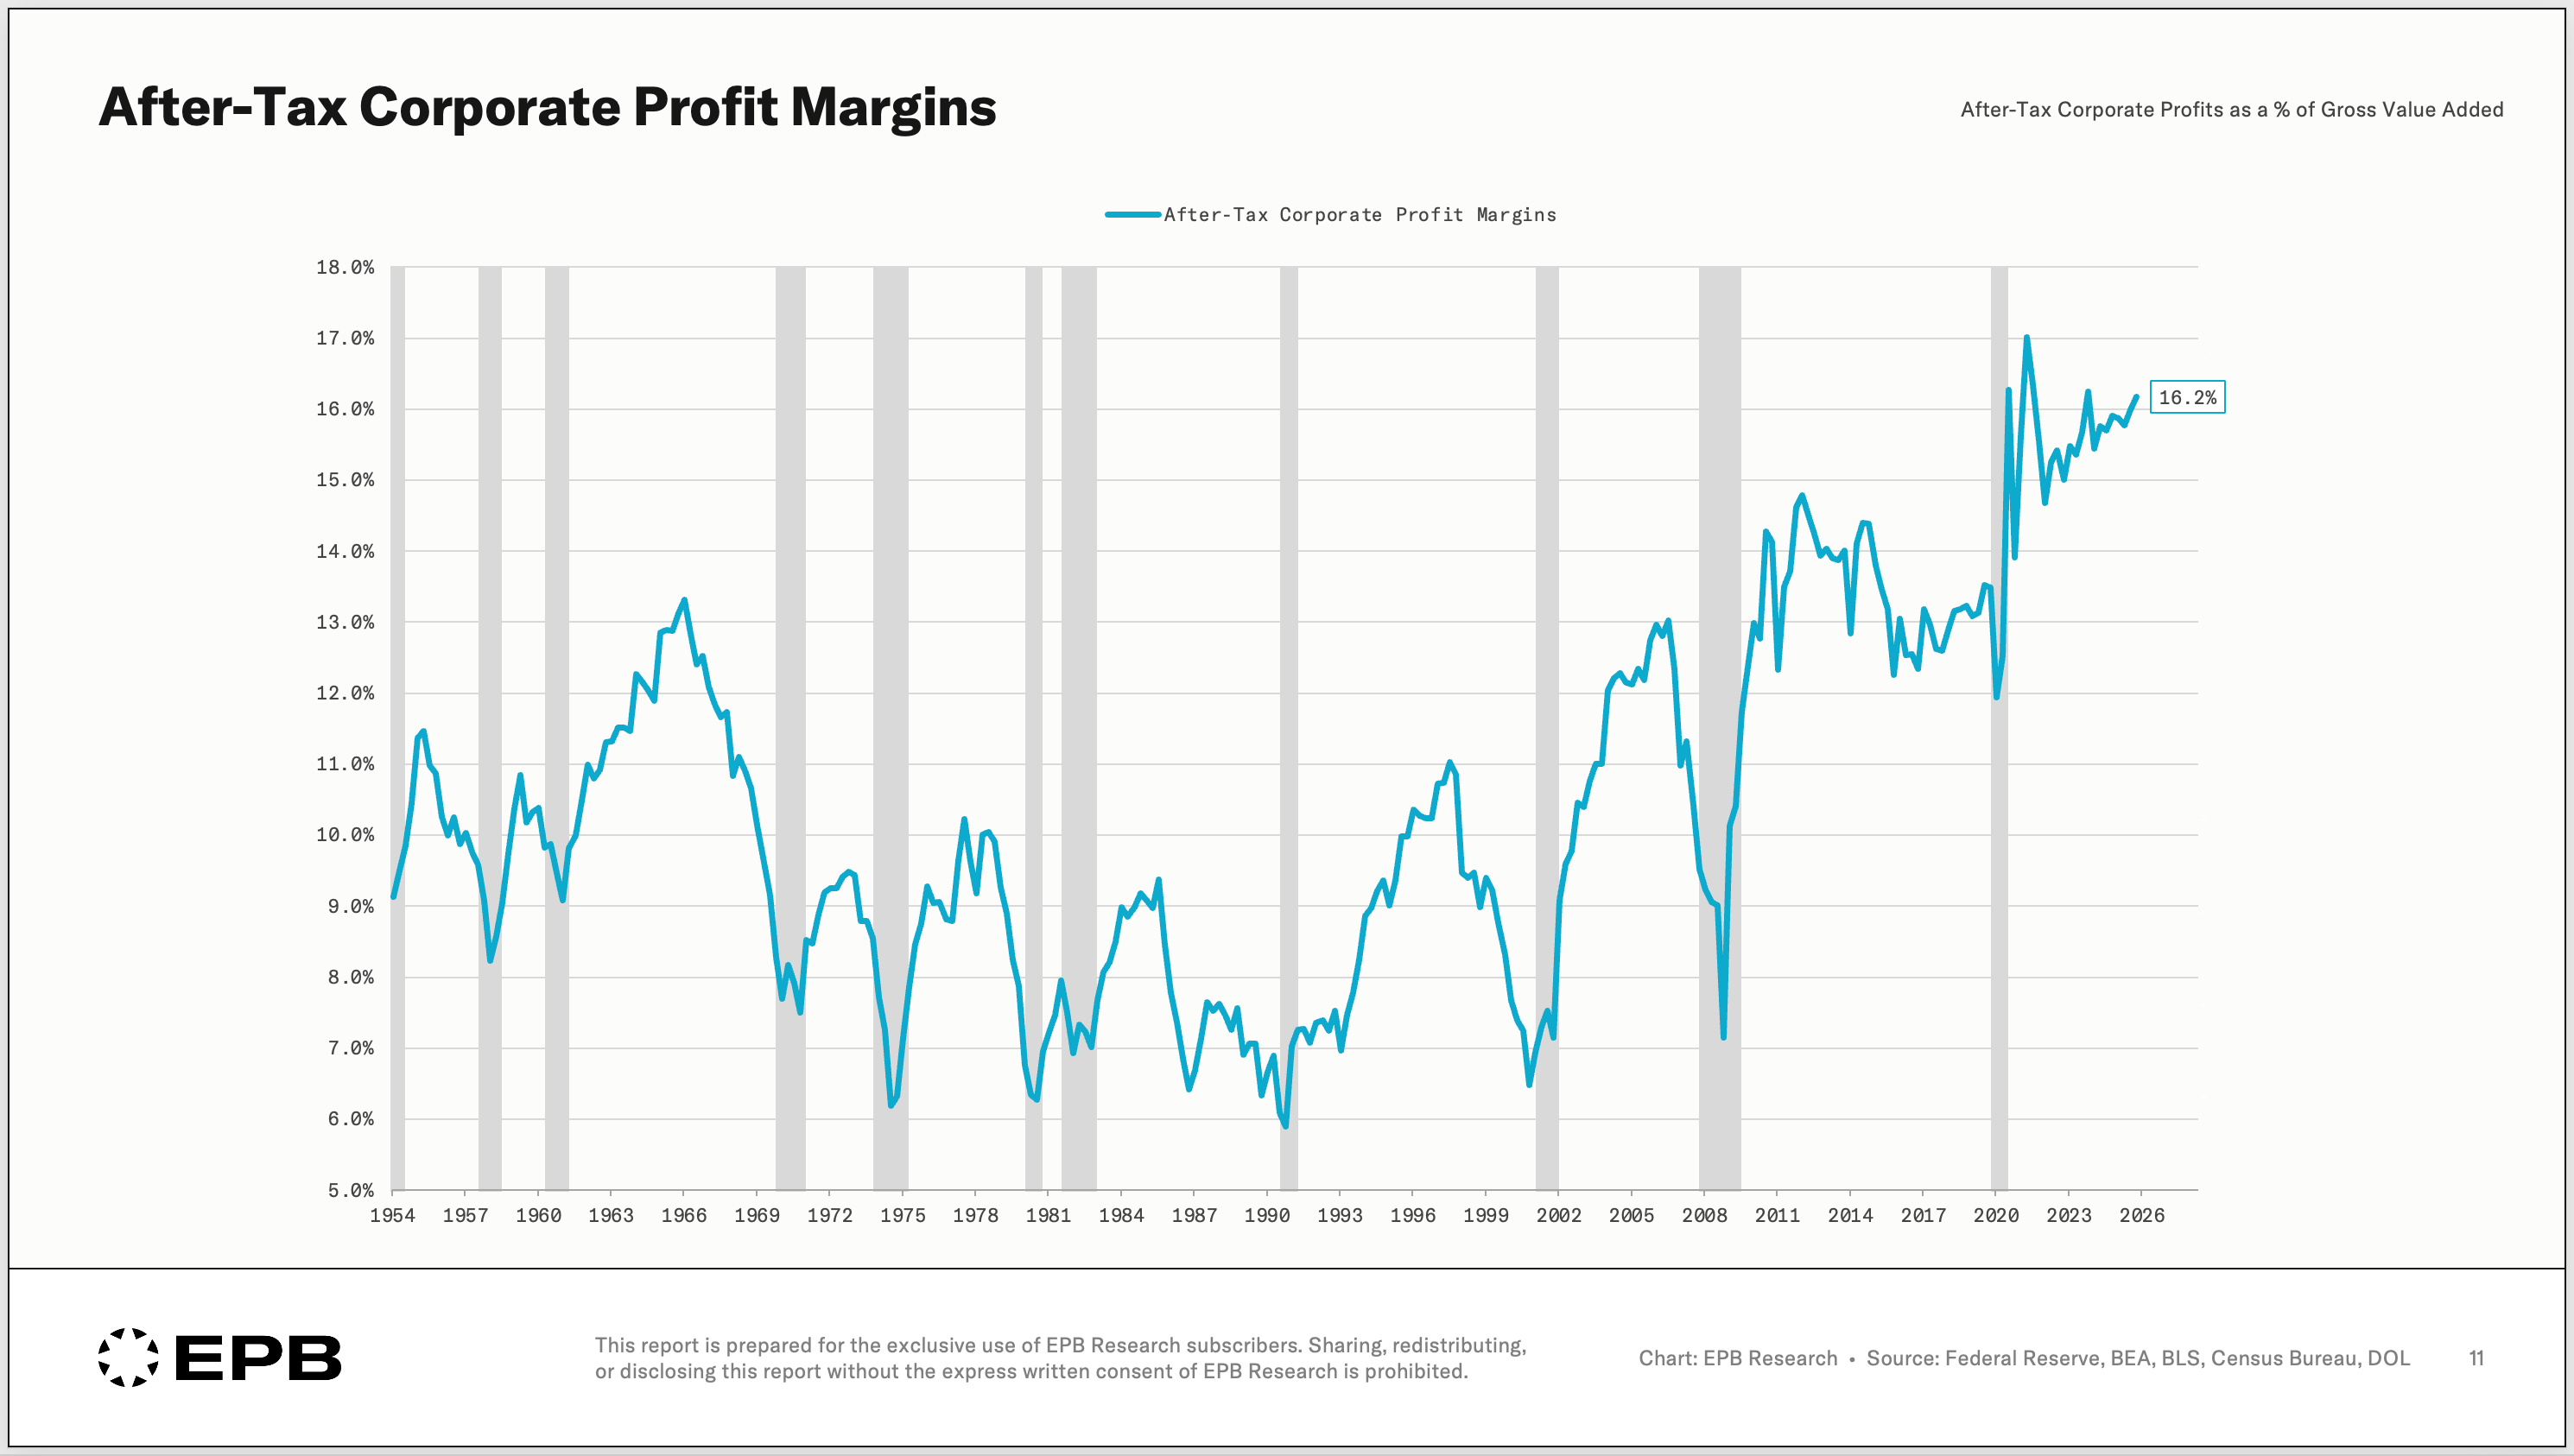
And running underneath it is a secular trend, profits rising faster than the economy, which keeps pushing corporate margins higher.
Where the front of the sequence stands at any given moment, and whether it adds up to real cyclical vulnerability or an all-clear sign for assets, is the question that actually matters.
That’s what we track every week at EPB Research against the live incoming data.
To see this framework applied to the data each week, subscribe to the free EPB Newsletter.
One email per week with ongoing business cycle education plus live examples of the framework in action.
Related framework teachings:
The 20% of the Economy That Drives 100% of Recessions: Why conventional analysis fails, and the three sectors you should actually be watching.
How to Read the GDP Report in 4 Steps: Most of GDP can’t tell you where the cycle is going. Here’s the part that can.
The metric problem runs deeper than the cycle. Construction and manufacturing turn first because they're credit-sensitive — that's the cyclical argument. But there's a secular version of the same problem: when you track aggregate GDP and aggregate unemployment, you're watching metrics that were never designed to show whether the gains are reaching the people doing the work. The Cyclical Economy leads the recession. The distribution question never shows up in the metrics at all.
Hello from Western Colorado:
Eric Basmajian, your scholarship is excellent. Your emphasis upon physical evidence, housing, construction activity, manufacturing, credit conditions, and other real economic variables represents precisely the type of economic analysis that has become increasingly rare in a world dominated by financial narratives. Moreover, your argument that the stock market has ceased functioning as a reliable leading indicator is particularly compelling because it returns economics to observable reality rather than sentiment, liquidity flows, and speculative expectations.
Accordingly, as a sociologist studying what I describe as the emerging Fourth Wave economy, I would respectfully suggest that your framework may eventually extend even further. Because the Second Wave industrial economy was organized around labor and capital, the emerging Fourth Wave AI economy may increasingly organize itself around uncertainty reduction.
In such a system, value may no longer arise primarily from human labor inputs, but from autonomous cognitive systems that reduce uncertainty, improve predictions, eliminate error, and enable more coherent economic decisions. Information production alone does not create value. Reliable reductions of uncertainty create value. This may ultimately produce what I have called a "laborless value-added economy," where AI inference, energy, compute, and cognition become the new productive infrastructure much as manufacturing, railroads, and factories once were in the Second and Third Waves.
Thank you for your continued scholarship Eric Basmajian.
https://docs.google.com/document/d/1IFP1iK57NcIjpNUIVCnvATrtTiZkfzra-7ZzTpx9_Jw/edit?usp=sharing