

Where Do Record Corporate Profits Actually Come From?
Companies compete for a share of the existing profit pool. But a separate set of economic forces determines how large that pool becomes.

Before diving into the post, I wanted to let you know that EPB Research has a free Sunday newsletter.
One email per week with ongoing business cycle education plus live examples of the framework in action. Click the button below to join for free.
Now, let’s talk about where corporate profits actually come from…
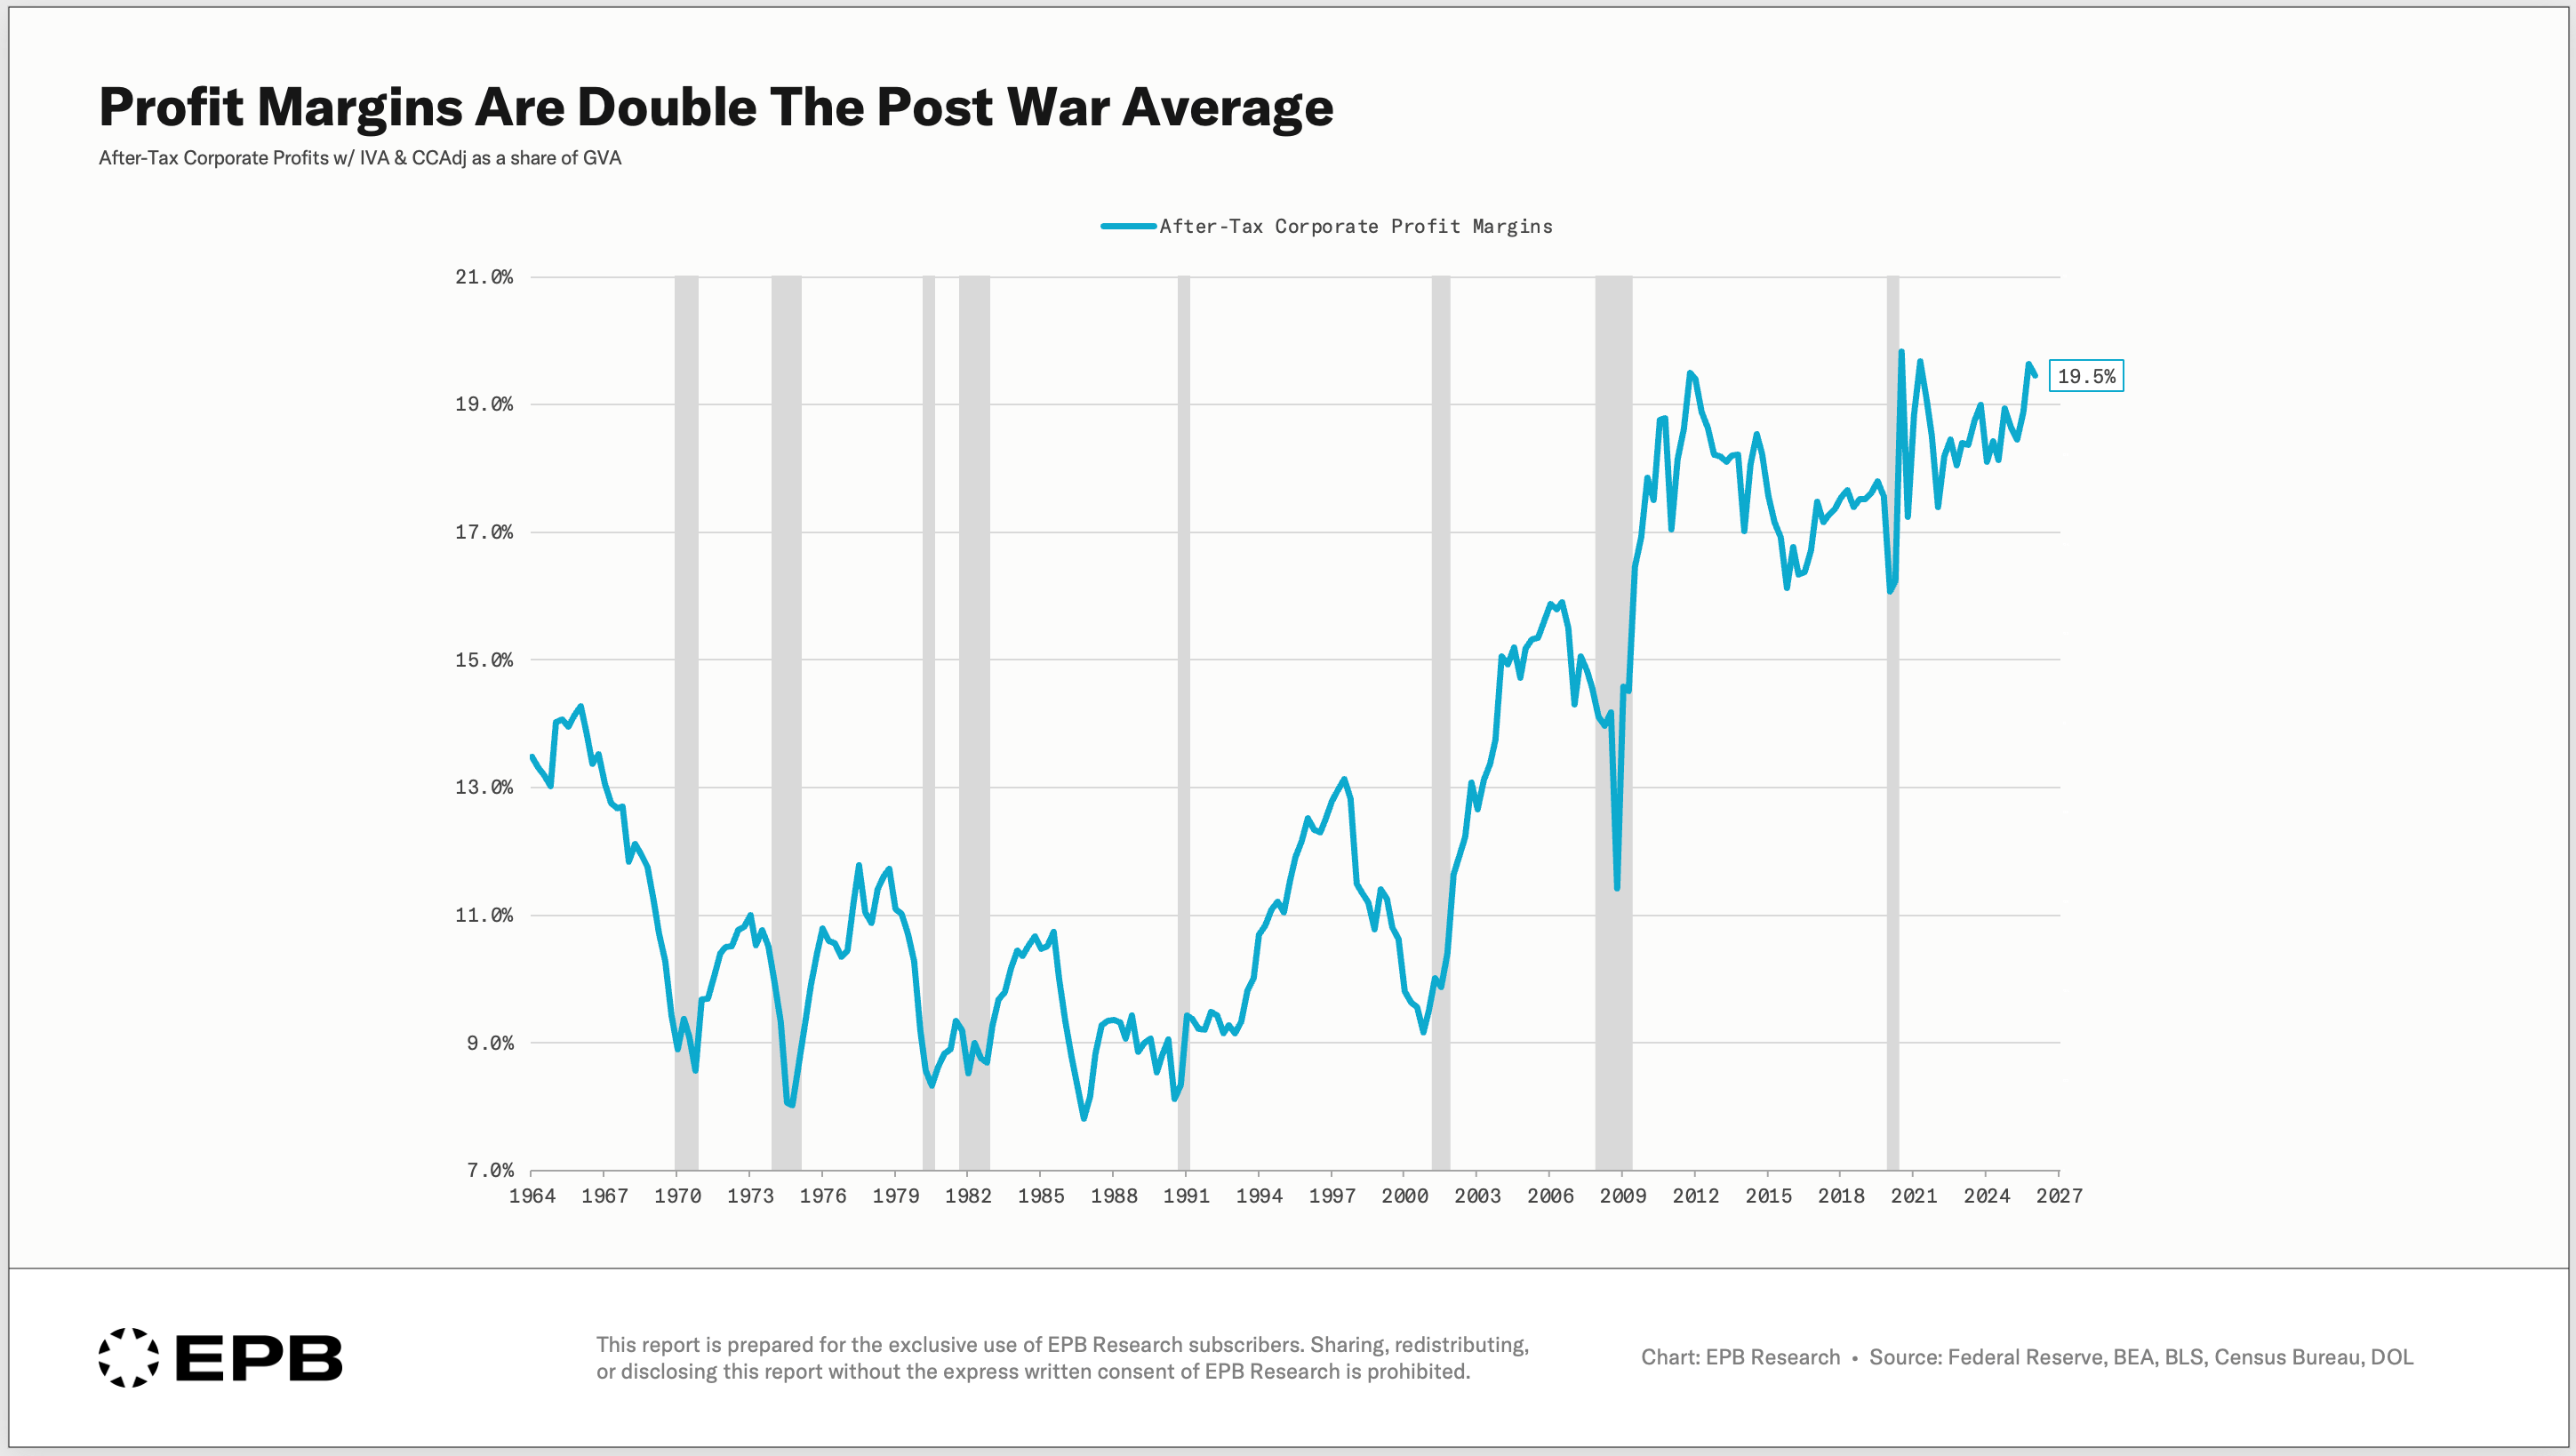
Corporate profit margins reached 19.5% in early 2026, roughly double the postwar average of 10.7%.
The usual explanation is straightforward. Companies developed better technology, gained pricing power, reduced costs, or created more popular products and became more efficient.
At the level of an individual company, that explanation can be largely correct.
A company that develops a better product can take customers from its competitors. A business that lowers its costs can capture a larger share of industry profits.
But that does not answer the bigger question.
What determines the total amount of profit available across the entire economy?
Companies compete over who captures the profits. A separate set of forces determines how large the aggregate profit pool becomes.
A single accounting relationship captures those forces.
It is called the Kalecki-Levy Profit Identity.
In this article, we will explain the identity in plain English, show how the composition of the profit pool has changed, and highlight exactly what investors and business owners can and cannot do with this information.
The Kalecki-Levy Profit Identity
Economists Michal Kalecki and Jerome Levy independently developed frameworks for deriving aggregate corporate profits from the national income and product accounts.
A simplified version of the identity can be written as:
After-tax corporate profits =
+ Business investment
+ Dividends
- Household saving
- Government saving
- Foreign saving
The formula may look dense, but the underlying idea is simple.
Every dollar of business revenue must come from someone else’s spending.
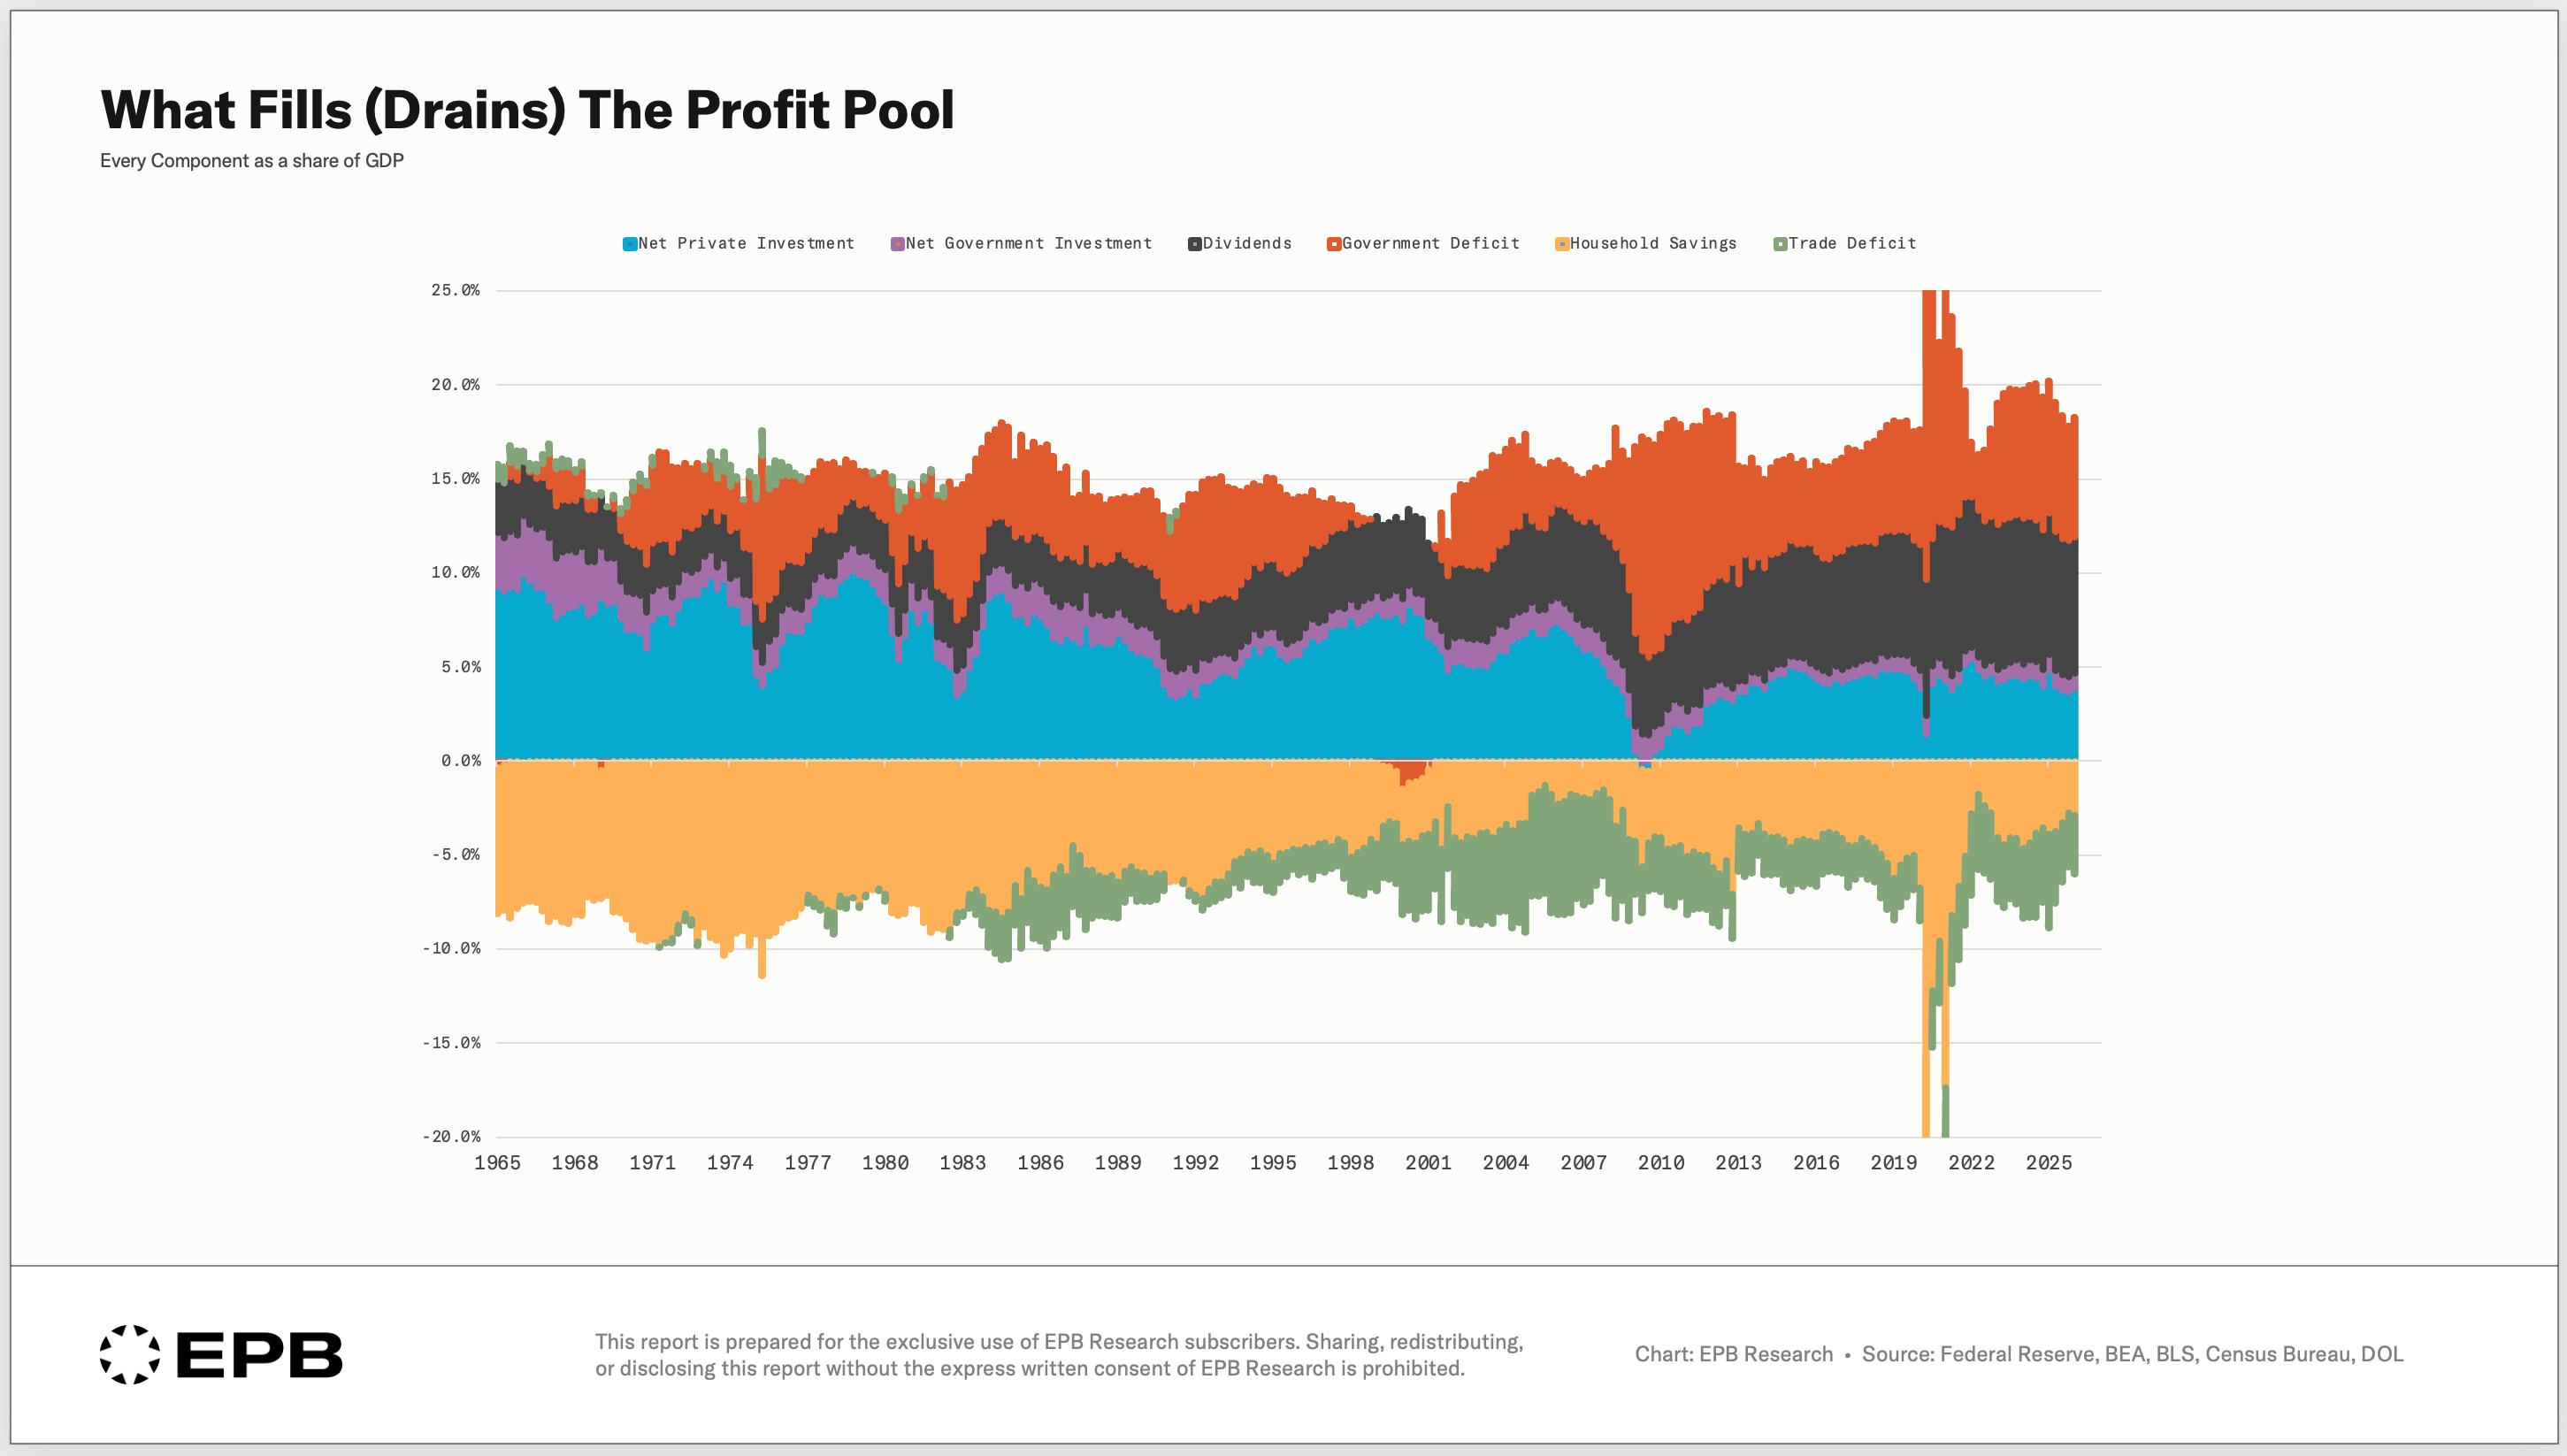
The identity tracks the major economic flows that either add spending to the business sector or remove spending from it.
Let’s translate each component into plain English.
Business Investment
Business investment includes spending on factories, equipment, software, structures, data centers, and other hopefully productive assets.
When one company builds a new factory, the spending becomes revenue for the companies that provide the construction, machinery, materials, software, and related services.
One company’s investment is another company’s revenue.
Holding everything else constant, more business investment increases aggregate corporate profits.
Dividends
Dividends are profits distributed by companies to their shareholders.
They are added back in the identity because dividend income is already reflected in the household income and saving accounts. Adding dividends allows the equation to reconcile total corporate profits, including profits that were distributed to shareholders.
Household Saving
Household saving is the portion of household income that is not spent.
When households earn income and spend it, the money flows back to businesses as revenue.
When households save a larger share of their income, less money returns to businesses through current consumption.
Holding everything else constant, higher household saving reduces aggregate corporate profits.
Lower household saving boosts corporate profits.
Government Saving
Government saving is the difference between government receipts and expenditures.
A government surplus represents positive government saving. The government collects more from the private sector than it puts back through current spending.
That acts as a drain on the private-sector profit pool.
A government deficit represents negative government saving. The government spends more into the private sector than it removes through current receipts.
Because the formula subtracts government saving, subtracting a negative number adds to the profit pool.
In plain English, a larger government deficit can increase private-sector income and corporate revenue.
This does not mean profits must rise every time the deficit increases. The other components of the equation may move in the opposite direction.
It means that, holding everything else constant, a larger deficit adds to the aggregate profit pool.
Foreign Saving
Foreign saving is the counterpart to the domestic current-account balance.
When domestic households and businesses spend more on foreign goods and services than foreign buyers spend on domestic goods and services, part of domestic spending becomes revenue for producers in other countries.
That represents a leakage from domestic income and profits to overseas.
Holding everything else constant, a big trade deficit is a leak of profits abroad.
A Simple Example
Imagine households receive $100 of income from businesses.
If households spend the entire $100, that money returns to businesses as revenue and continues circulating through the economy.
Now imagine households decide to save $10.
Businesses receive $10 less through current household spending.
For aggregate profits to remain unchanged, that $10 leakage must be offset somewhere else.
Businesses might invest an additional $10.
The government might run a $10 larger deficit.
The country might earn an additional $10 from foreign demand.
Or some combination of those flows might fill the gap.
The real economy is far more complicated, but the basic principle is the same.
Money that leaks out of current spending must be replaced by another source if aggregate profits are going to remain unchanged.
The identity tracks those sources and leakages.
What the Identity Tells Us
The Kalecki-Levy Profit Identity is not a theory about how profits should be created. It is an accounting framework: it tells us how realized corporate profits reconcile with other economic flows after the fact.
Accounting identities are always true by construction, but they do not explain why each component changed, and they do not tell us what those components will do next. The identity can reveal where profits came from. It cannot forecast.
Economy-wide profit margins are not S&P 500 margins. The national accounts cover every corporation, public and private, on standardized rules, with no buybacks and no adjusted earnings. The two move together, but they are not the same number.
What Changed in the Profit Pool?
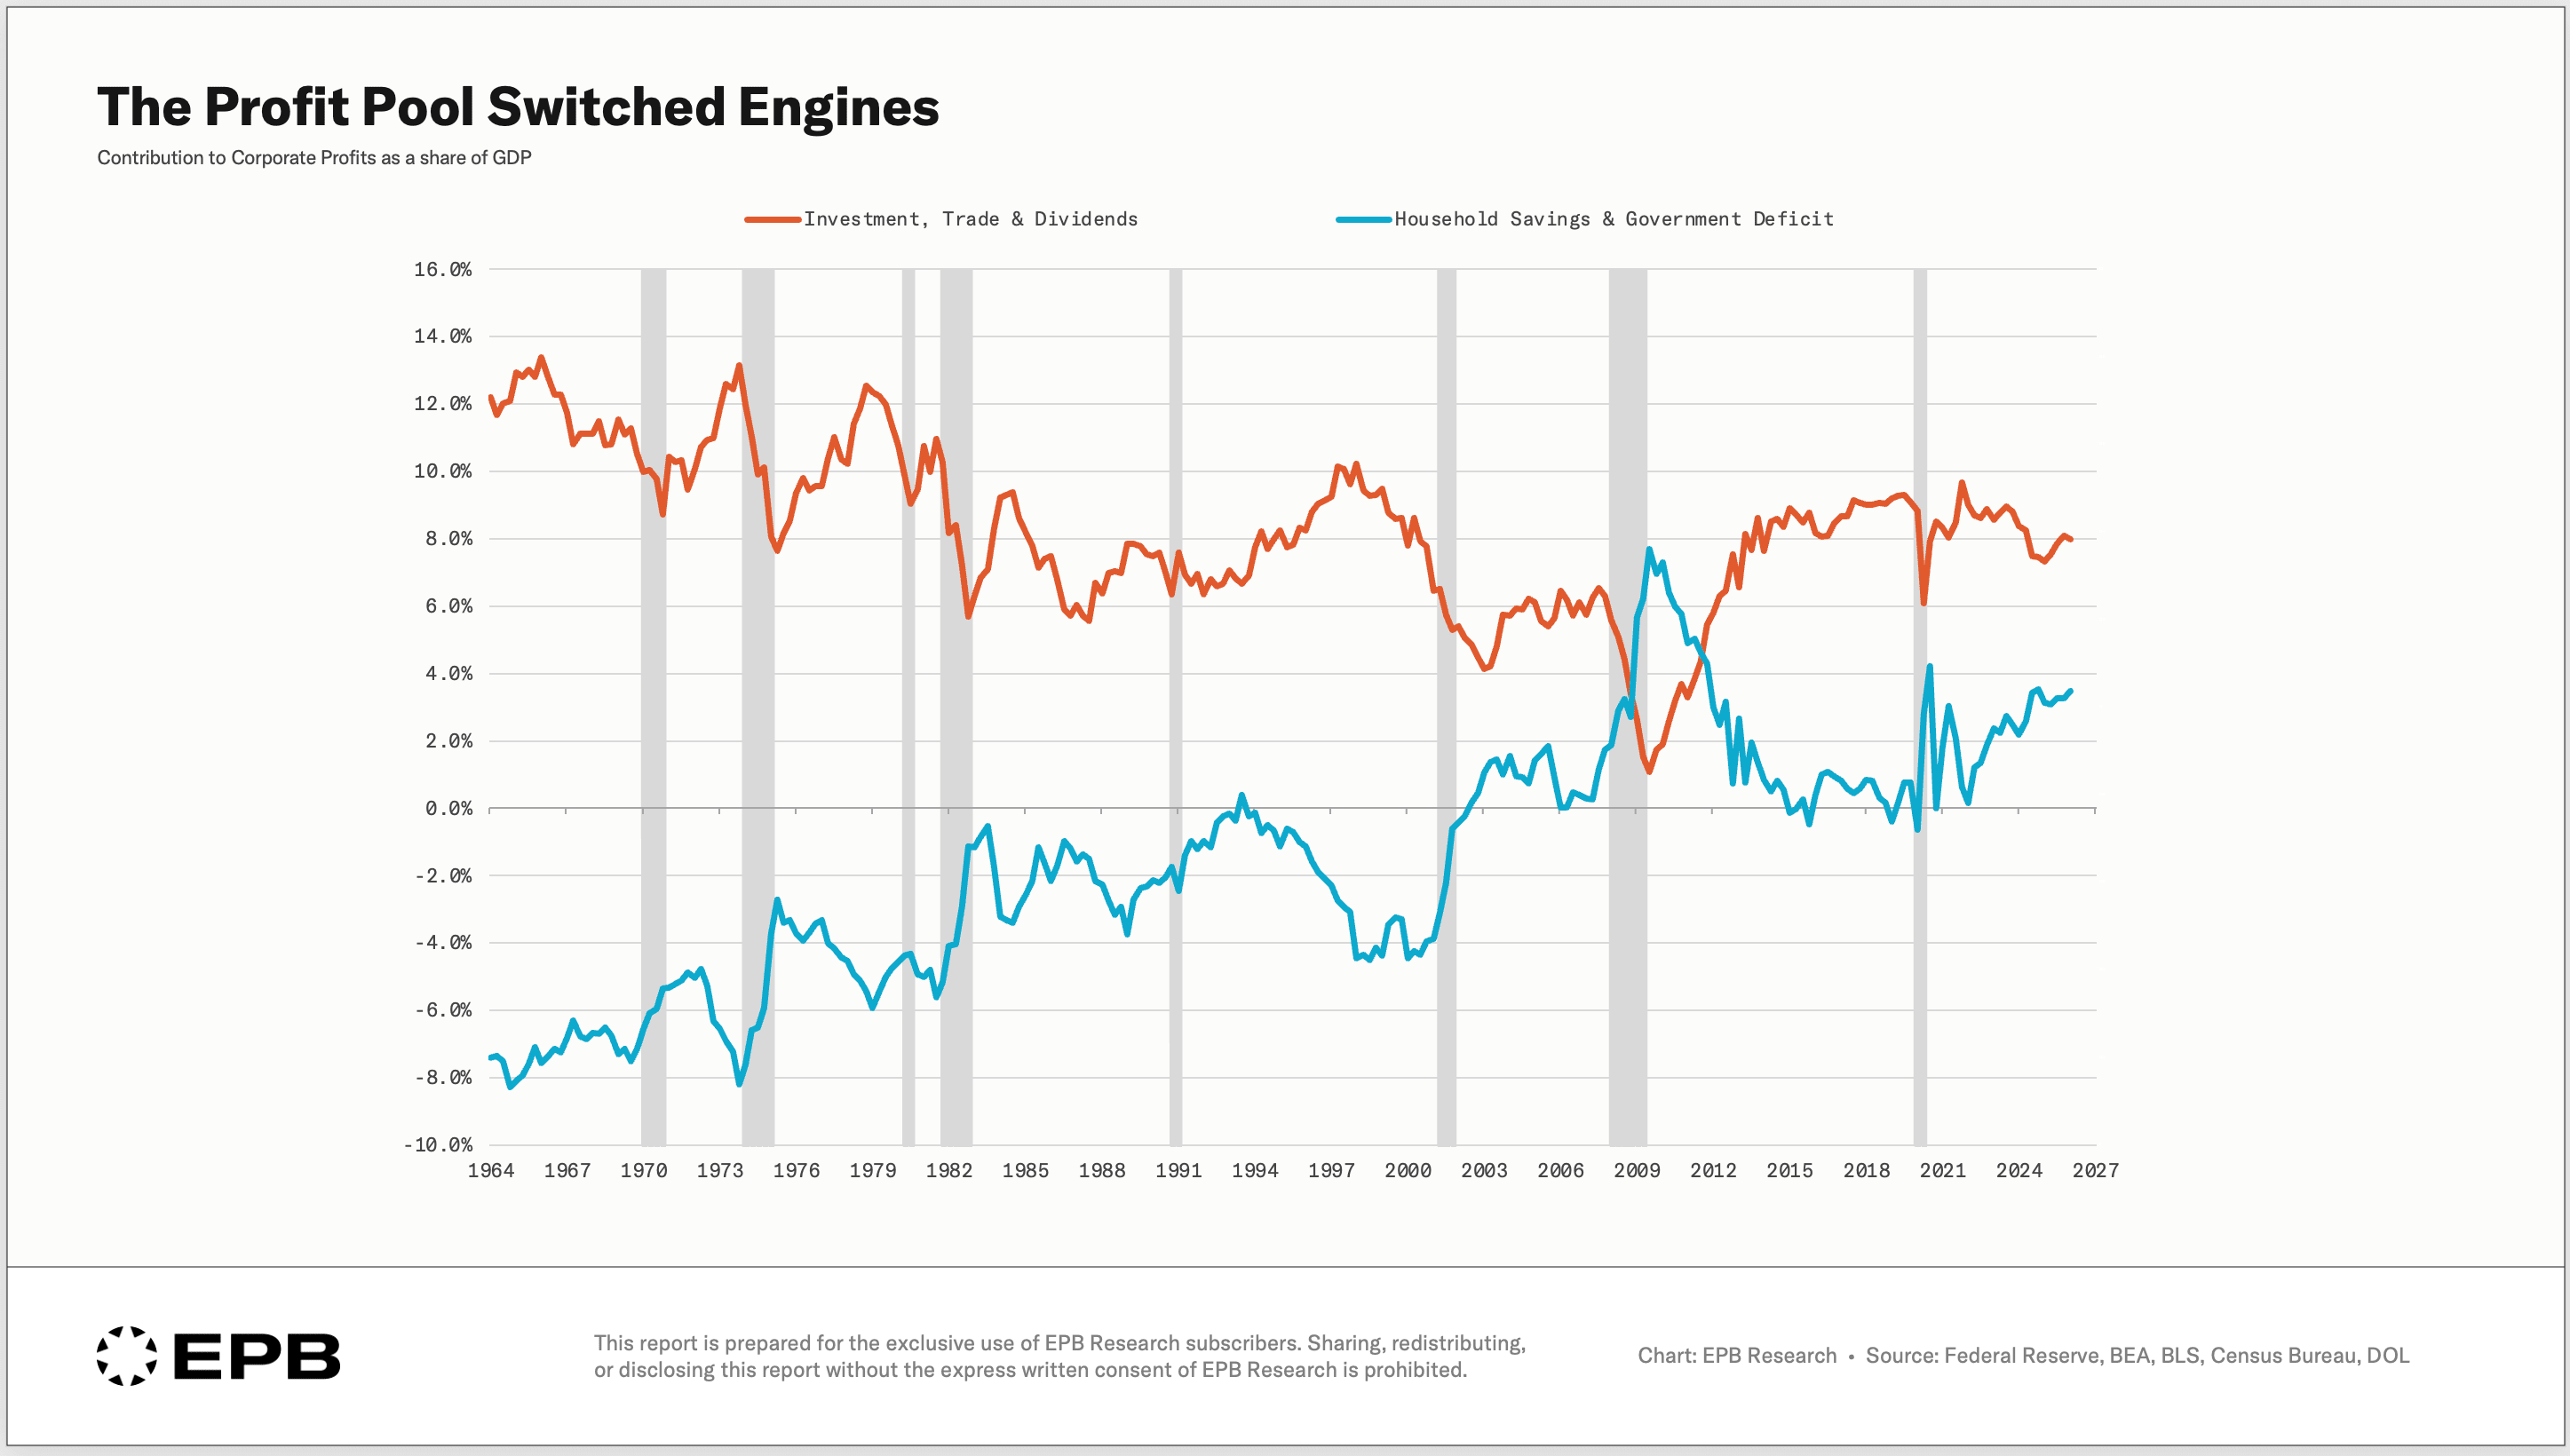
In the decades following World War II, private business investment played a larger role in supporting aggregate corporate profits.
Government budgets were generally closer to balance, so government deficits provided less persistent support to the profit pool.
Households also saved a much larger share of their income, often close to 10%.
In the 1960s, for example, private investment, trade and dividends added 10%-12% as a % of GDP to the profit pool while government budget and household savings subtracted 6%-8%.
Today, the composition is materially different. Business investment still contributes, but government deficits have become a much larger source of support, while lower household saving has reduced an important drain.
In many years since the 2008 financial crisis, the government deficit has been one of the largest sources of support for aggregate corporate profits.
This is the key theme:
Record corporate profits and large government deficits are connected through the national accounts.
They are not two completely independent economic stories.
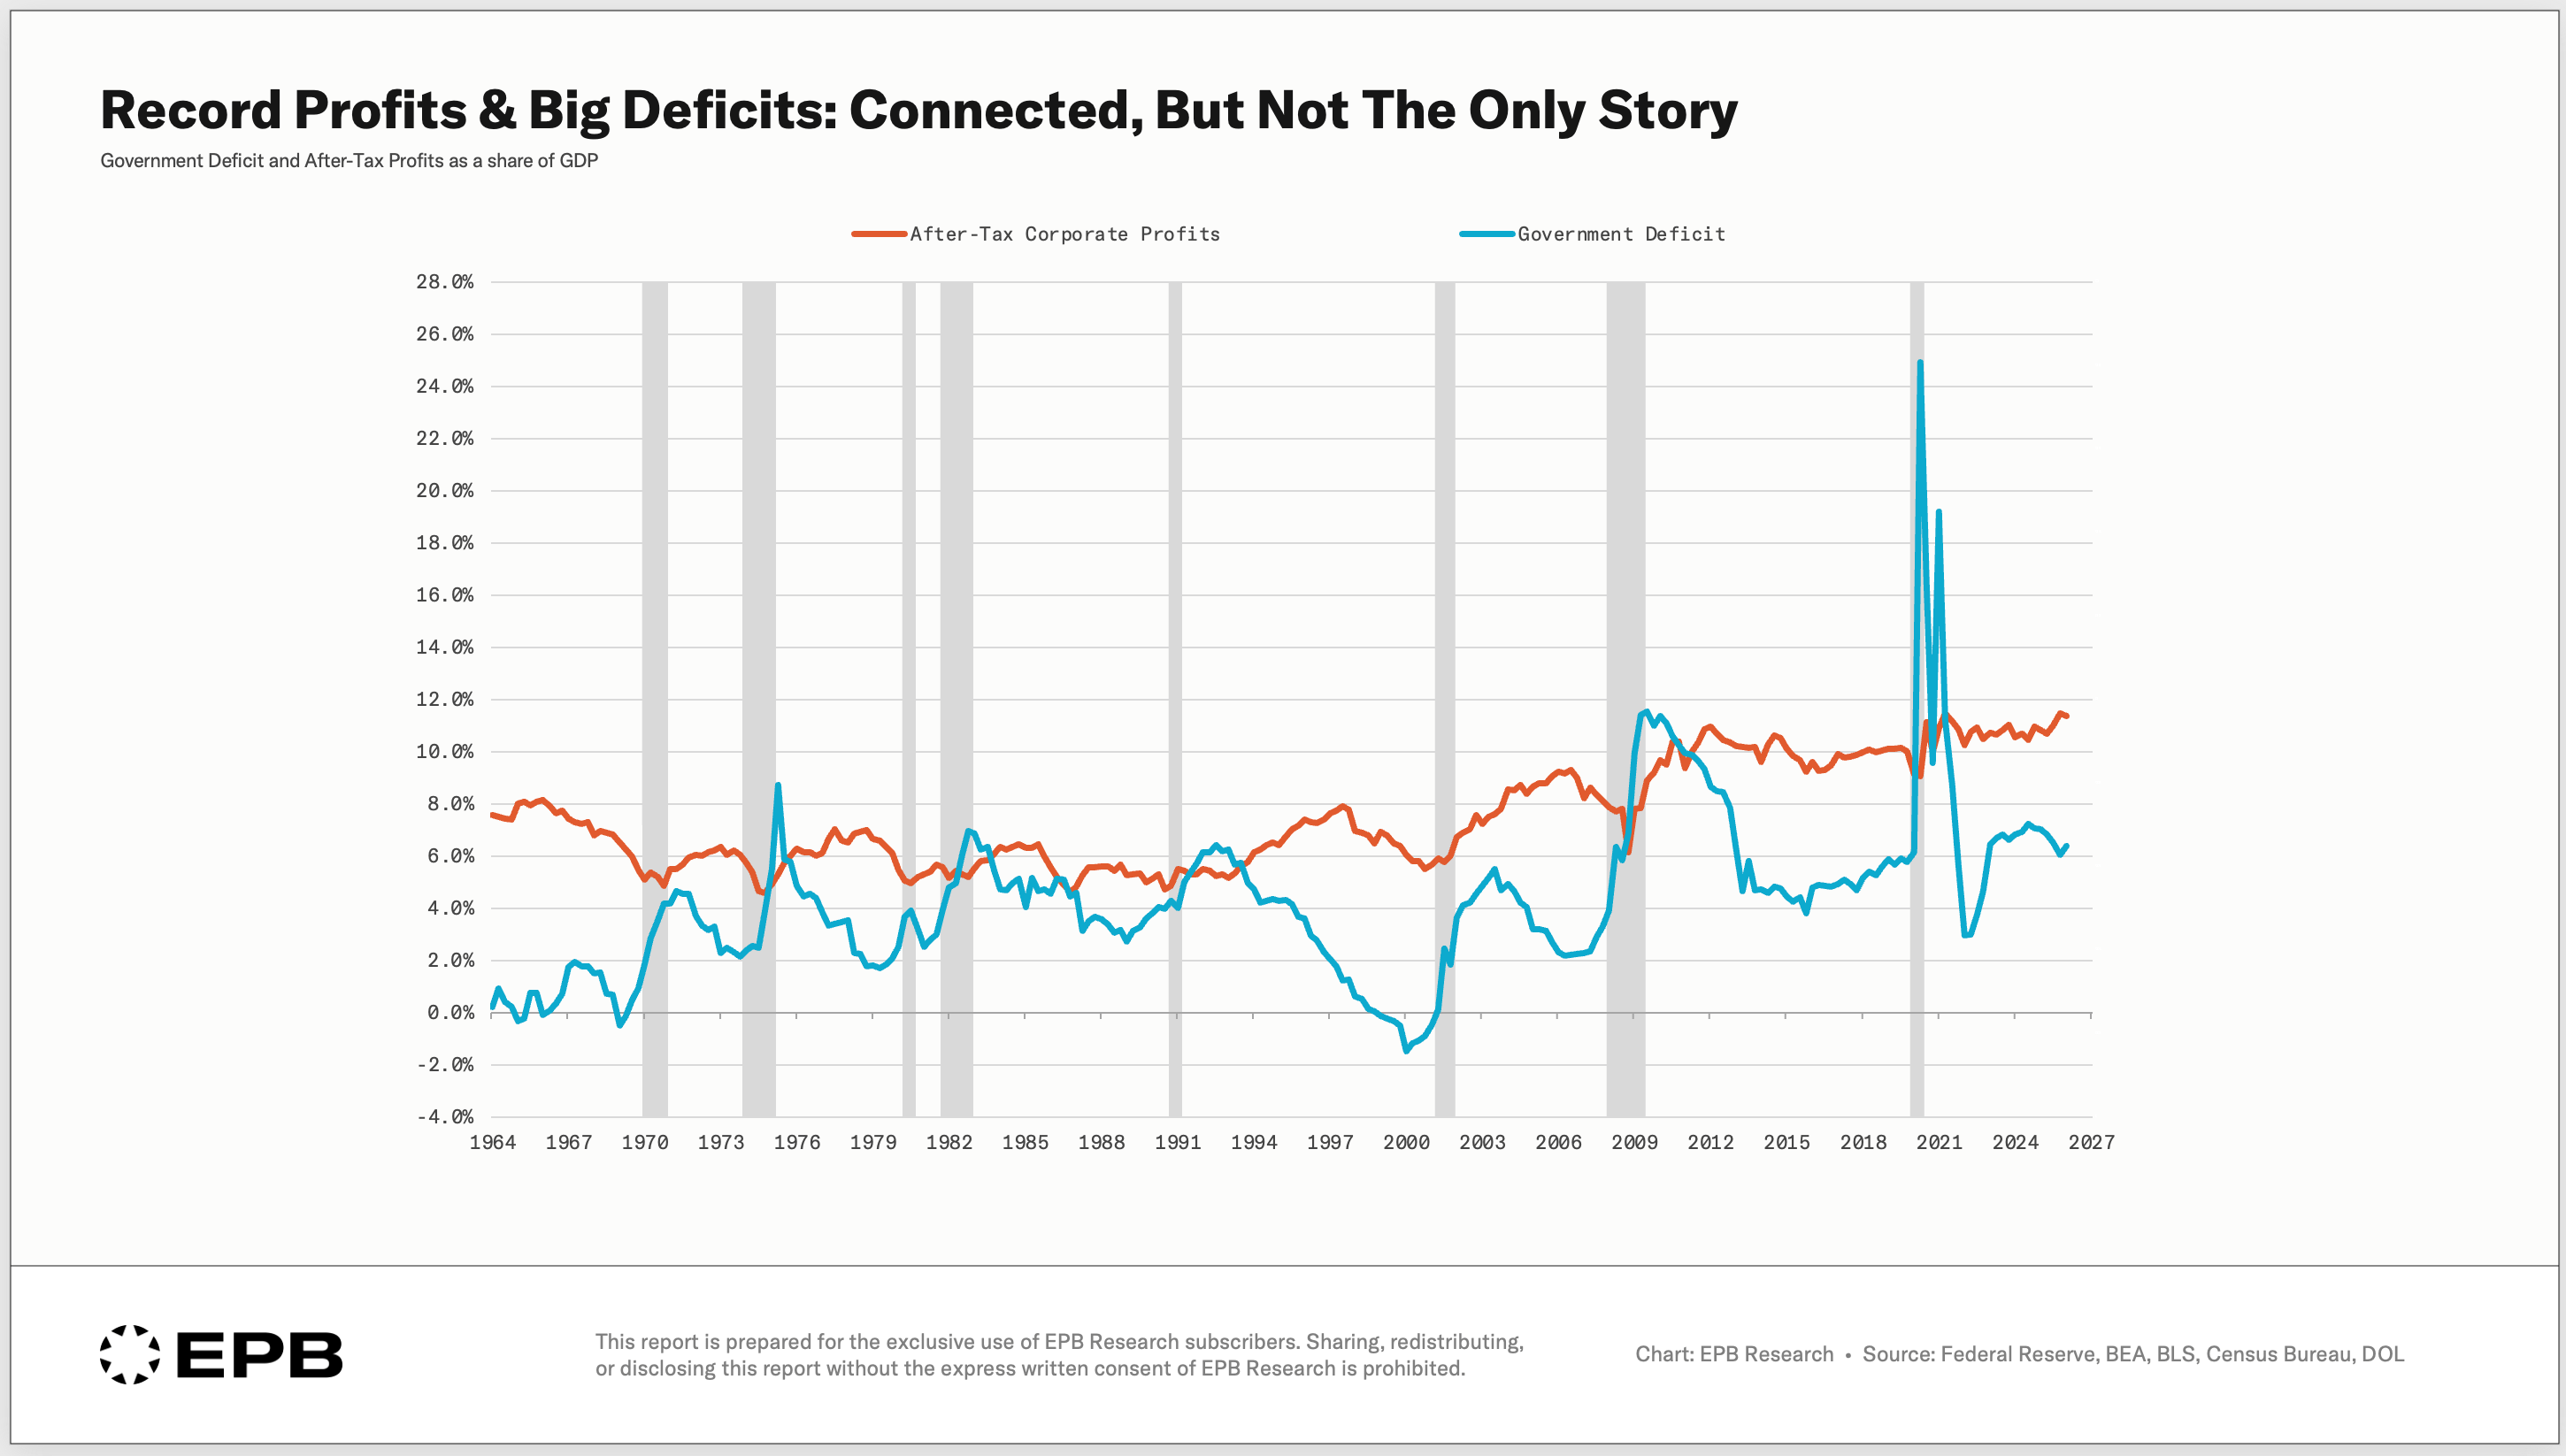
This does not mean government deficits are the only reason profits are high.
It means deficits have become an increasingly important part of the accounting foundation supporting the aggregate profit pool.
The 2008 Test
No single component guarantees the outcome, and 2008 proves it. The federal deficit widened substantially in response to the crisis, which added support to the profit pool.
But the larger deficit did not produce higher profit margins.
Why?
Because private investment fell sharply and household saving rose.
In 2006, profit margins were roughly 16%. The household saving rate was 2% to 3%, and the budget deficit was about 2% of GDP.
By 2009, the budget deficit had widened to approximately 12% of GDP, but profit margins were still roughly 16%. The increase in the deficit was offset by a sharp rise in household saving and a collapse in net business investment.
The identity nets all of those flows together. It explains why a much larger deficit did not guarantee higher profit margins.
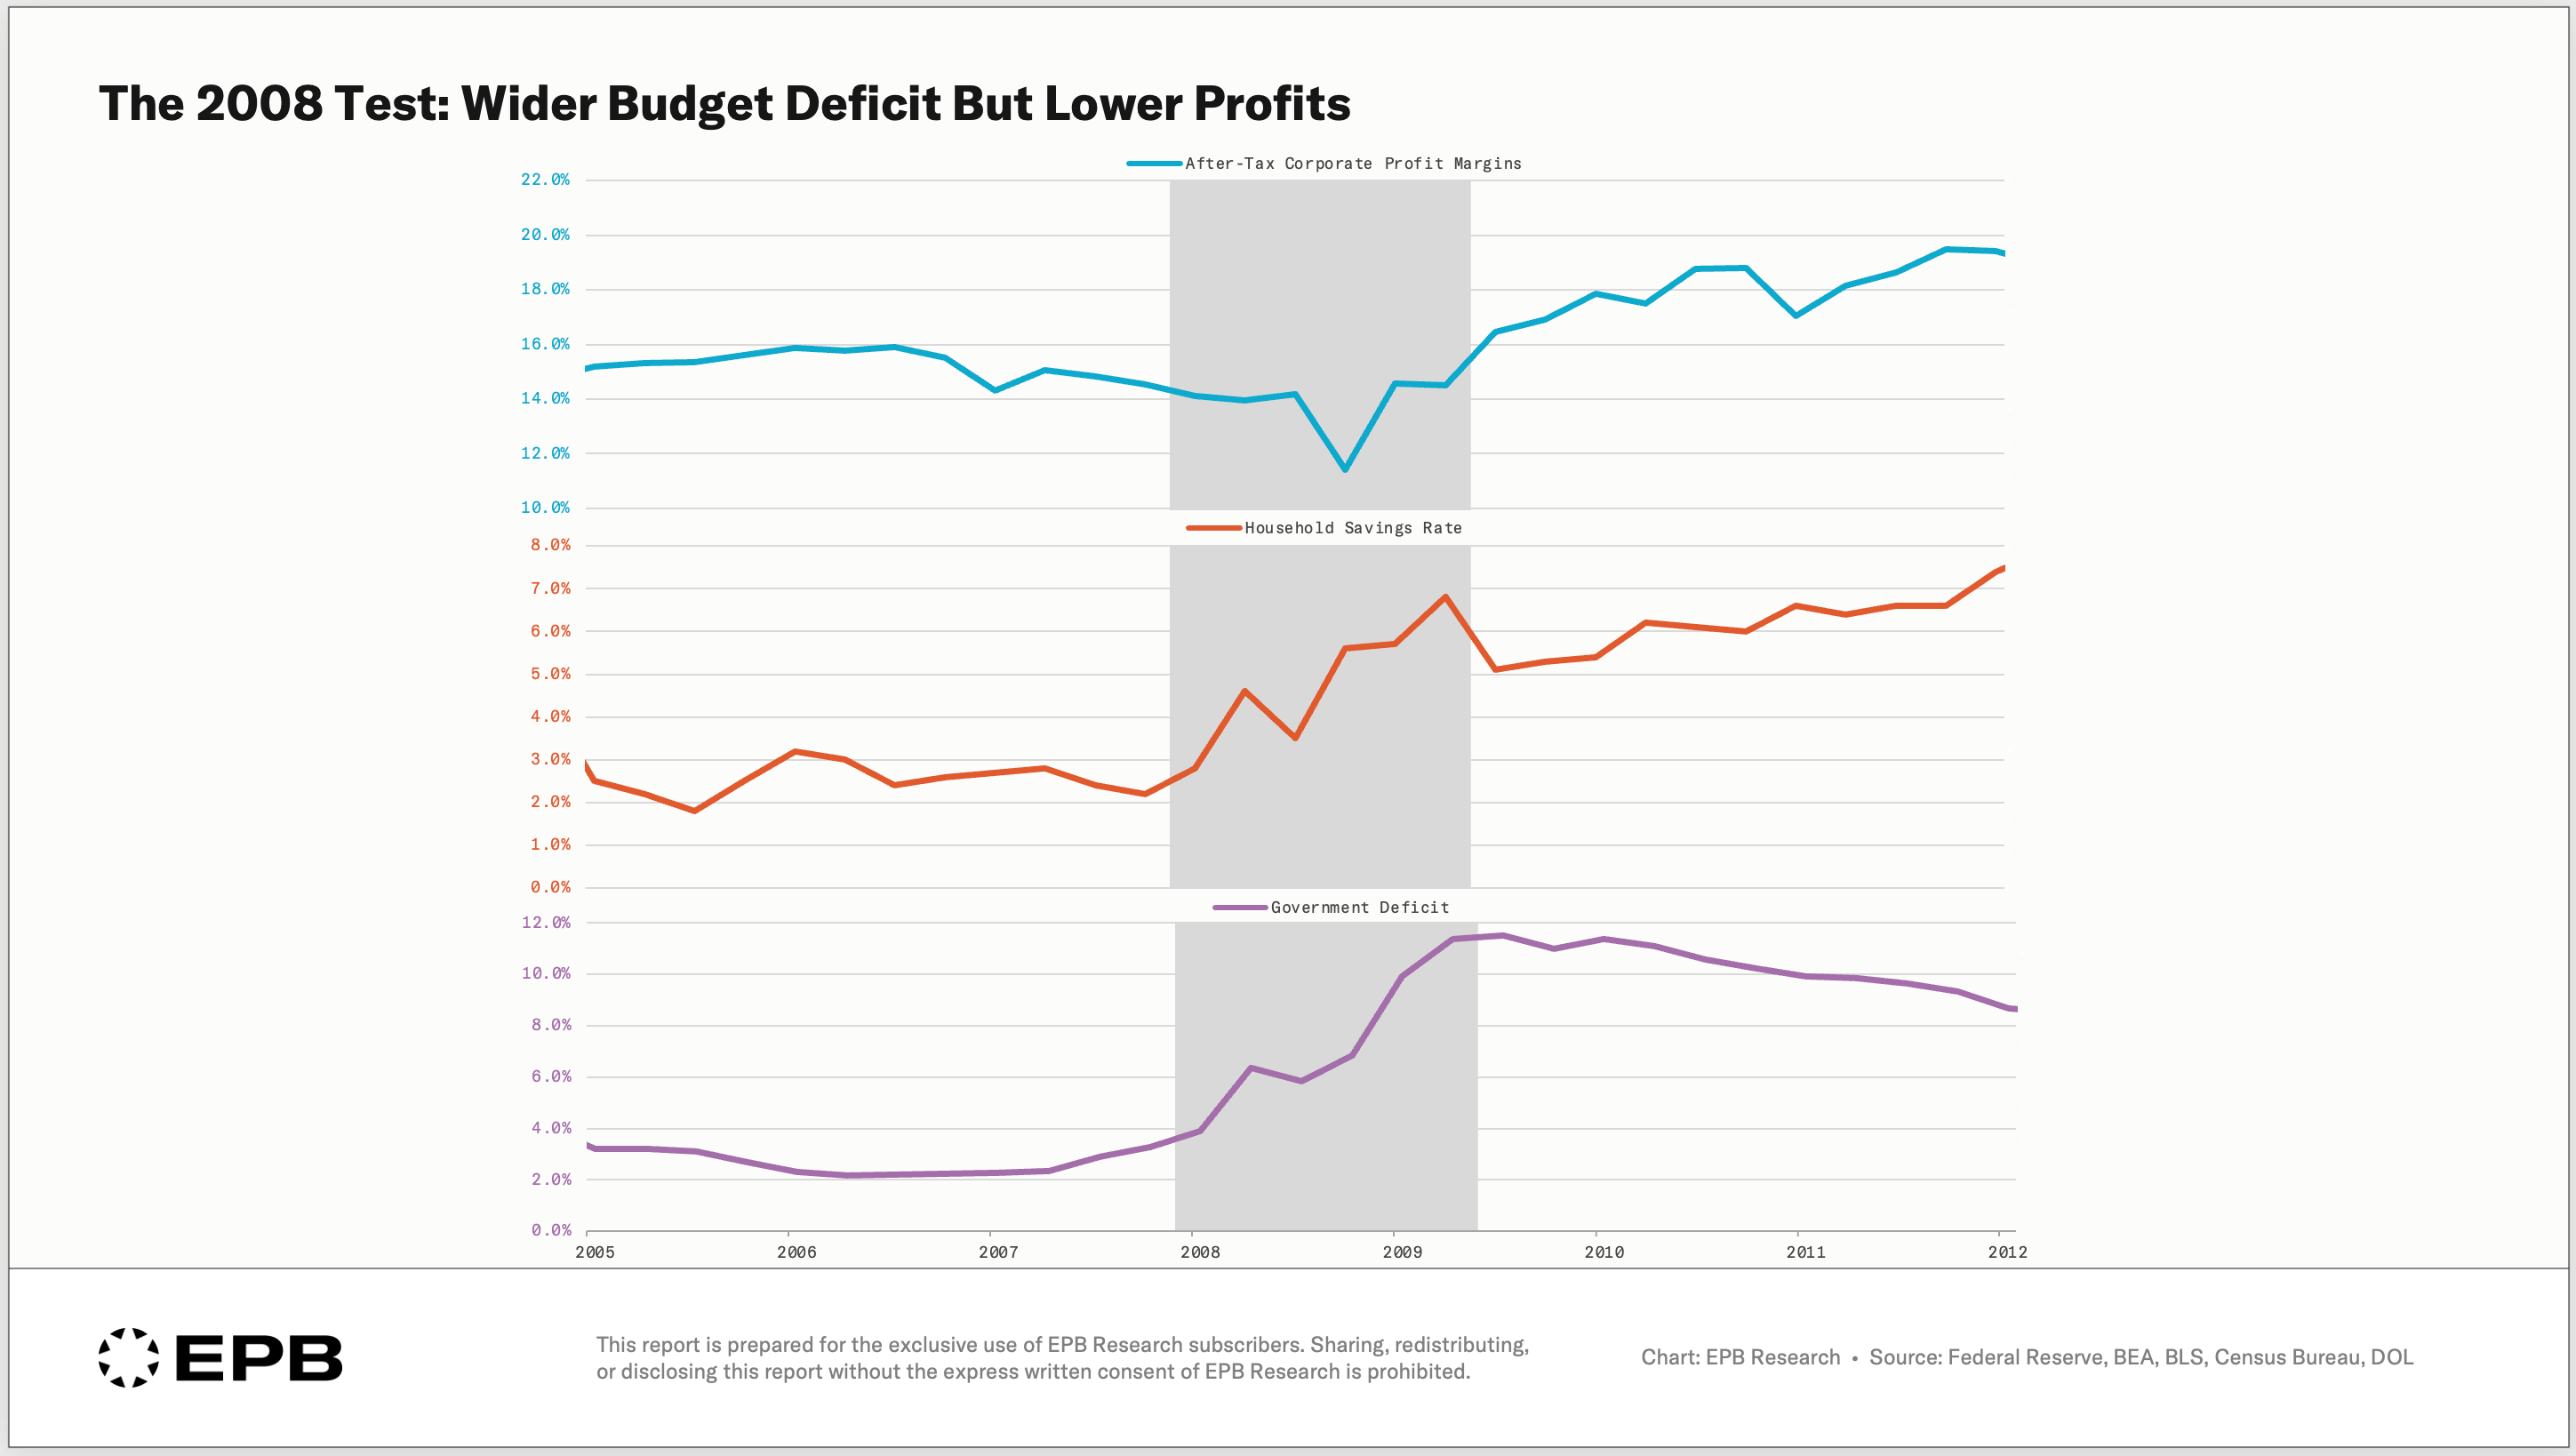
It also demonstrates why investors should be skeptical of any forecast that relies on only one component of the equation.
Are Deficit-Supported Profits Sustainable?
A profit pool supported increasingly by fiscal deficits is structurally different from one supported primarily by private investment.
Private investment can expand productive capacity.
A business can build a factory, develop software, purchase equipment, or create infrastructure that generates income in the future.
Government spending can also support productive capacity, but the result depends on what the money finances.
Some government spending may support infrastructure, research, education, or other investments with long-term economic benefits.
Other spending may primarily support current consumption or redistribute existing income.
That distinction matters for the long-term improvement of the overall standard of living, but a dollar of profit is a dollar of profit in the accounting data.
What This Means for Investors
After-tax corporate profit margins have increased dramatically since the 1990s.
The Kalecki-Levy identity helps explain the long-term composition of that increase.
Government deficits have provided substantial support to the aggregate profit pool, while lower household saving has reduced an important drag.
An investor could reasonably conclude that if government deficits remain large and no other component offsets them, corporate profits may remain elevated.
That is possible.
But the argument must also acknowledge that the other components can change.
Households may save more. Businesses may invest less.
A recession can move several components at once.
That is why the identity is extremely useful for understanding structural economic trends, but much less useful for timing business-cycle turning points.
It explains the long-term structure beneath the profit pool.
It does not tell you when employment conditions are deteriorating, when households are becoming more cautious, or when the economy is approaching a recession.
Those questions require a different analytical framework.
They require monitoring the cyclical parts of the economy that change direction before the broad headline data.
That is the primary work at EPB Research.
Every Sunday, I analyze the small group of business-cycle indicators that helps determine whether economic growth is accelerating, slowing, or moving toward recession.
The goal is not to predict every movement in the stock market.
The goal is to understand where the economy is in the business cycle and to identify when the underlying direction is changing. The change occurs in a narrow sliver of the economy, usually just three sectors of GDP.
I put together a map of the GDP accounts, including these smaller slices of the economy where the big swings occur. You can grab the free Breaking Down GDP guide, along with the free EPB Research Sunday newsletter, using the link below.
The framework will show you how to separate slow-moving structural trends from the cyclical forces that influence growth, profits, employment, and financial markets over the next several quarters.
If this article helped you understand where aggregate corporate profits come from, share it with someone who follows the economy or financial markets.