

The Role of Consumer Spending in the Business Cycle: Confirmation, Not Prediction
A breakdown of how personal consumption fits into the business cycle sequence and the EPB Four Economy Framework

Most investors and financial pundits are coached to “watch the consumer” as the most important signal of economic health. After all, consumer spending is two-thirds of the total gross domestic product.
“The consumer is still healthy” is perhaps the most overused phrase in financial TV, and this type of analysis leads to extremely misguided conclusions - particularly the assertion that the consumer drives the business cycle.
In reality, personal consumption or consumer spending is a coincident-to-lagging indicator, reacting to broader economic forces that are already in motion rather than anticipating the changes that investors seek to front-run.
In this post, we’ll break down consumer spending into it’s most cyclical and most lagging components, explore how each segment behaves ahead of recessionary periods and highlight where each segment of consumption fits within the EPB Four Economy Framework, helping you understand what consumer spending patterns can and cannot tell you about the trajectory of the business cycle.
Breakdown of Personal Consumption
Total personal consumption represents nearly 70% of US GDP, approximating $20.5 trillion.
Personal consumption is split between goods consumption and services consumption. Goods consumption is roughly $6.4 trillion, and services consumption is about $14.2 trillion.
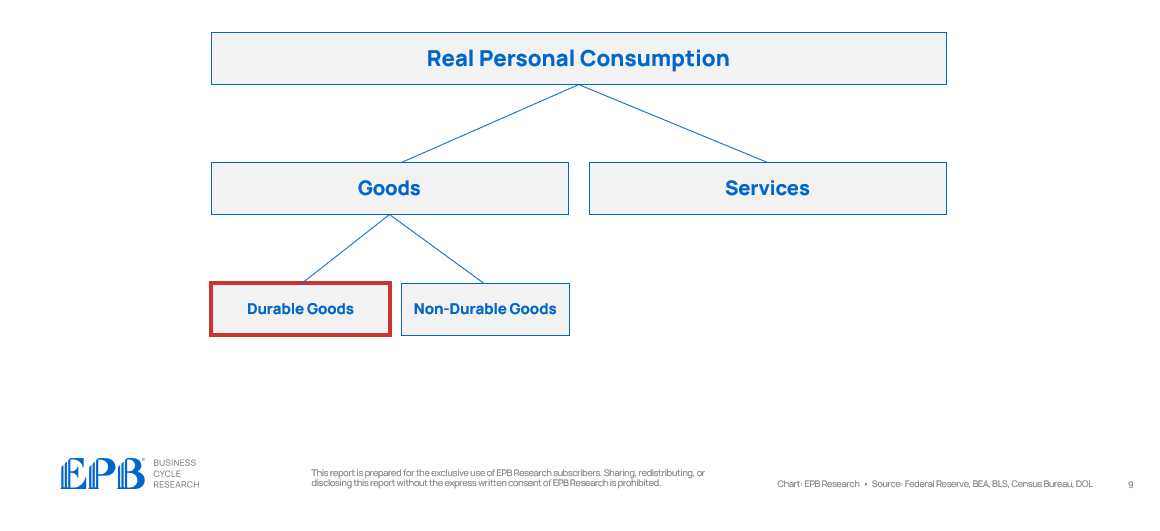
Goods can be split once more into durable goods and non-durable goods. Durable goods are $2.2 trillion, and non-durable goods are about $4.2 trillion.
While services consumption is clearly the largest segment by raw dollars, it is the least volatile, least influenced by changes in interest rates, and is generally the least discretionary portion of the consumer spending basket.
Durable goods, the smallest segment, is the most volatile, most sensitive to interest rates, and is the most discretionary portion of consumer spending - linked heavily to housing-related items and vehicles.
EPB Four Economy Framework
In the EPB Four Economy Framework, we sequence incoming economic data into four buckets based on the order of operations in which data contracts ahead of recessionary periods.
Durable goods consumption, the most volatile category, falls into the Cyclical Economy bucket. The Aggregate Economy encompasses the total category of all consumer spending, while the Lagging Economy comprises services consumption, the largest but least cyclical category.
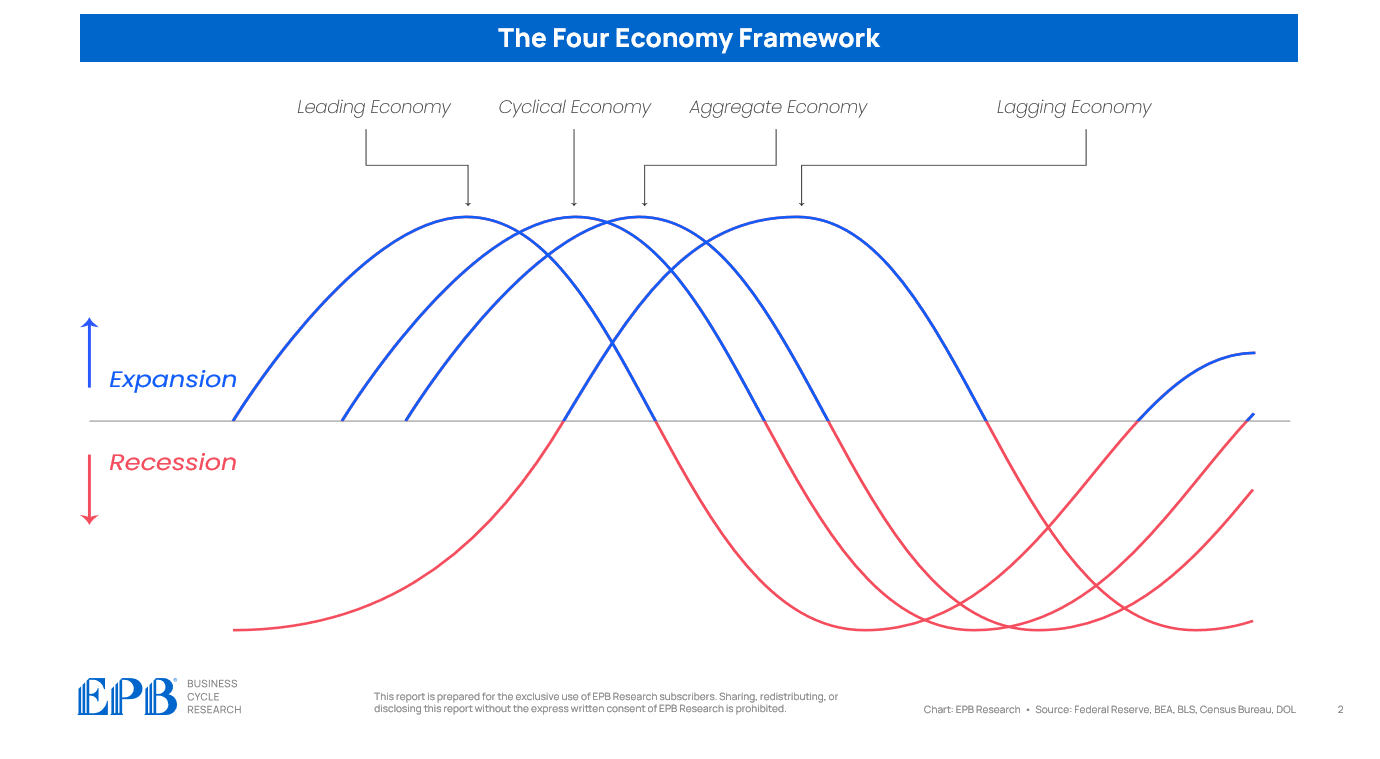
When discussing consumer spending patterns, focusing on durable goods will provide the most useful information with respect to the business cycle. The basket of total spending, and certainly the largest segment of services consumption, is not at all informative.
Spending Patterns Before & After Recessionary Periods
The following chart shows four categories of personal consumption: durable goods, goods, total consumption, and services consumption.
The chart measures the average decline of each category 6 months before the recession start date, 3 months before the recession start date, on the recession start date, as well as 3 months and 6 months after the recession start date.
For example, 6 months before a recession begins, on average, durable goods consumption is down 2.7% from peak, goods consumption is down 0.7%, total consumption is down 0.1% and services consumption is not down at all.
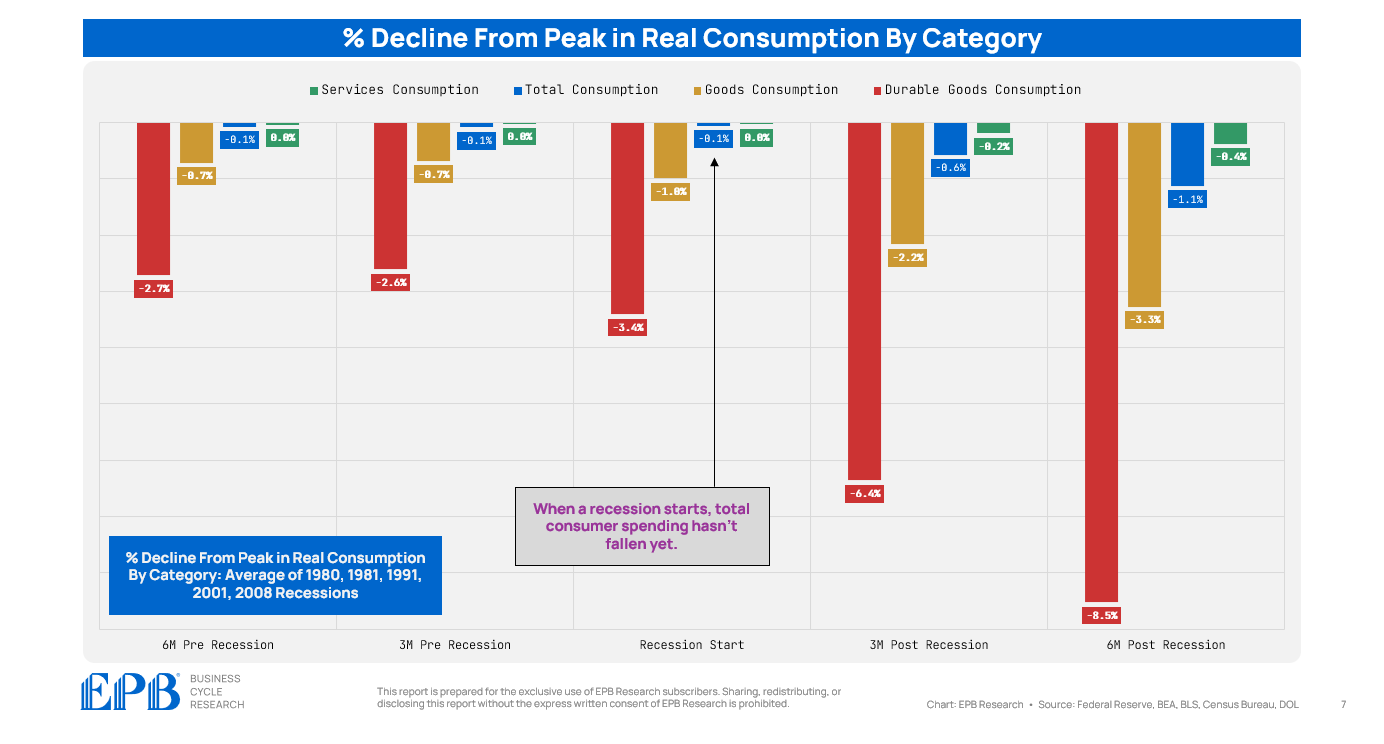
Even on the day the recession begins, while durable goods consumption is down an average of 3.4%, total consumer spending is still near peak.
Three months after a recession begins, total consumer spending is down 0.6%. Given the one-month lag in reporting, it would take four months into the recession's teeth for aggregate consumer spending data to show the first signs of weakening.
Focusing on aggregate consumer spending data is clearly an inappropriate way to analyze the health and momentum of the business cycle.
If there was one category to pay attention to, it would be durable goods consumption, which is why, at EPB Research, we break off durable goods consumption and place it into our Cyclical Economy bucket, along with other housing and manufacturing-related data.
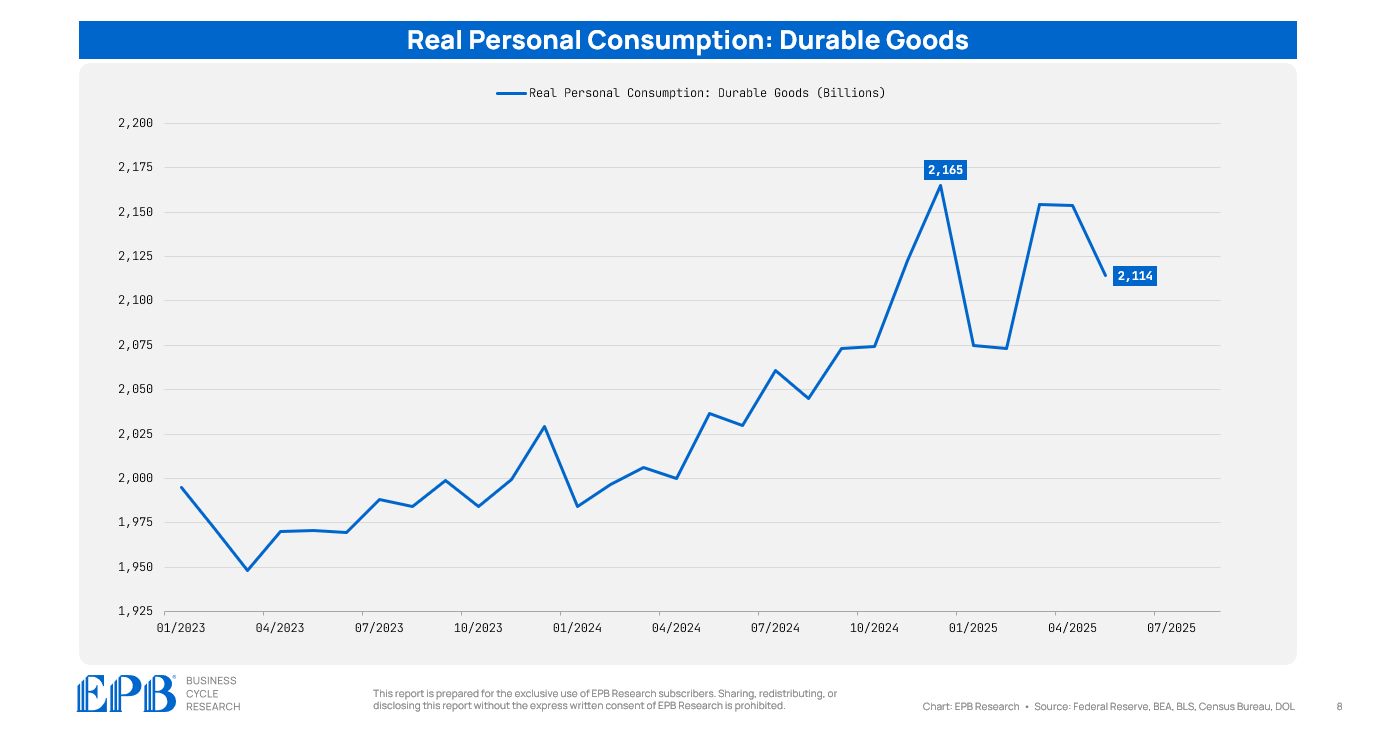
Current Consumption Trends
Currently, with data through May 2025, durable goods consumption is down 2.3% from peak, goods consumption is down 0.8%, total consumption is down 0.3% and services consumption is still at peak.
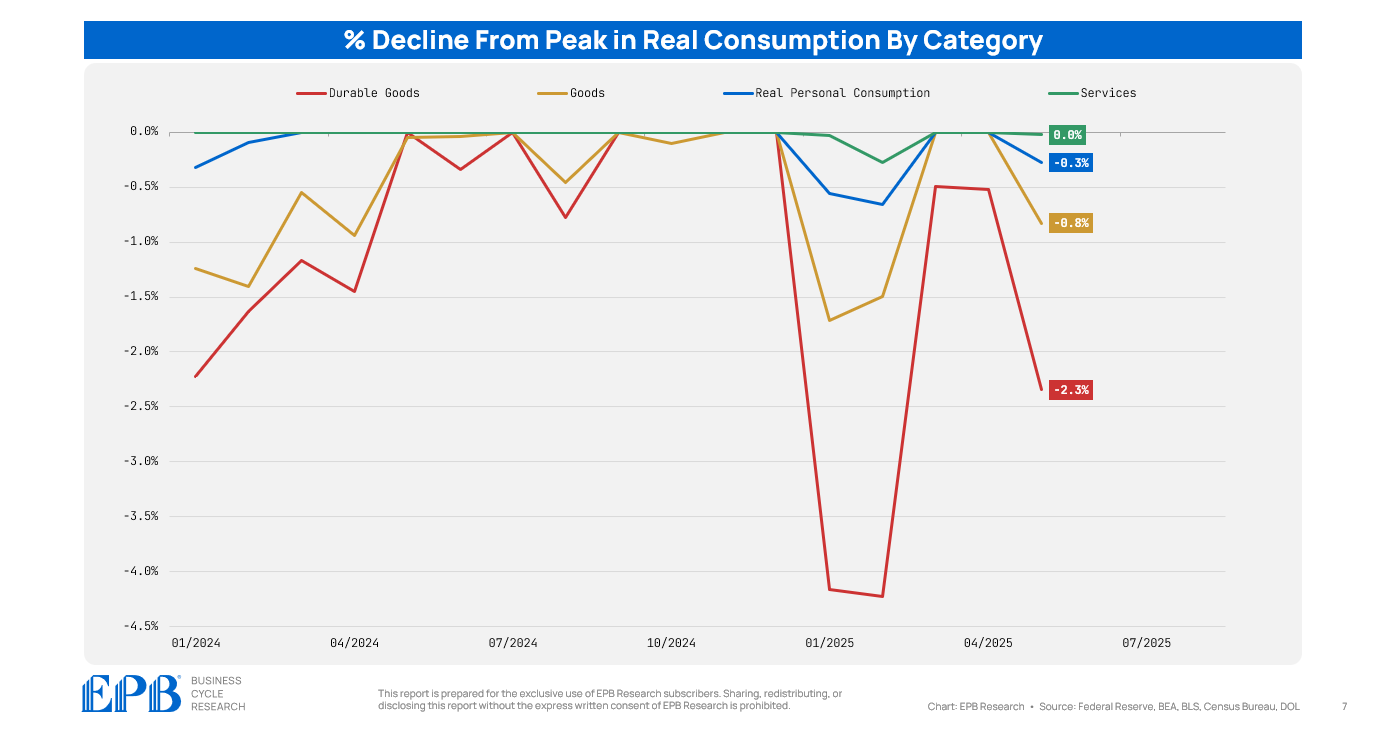
Consumption data fell strongly at the start of the year and rebounded before taking another potential leg lower.
It’s unlikely the June consumption data will show a 2.5% monthly rise in durable goods consumption, which would be required for a new peak, so durable goods consumption will likely hold below the December 2024 level.
These consumer spending trends are not extremely alarming at face value. Spending data, particularly on goods, is volatile, so ups and downs are expected.
However, grouping the durable goods spending data with other housing and manufacturing-related statistics forms a more balanced and well-rounded picture about how monetary policy impacts the cyclical areas of the economy.
Following The Sequence
Each month, in our flagship Business Cycle Trends Report, we highlight the trends across the Leading, Cyclical, and Aggregate Economy - with a detailed analysis of all the components.
The Leading Economy peaked in January 2022, followed by a peak one year later in the Cyclical Economy.
The downturn in the Cyclical Economy remains modest, and thus, the Aggregate Economy continues to march along without a visible downturn yet.
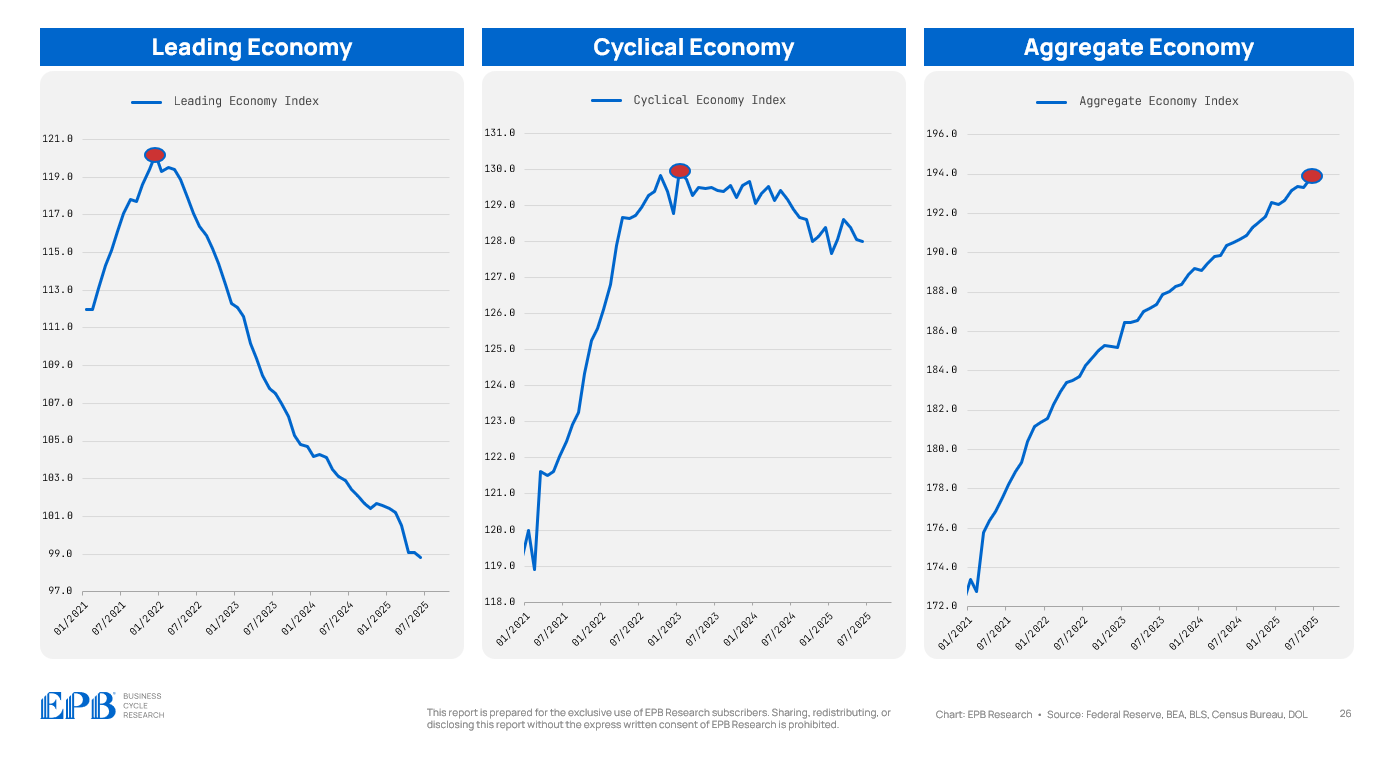
Contractionary monetary policy actions have sufficiently dented leading variables, which have spread into the Cyclical sectors, albeit mildly.
The Cyclical Economy, driven by residential construction and manufacturing activity, remains in a mild contraction. Growth is negative, but the downturn remains shallow. The Aggregate Economy is still growing at 1.7%, but the sustained weakness in upstream segments suggests downside risks remain active in the future, pending more Cyclical Economy weakness.
If you want to follow this entire sequence as it unfolds — with regular updates, animated video presentations, and forward-looking business cycle comments— you can subscribe to EPB Research below.
Although it does have a role in measuring the economic conditions, which gives investors few steps ahead of the market.
But we need to combine it with the others.
I have a theory about the expected value of assets during investment cycle and the ultimate reckoning day comes with consumption cycle.
The idea is all investment projects are often more cyclical in natural, and all of them come with expected value as to be matched with future consumption.
But inevitability, some expectations will go terribly wrong, which leads to cashflow trouble in certain economic agents first, then widespread and push interest rate up faster than it normally would.
So i can use any indicator that links to investment activities, which is cyclical factors and compare with overall consumption or anything more stable, less volatile.
More often than not, assets especially financial assets would not do well when consumption begin to rise faster than investment.
It doesn't necessarily be a recession signal, but rather to tell whether the economy is too hot or too cold.
thanks Eric. Very clear ... any timeline idea you see from here for durable goods contracting to recession levels ie -3.4% ish as per your charts? Thanks again.