

The Residential Housing Sequence
The residential construction cycle moves in the same order every time. By the time prices fall, the sequence has been running for years. This is the sequence to watch…

Home prices are the most-watched piece of housing data, but home prices are also the most useless data point for understanding where the housing cycle is headed.
Whenever someone discusses the “housing market,” the first reaction is to think about home prices. But just like the broader economy, the housing market has a sequence that involves many parts, which all move in a particular order.
There are certain early warning signs that always turn first, years before home prices move. Think of it like a row of dominoes. One falling piece knocks over another, and it’s a chain reaction.
If your process for understanding the housing market starts with what home prices are doing in your local area, you are watching the last domino in the sequence and using that to predict when the next one will fall. This plan will never help forecast what the months and quarters ahead will look like.
In this post, we will walk through the exact sequence of the housing market from building permits to construction activity to supply to employment, all the way to home prices. The exact sequence that occurred in the 2008 housing crash and is repeated throughout history. Then we’ll review what the data says about the housing market today.
To help you understand this housing sequence, we created a free step-by-step housing guide with graphs and timelines like the one above, so you can always have the resource and the sequence handy. This will massively help you interpret incoming housing data and place it in the correct order. You can download the free guide below.
The Housing Sequence
The residential housing sequence is the single most important part of the entire economy. The housing market is extremely interest rate sensitive, so it reacts strongly to changes in monetary policy, and it has an extremely high multiplier effect, meaning booms or busts in the housing market can be felt in many industries like trucking, plumbing, the manufacturing of building materials and appliances, and the list goes on and on.
The housing sequence sets off a chain reaction that is quite literally the cause of many booms and busts in the economy throughout history. Let’s walk through this sequence using the 2008 housing cycle as our reference. At the end, we’ll see what the housing sequence says about the economy today.
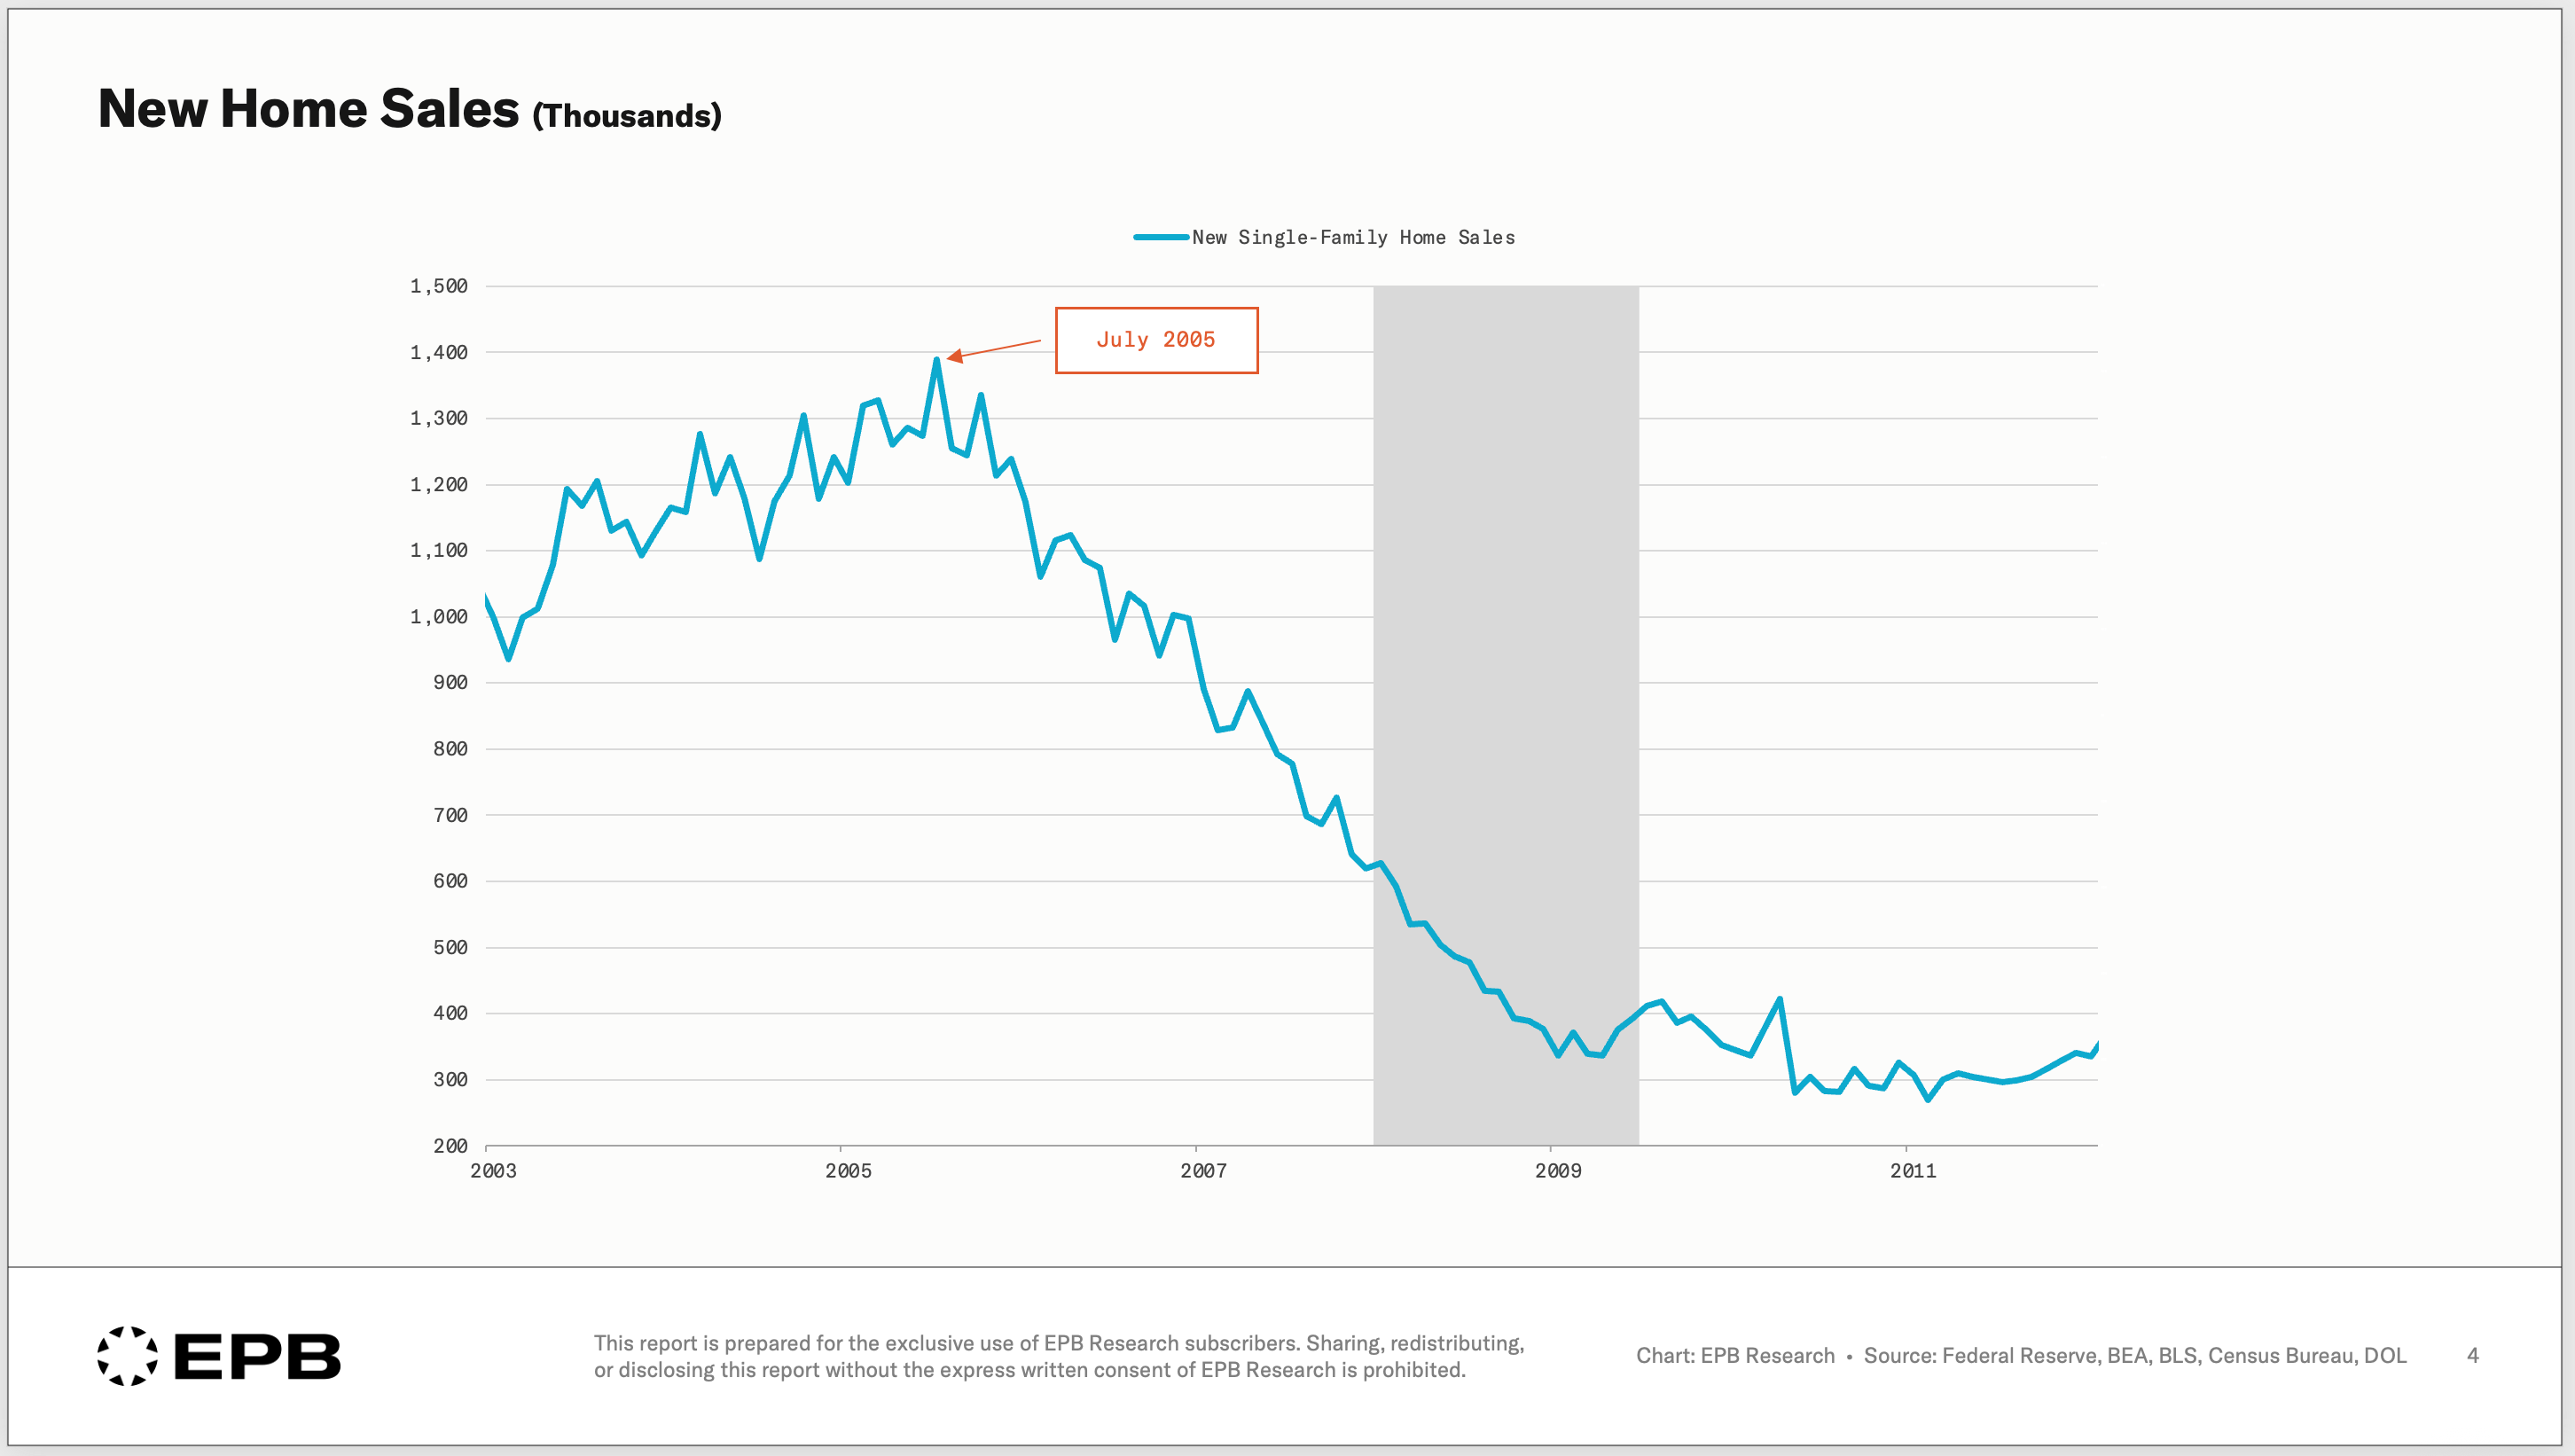
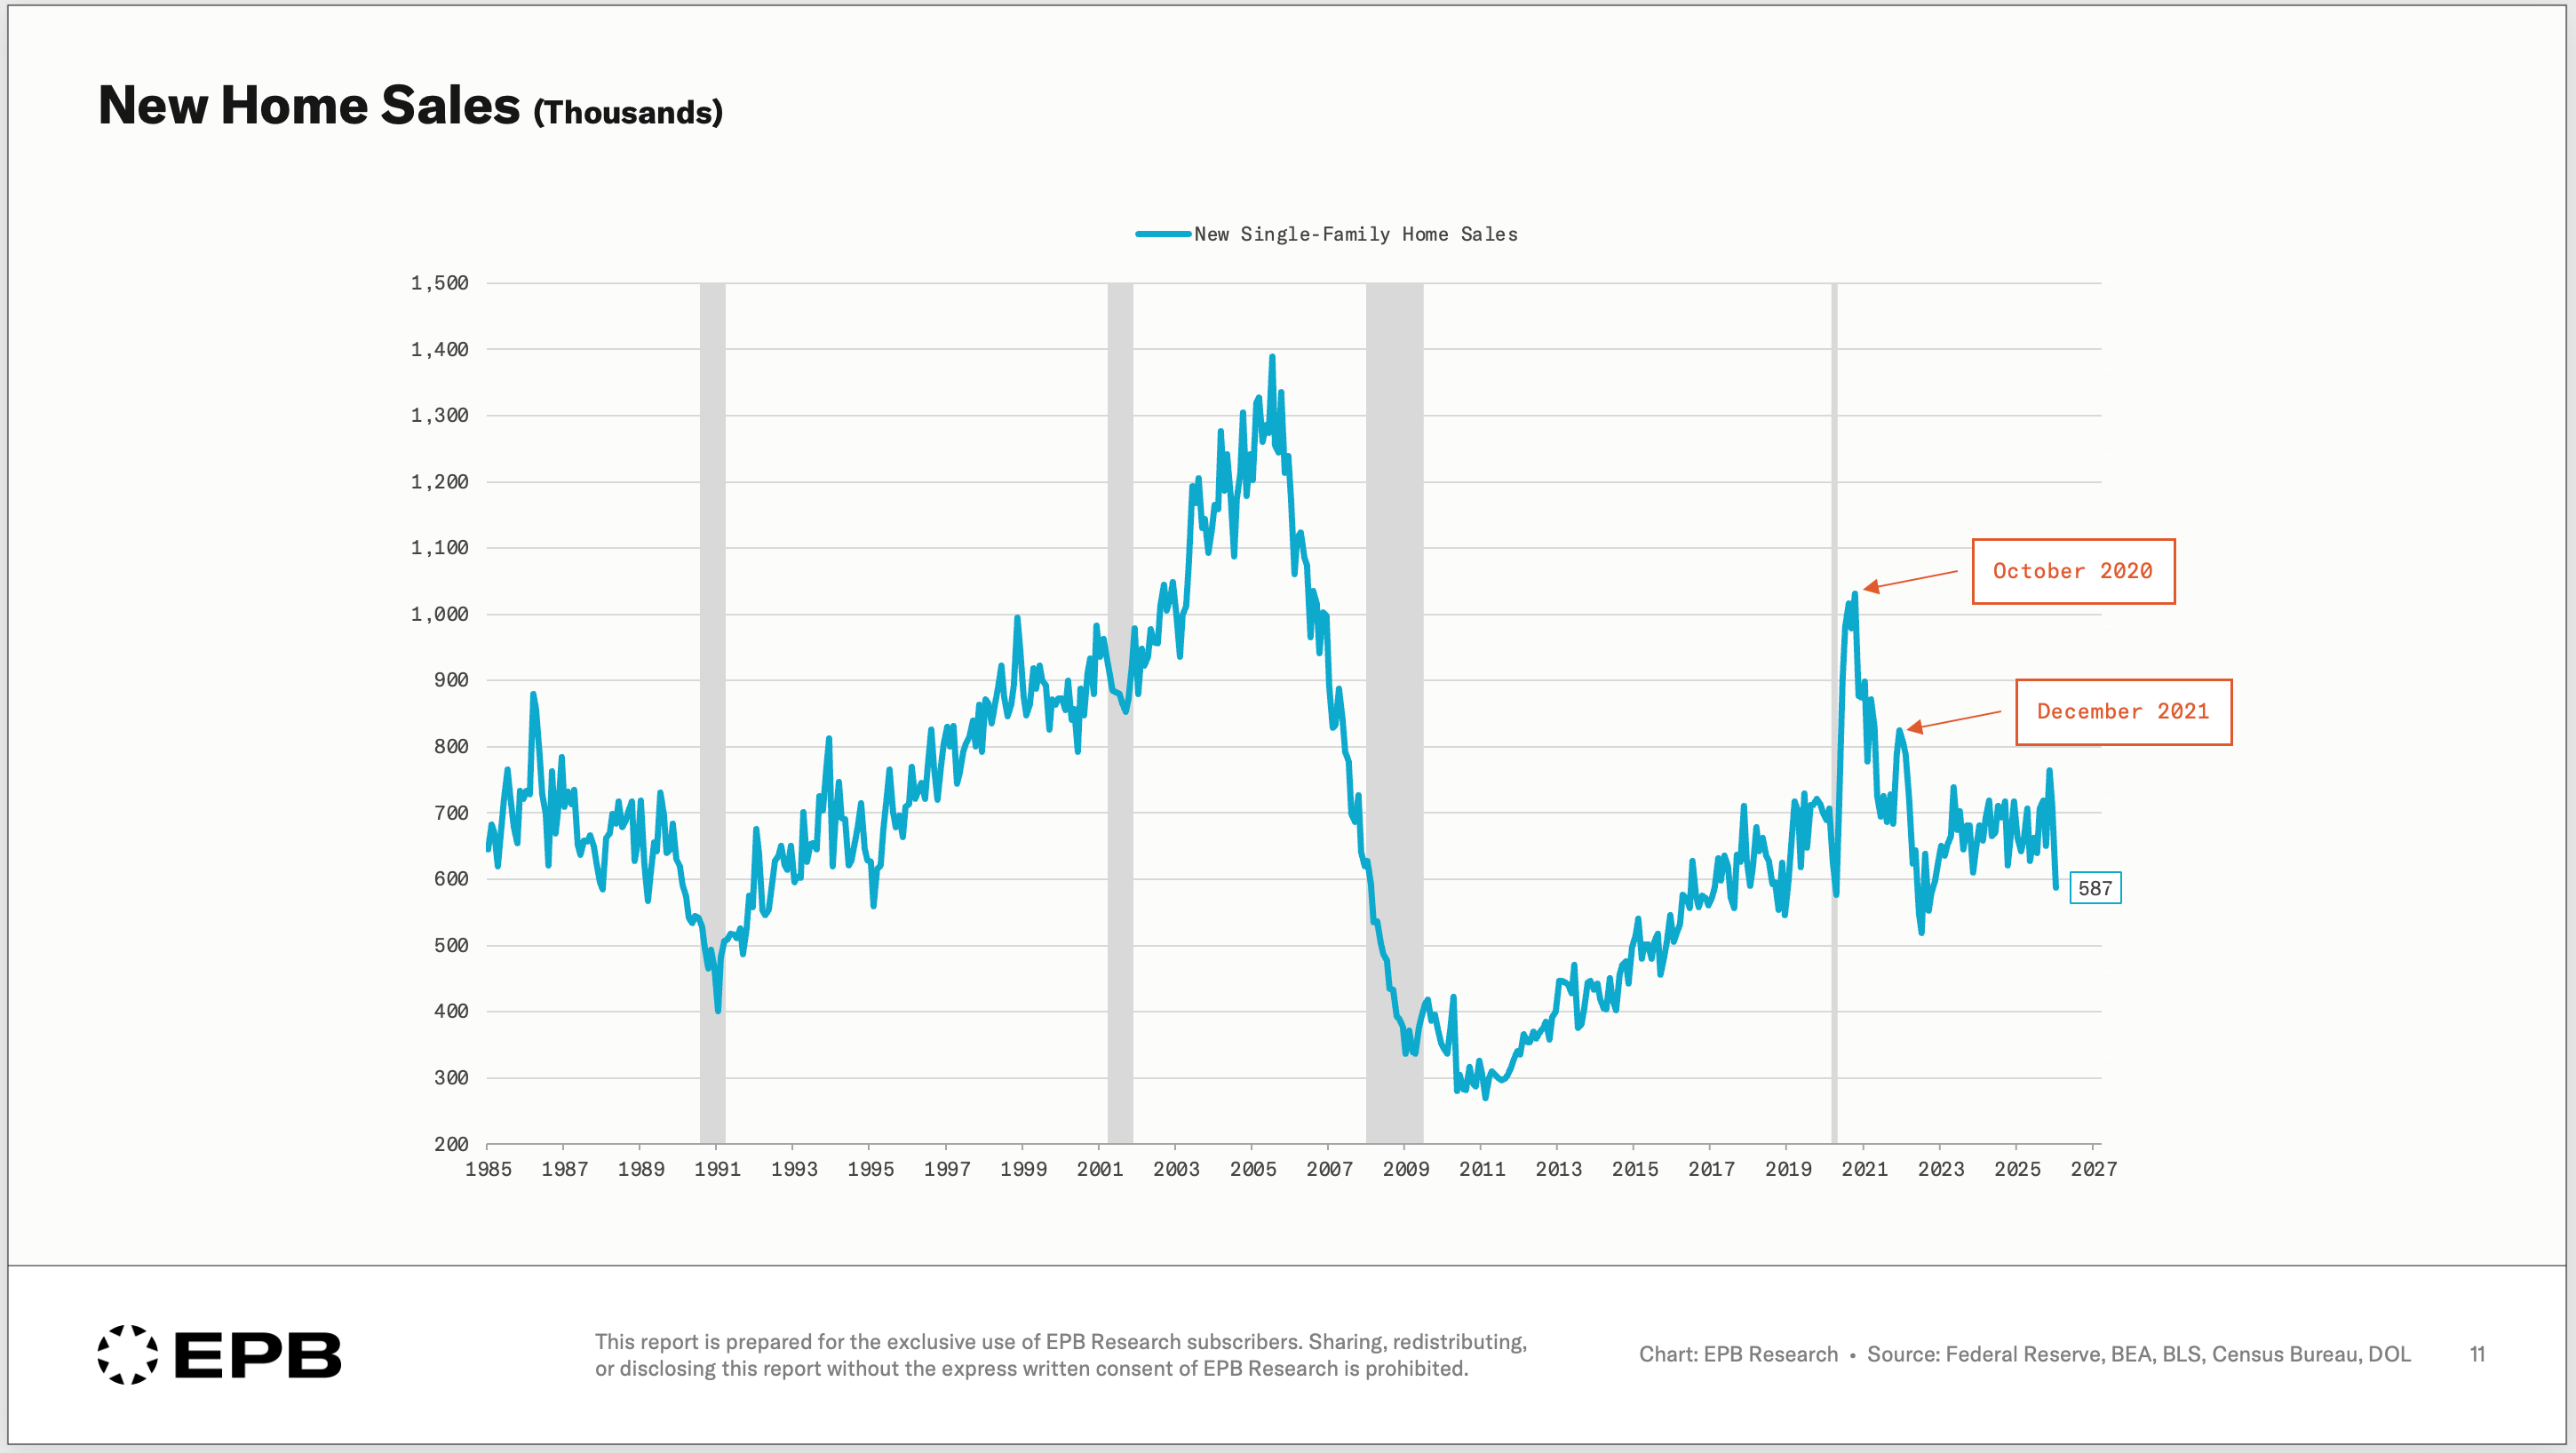
When the Fed tightens monetary policy and interest rates rise, the housing market feels it almost immediately. But not through prices. The first response shows up in the volume of new home sales.
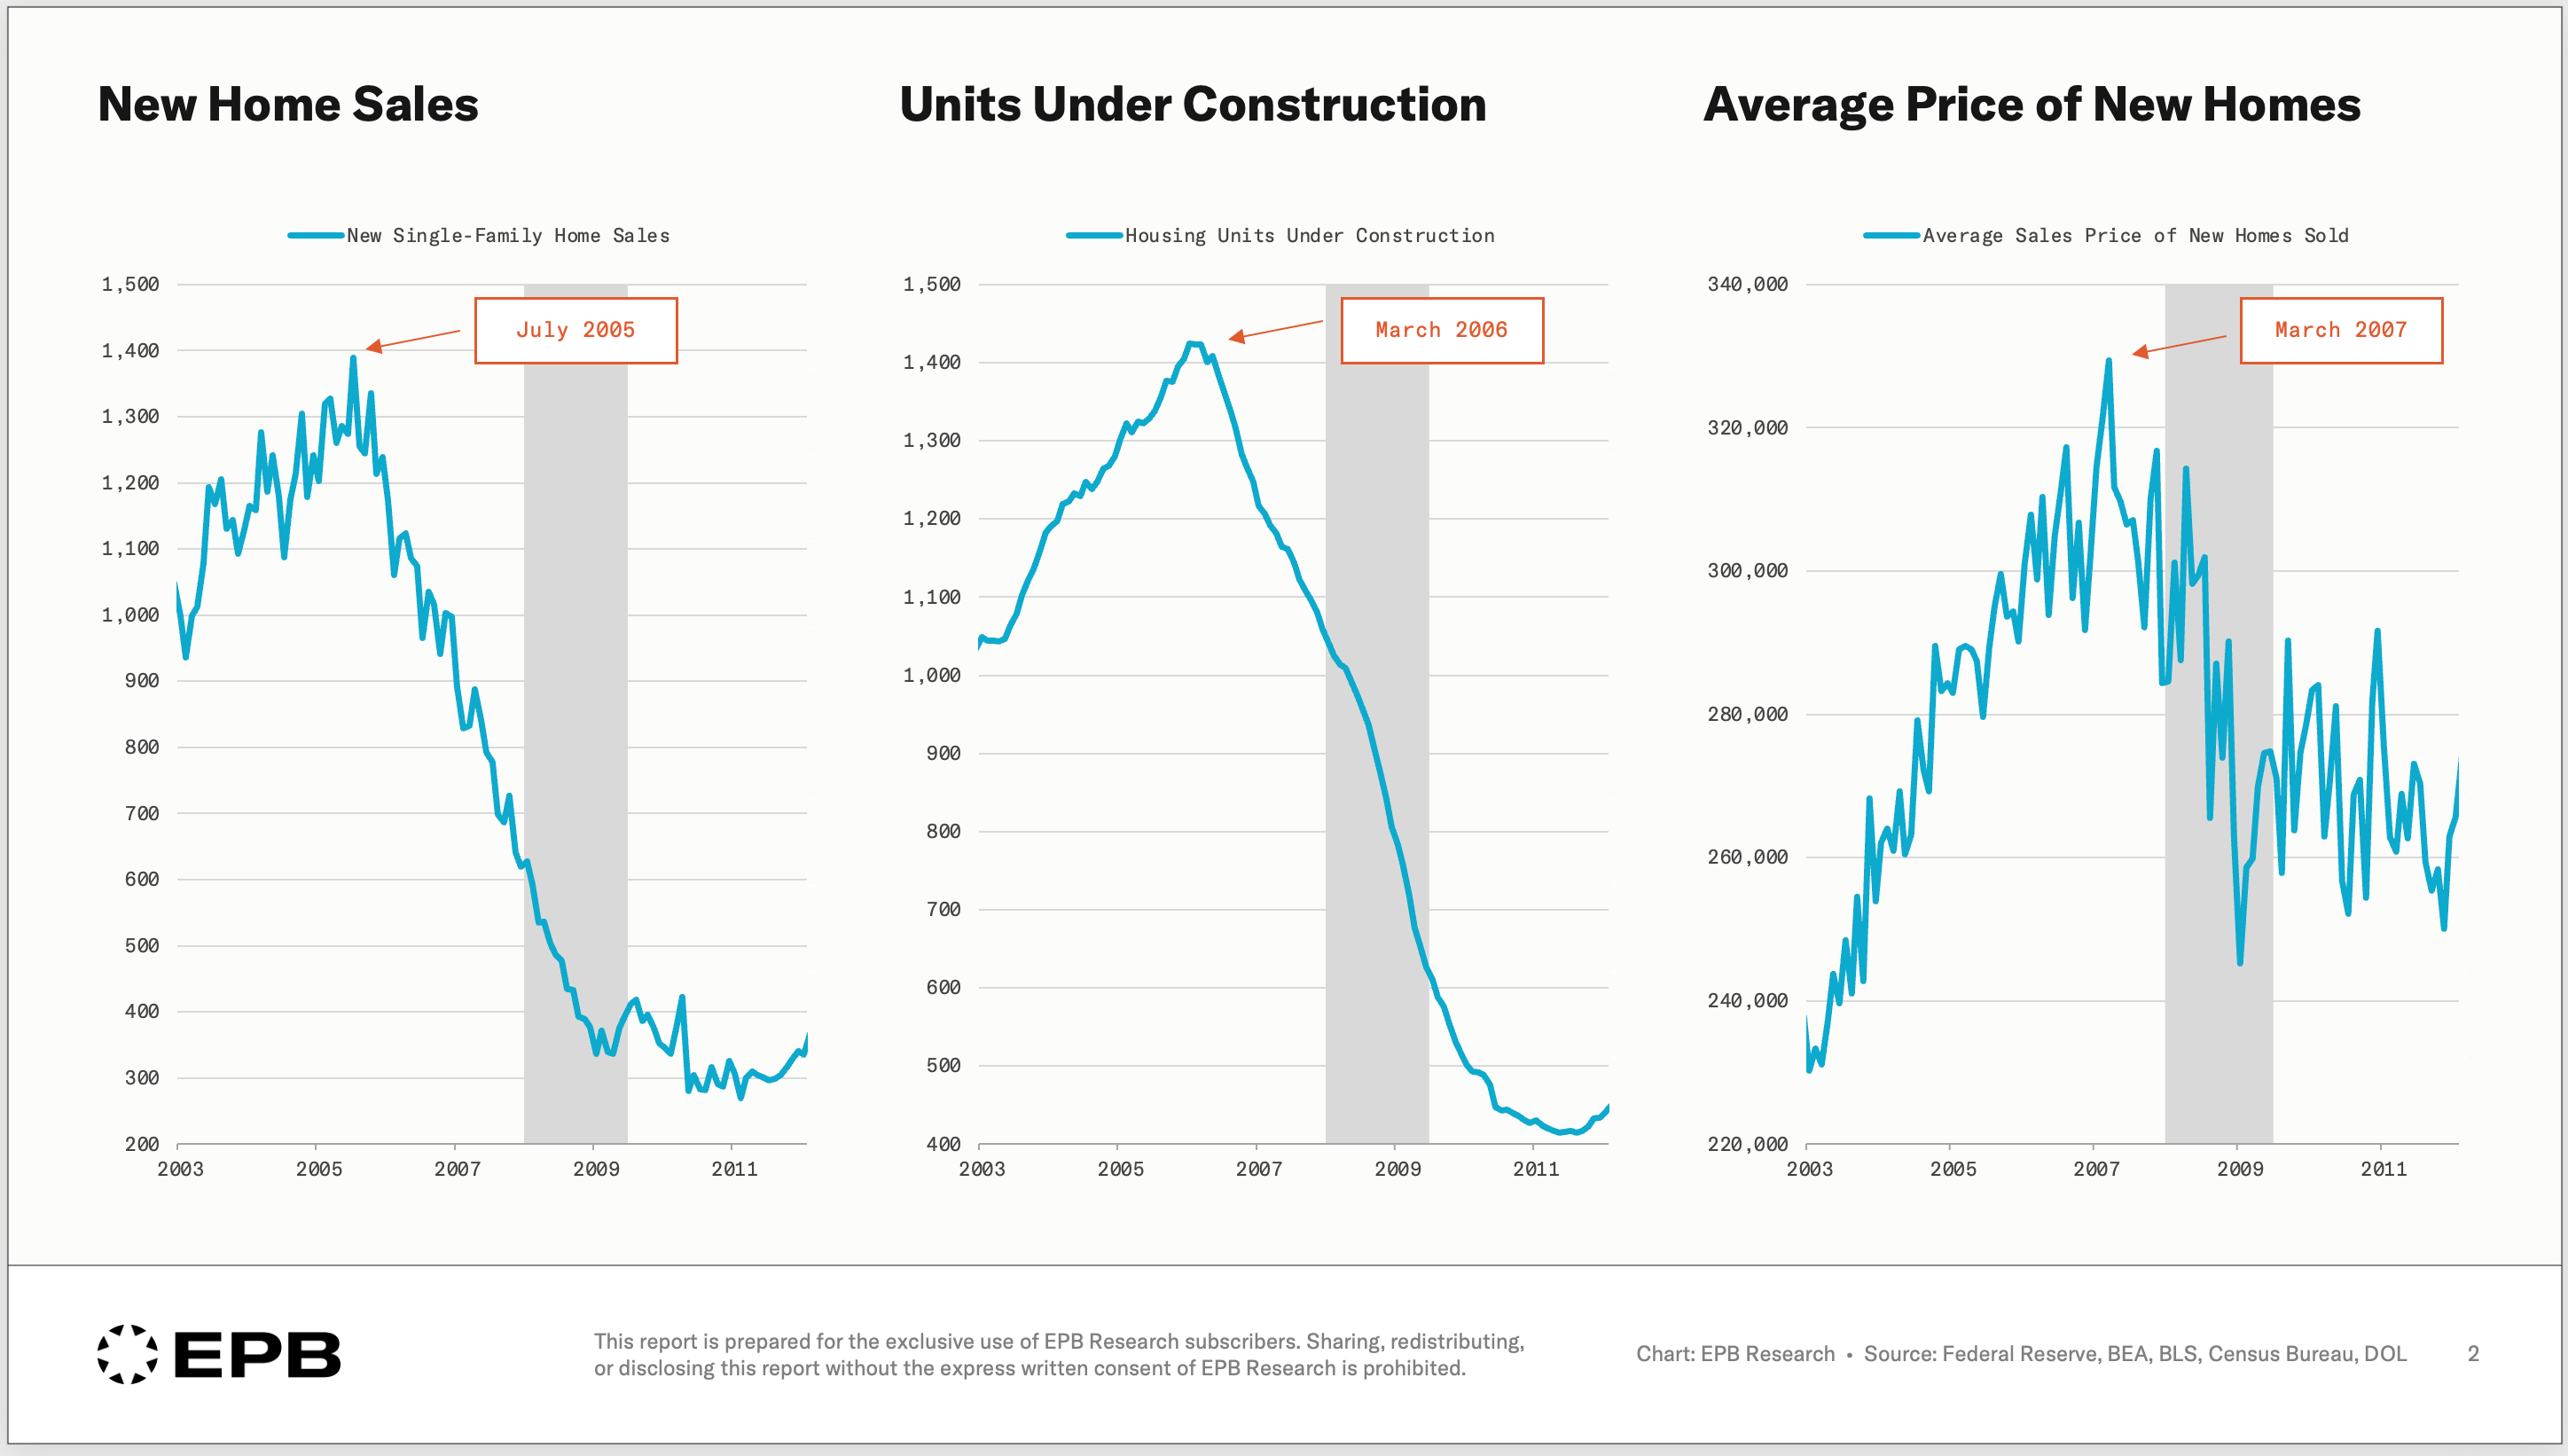
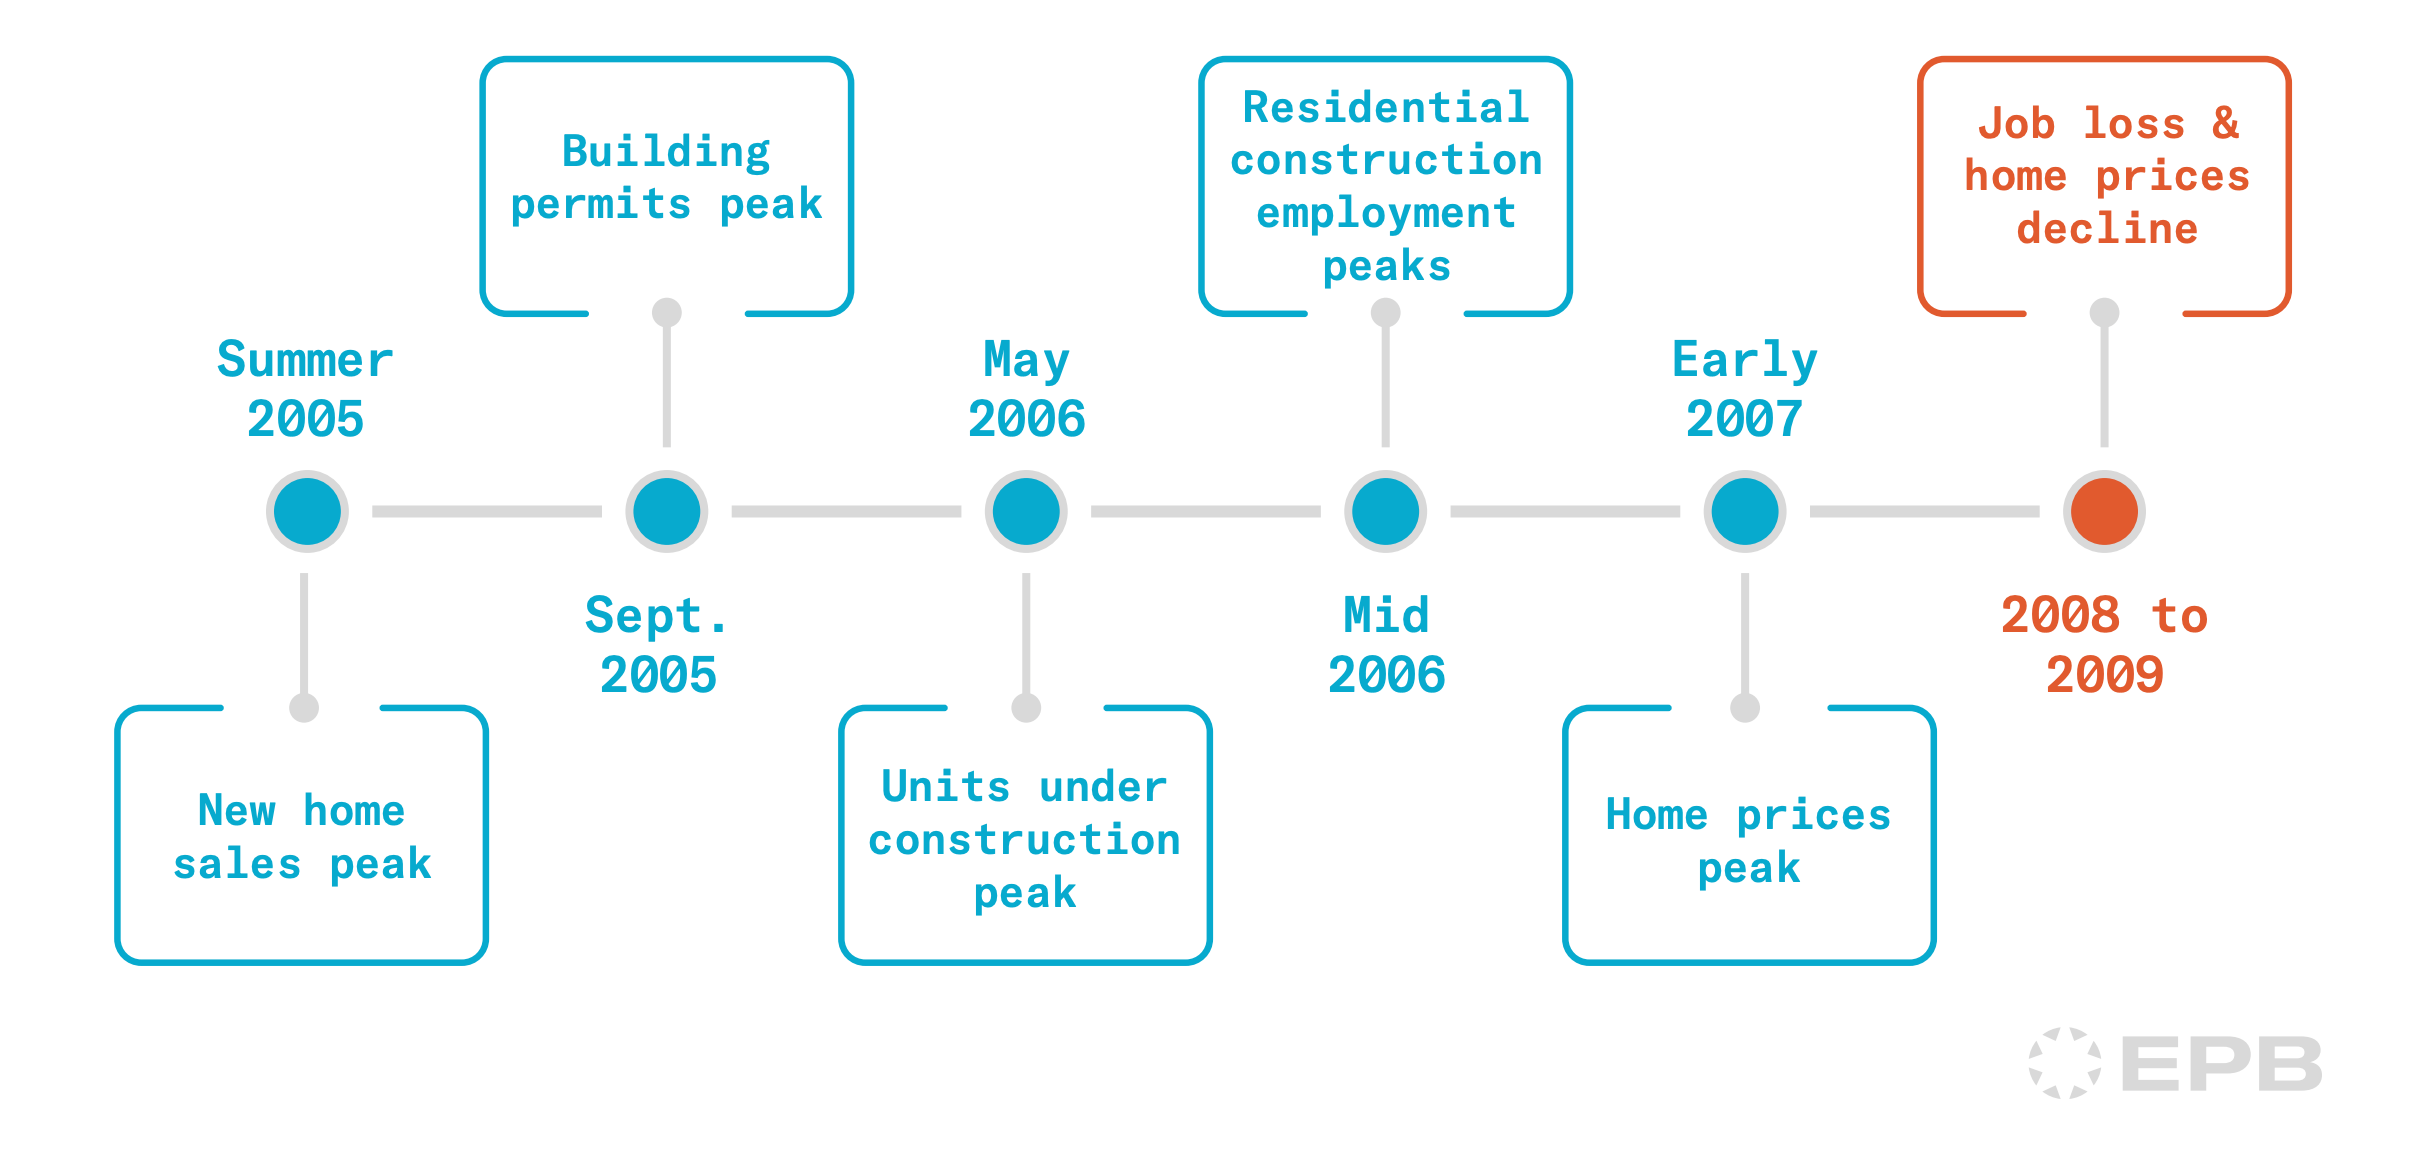
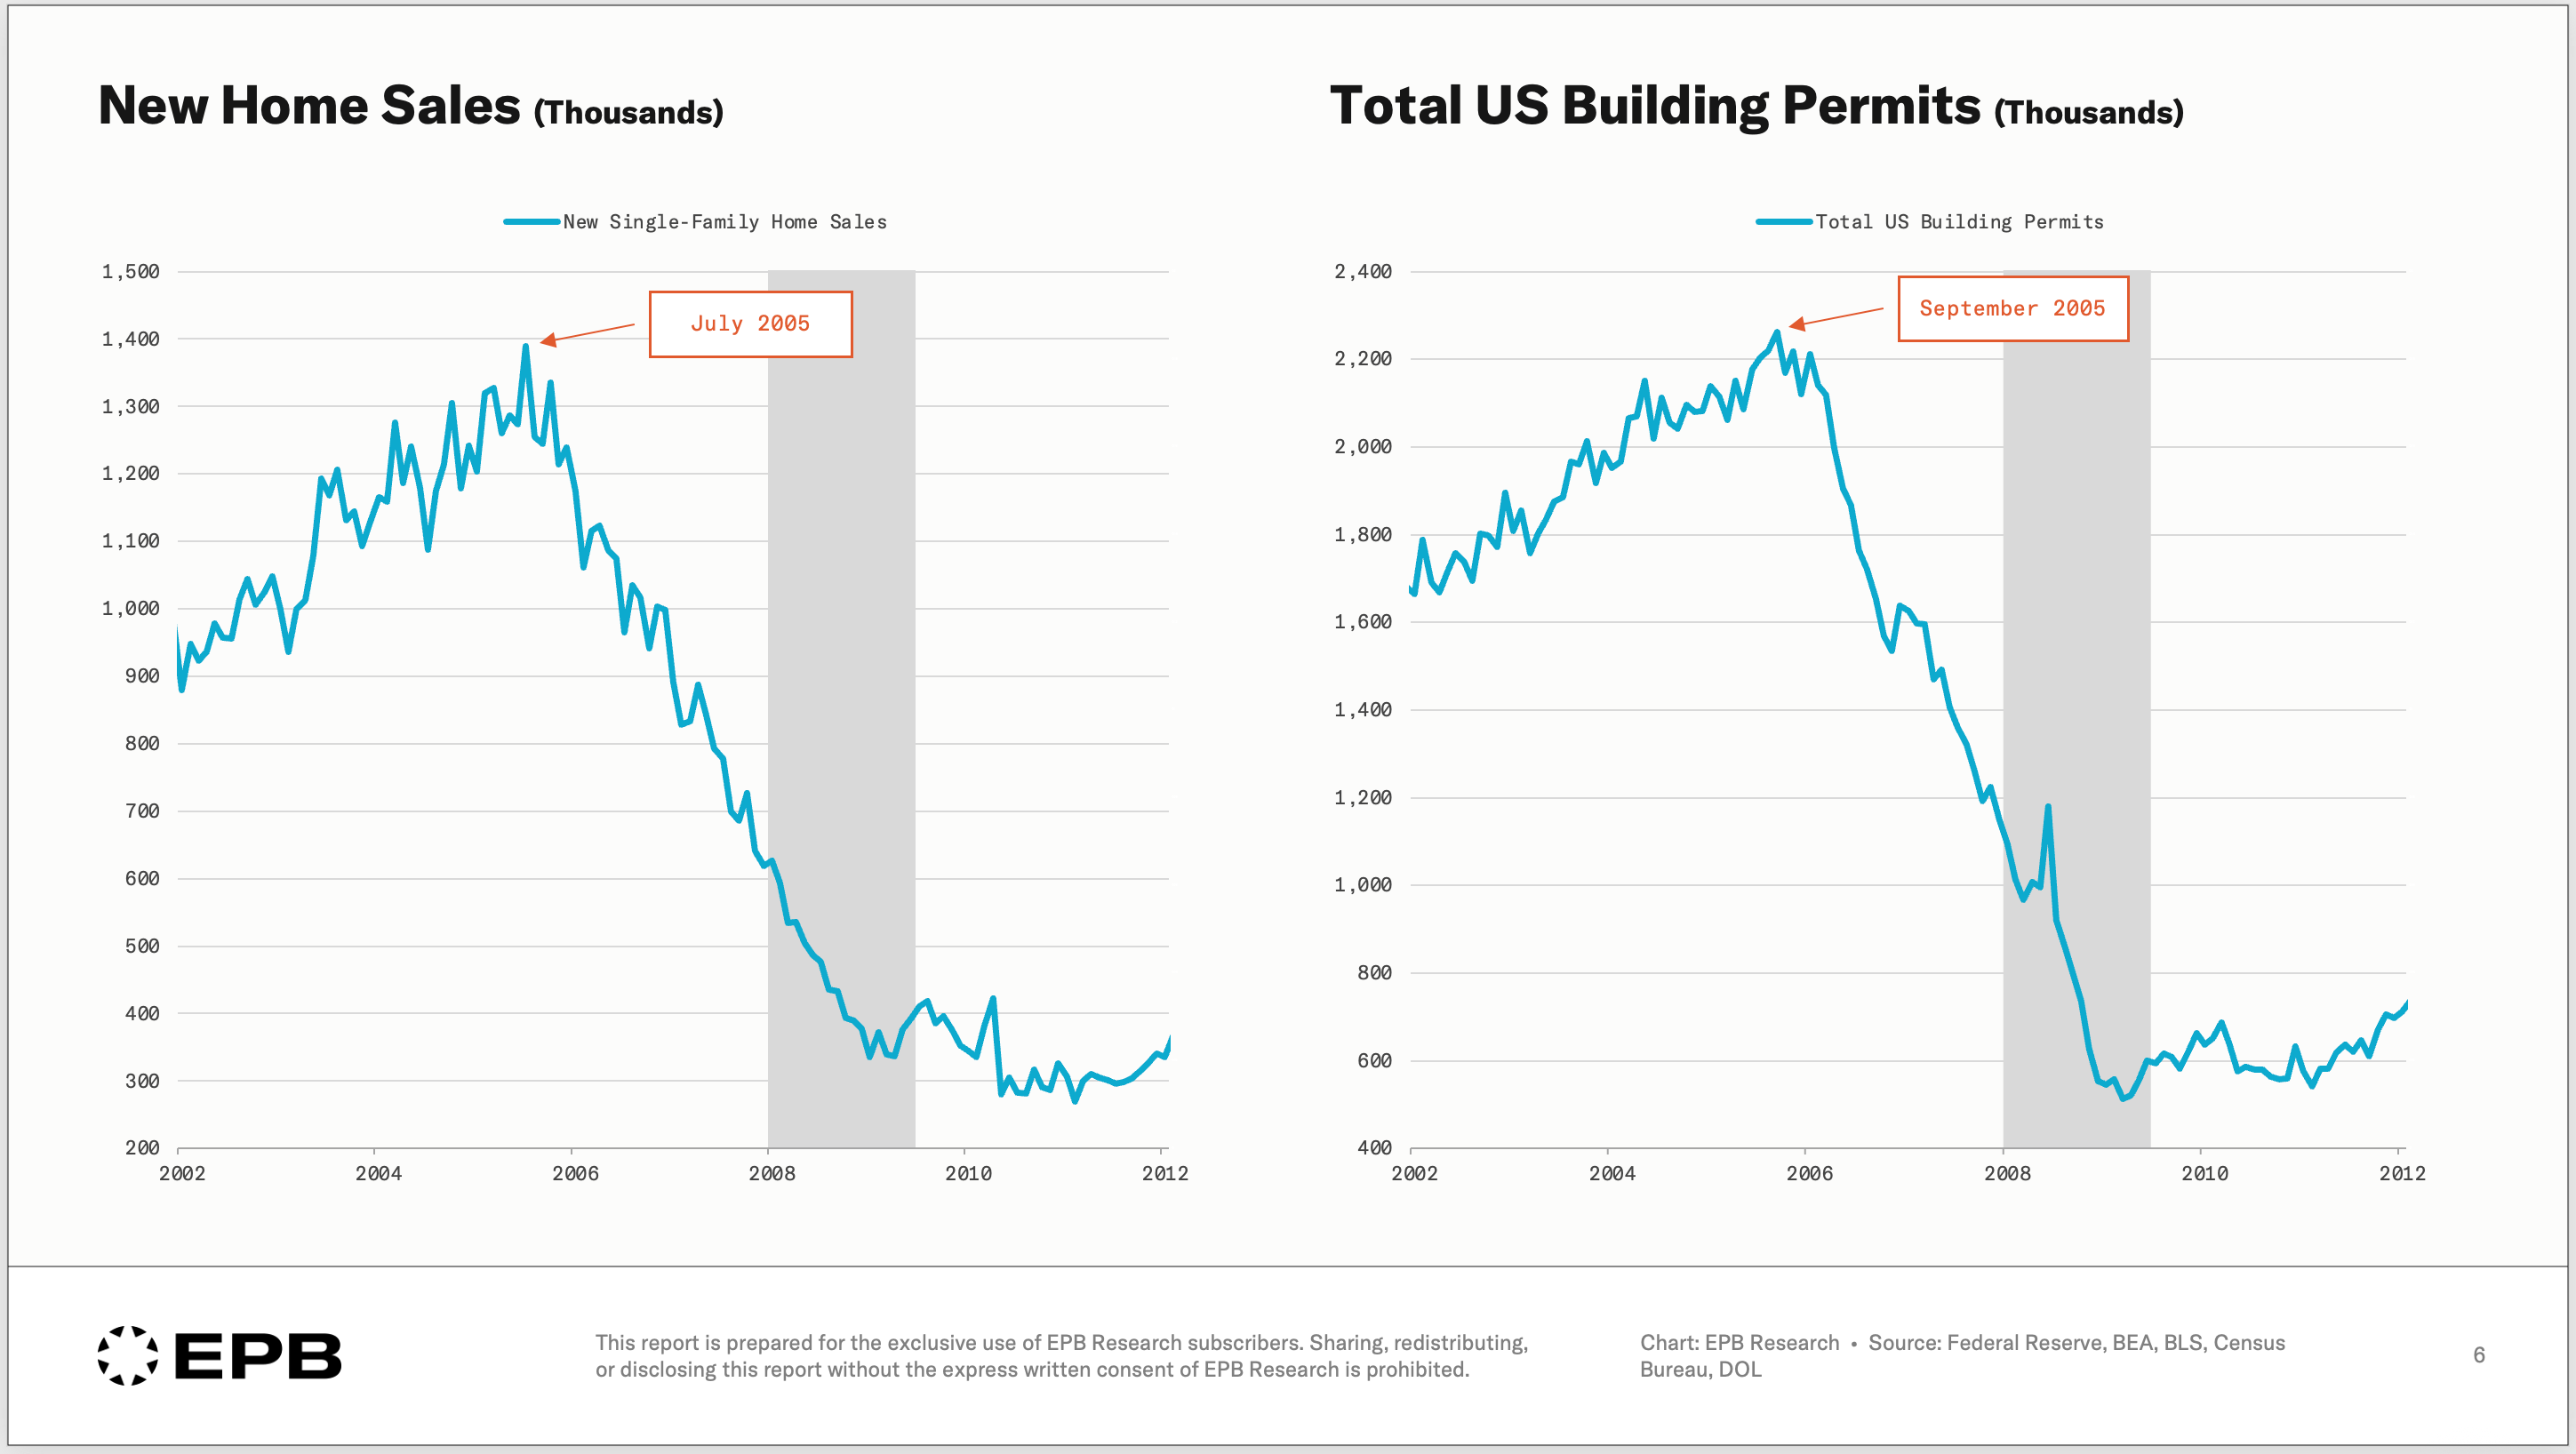
New home sales measure the volume of transactions, not the price. When mortgage rates rise, fewer buyers qualify or choose to transact, and the volume of sales declines. This response happens within weeks of a rate move. It is mechanical. Higher rates reduce affordability, fewer buyers show up, and the pace of sales drops. New home sales peaked in the summer of 2005, more than two years before the broader economy entered recession and nearly two years before home prices peaked.
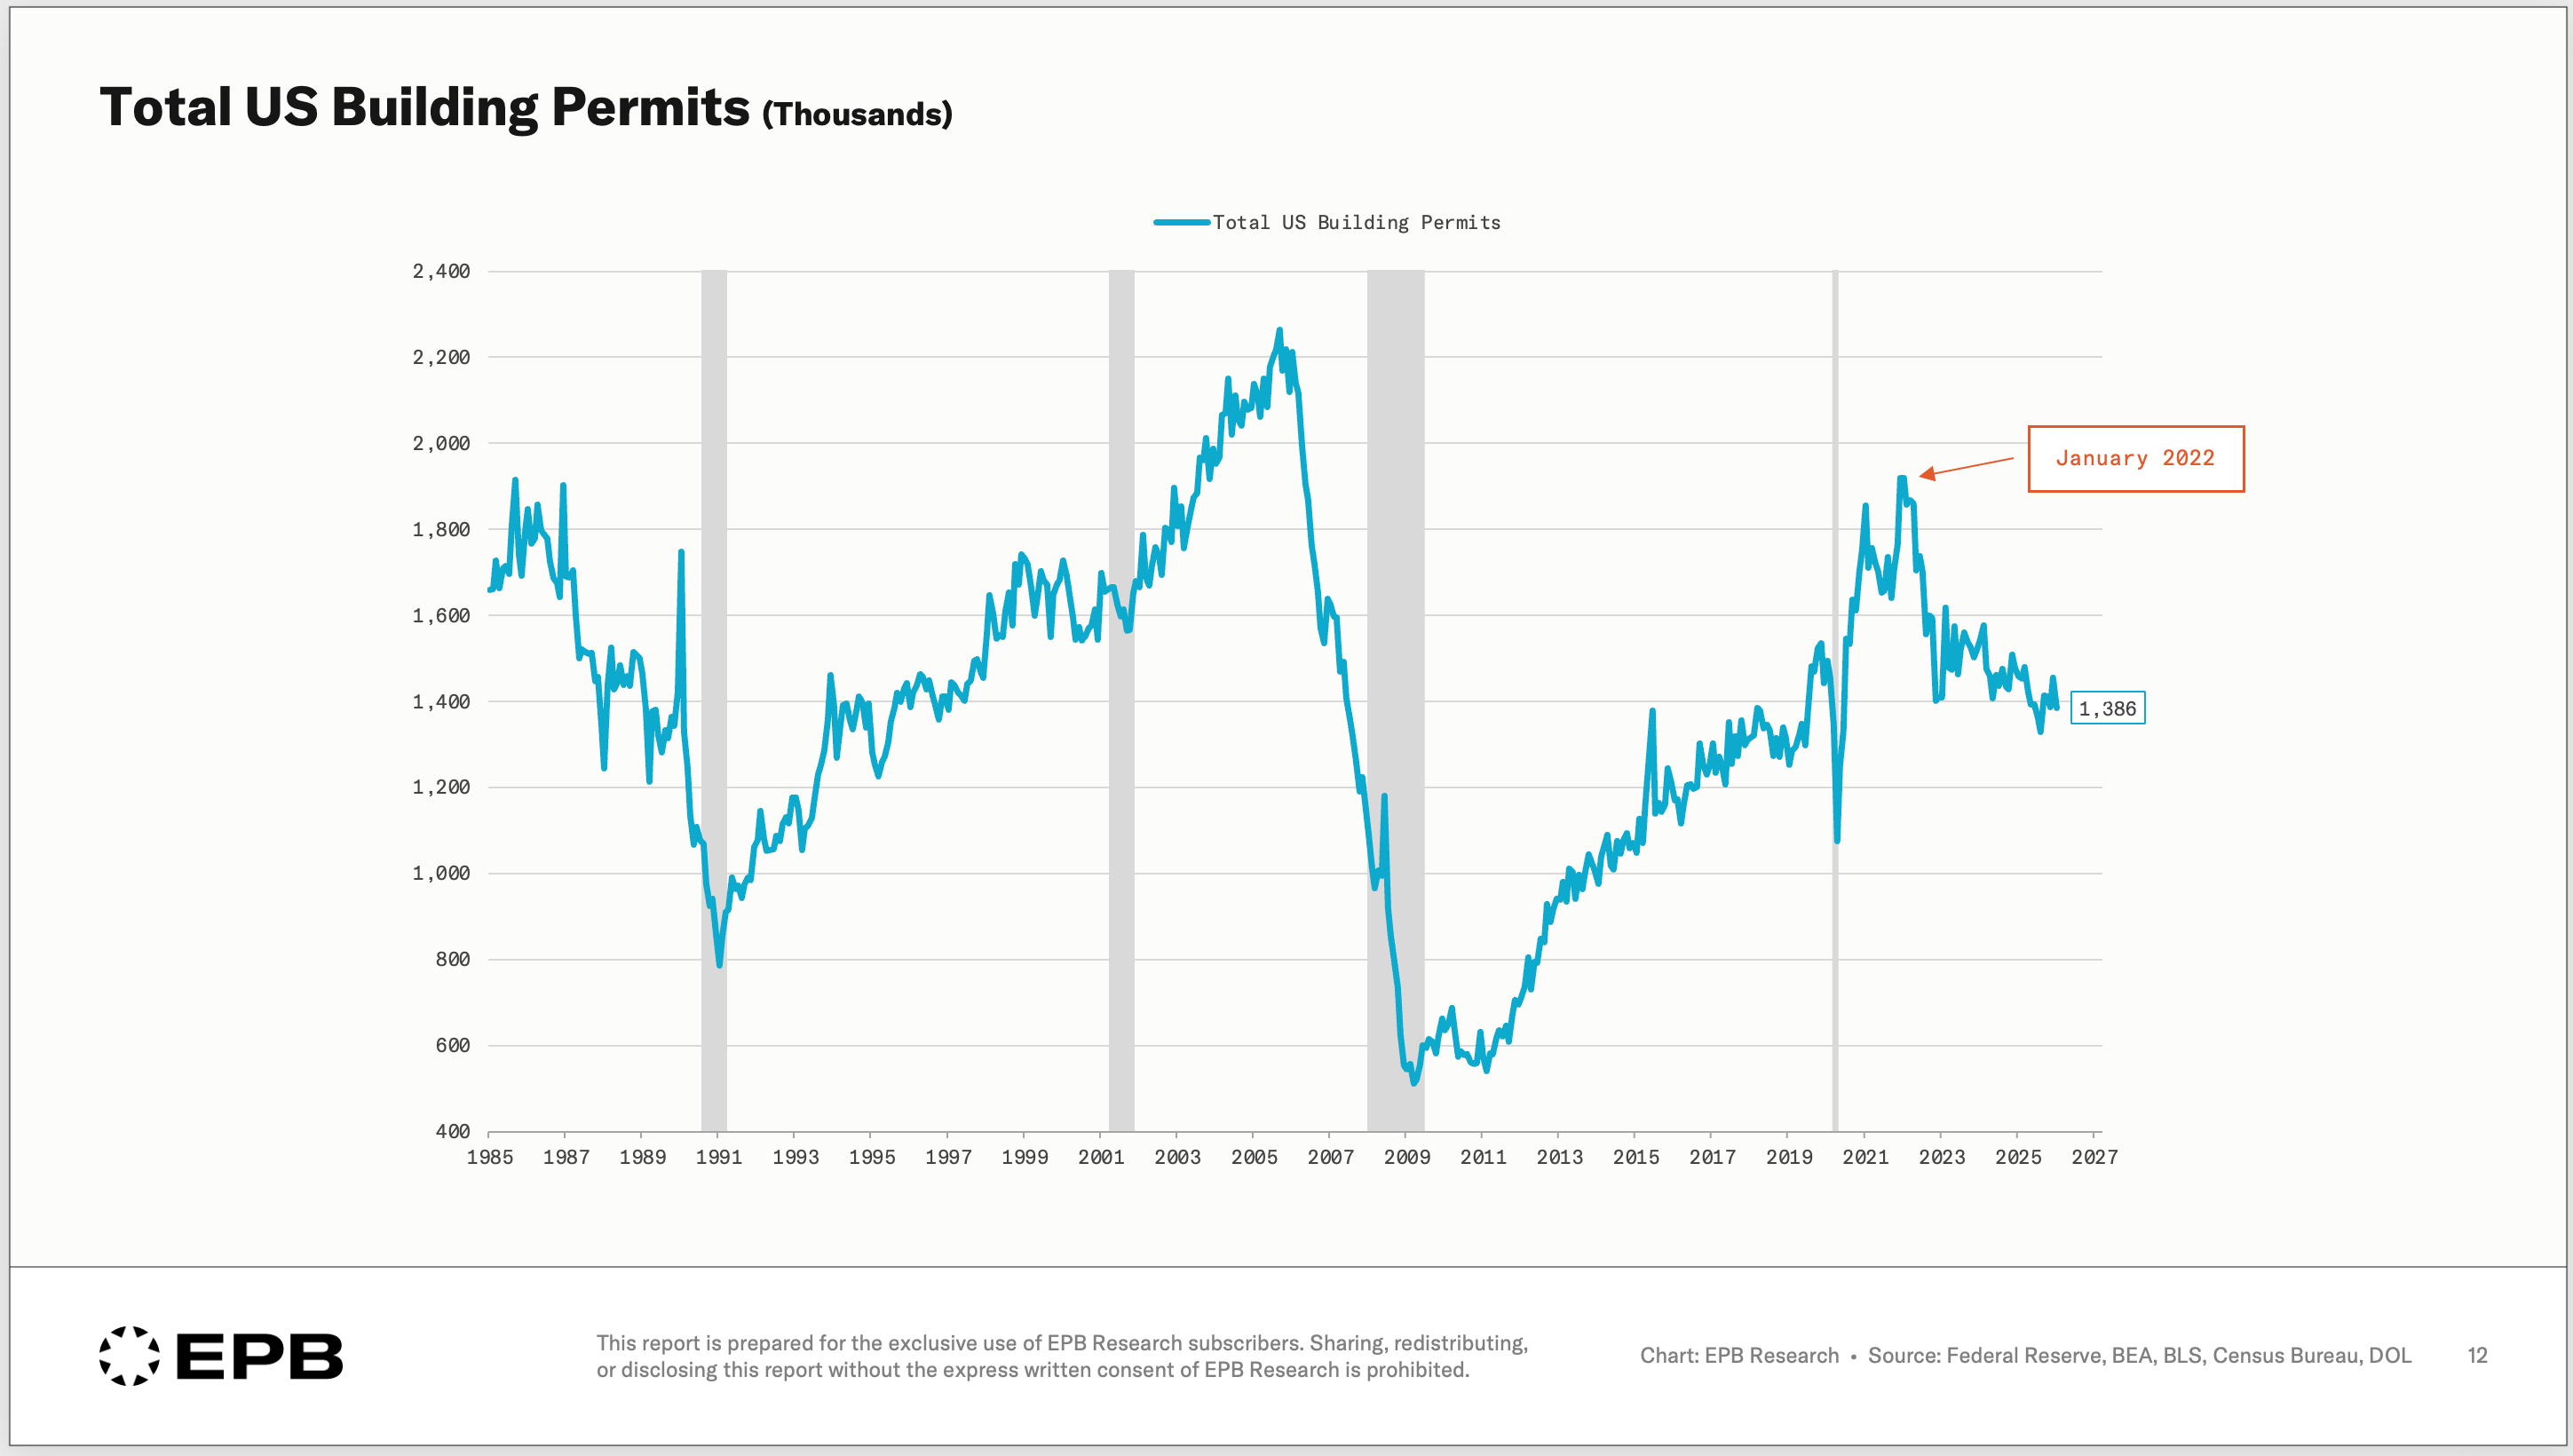
Building permits follow. A permit is a forward commitment to build. When builders see sales slowing, they pull back on new projects. Building permits peaked in September 2005, confirming the signal from new home sales.
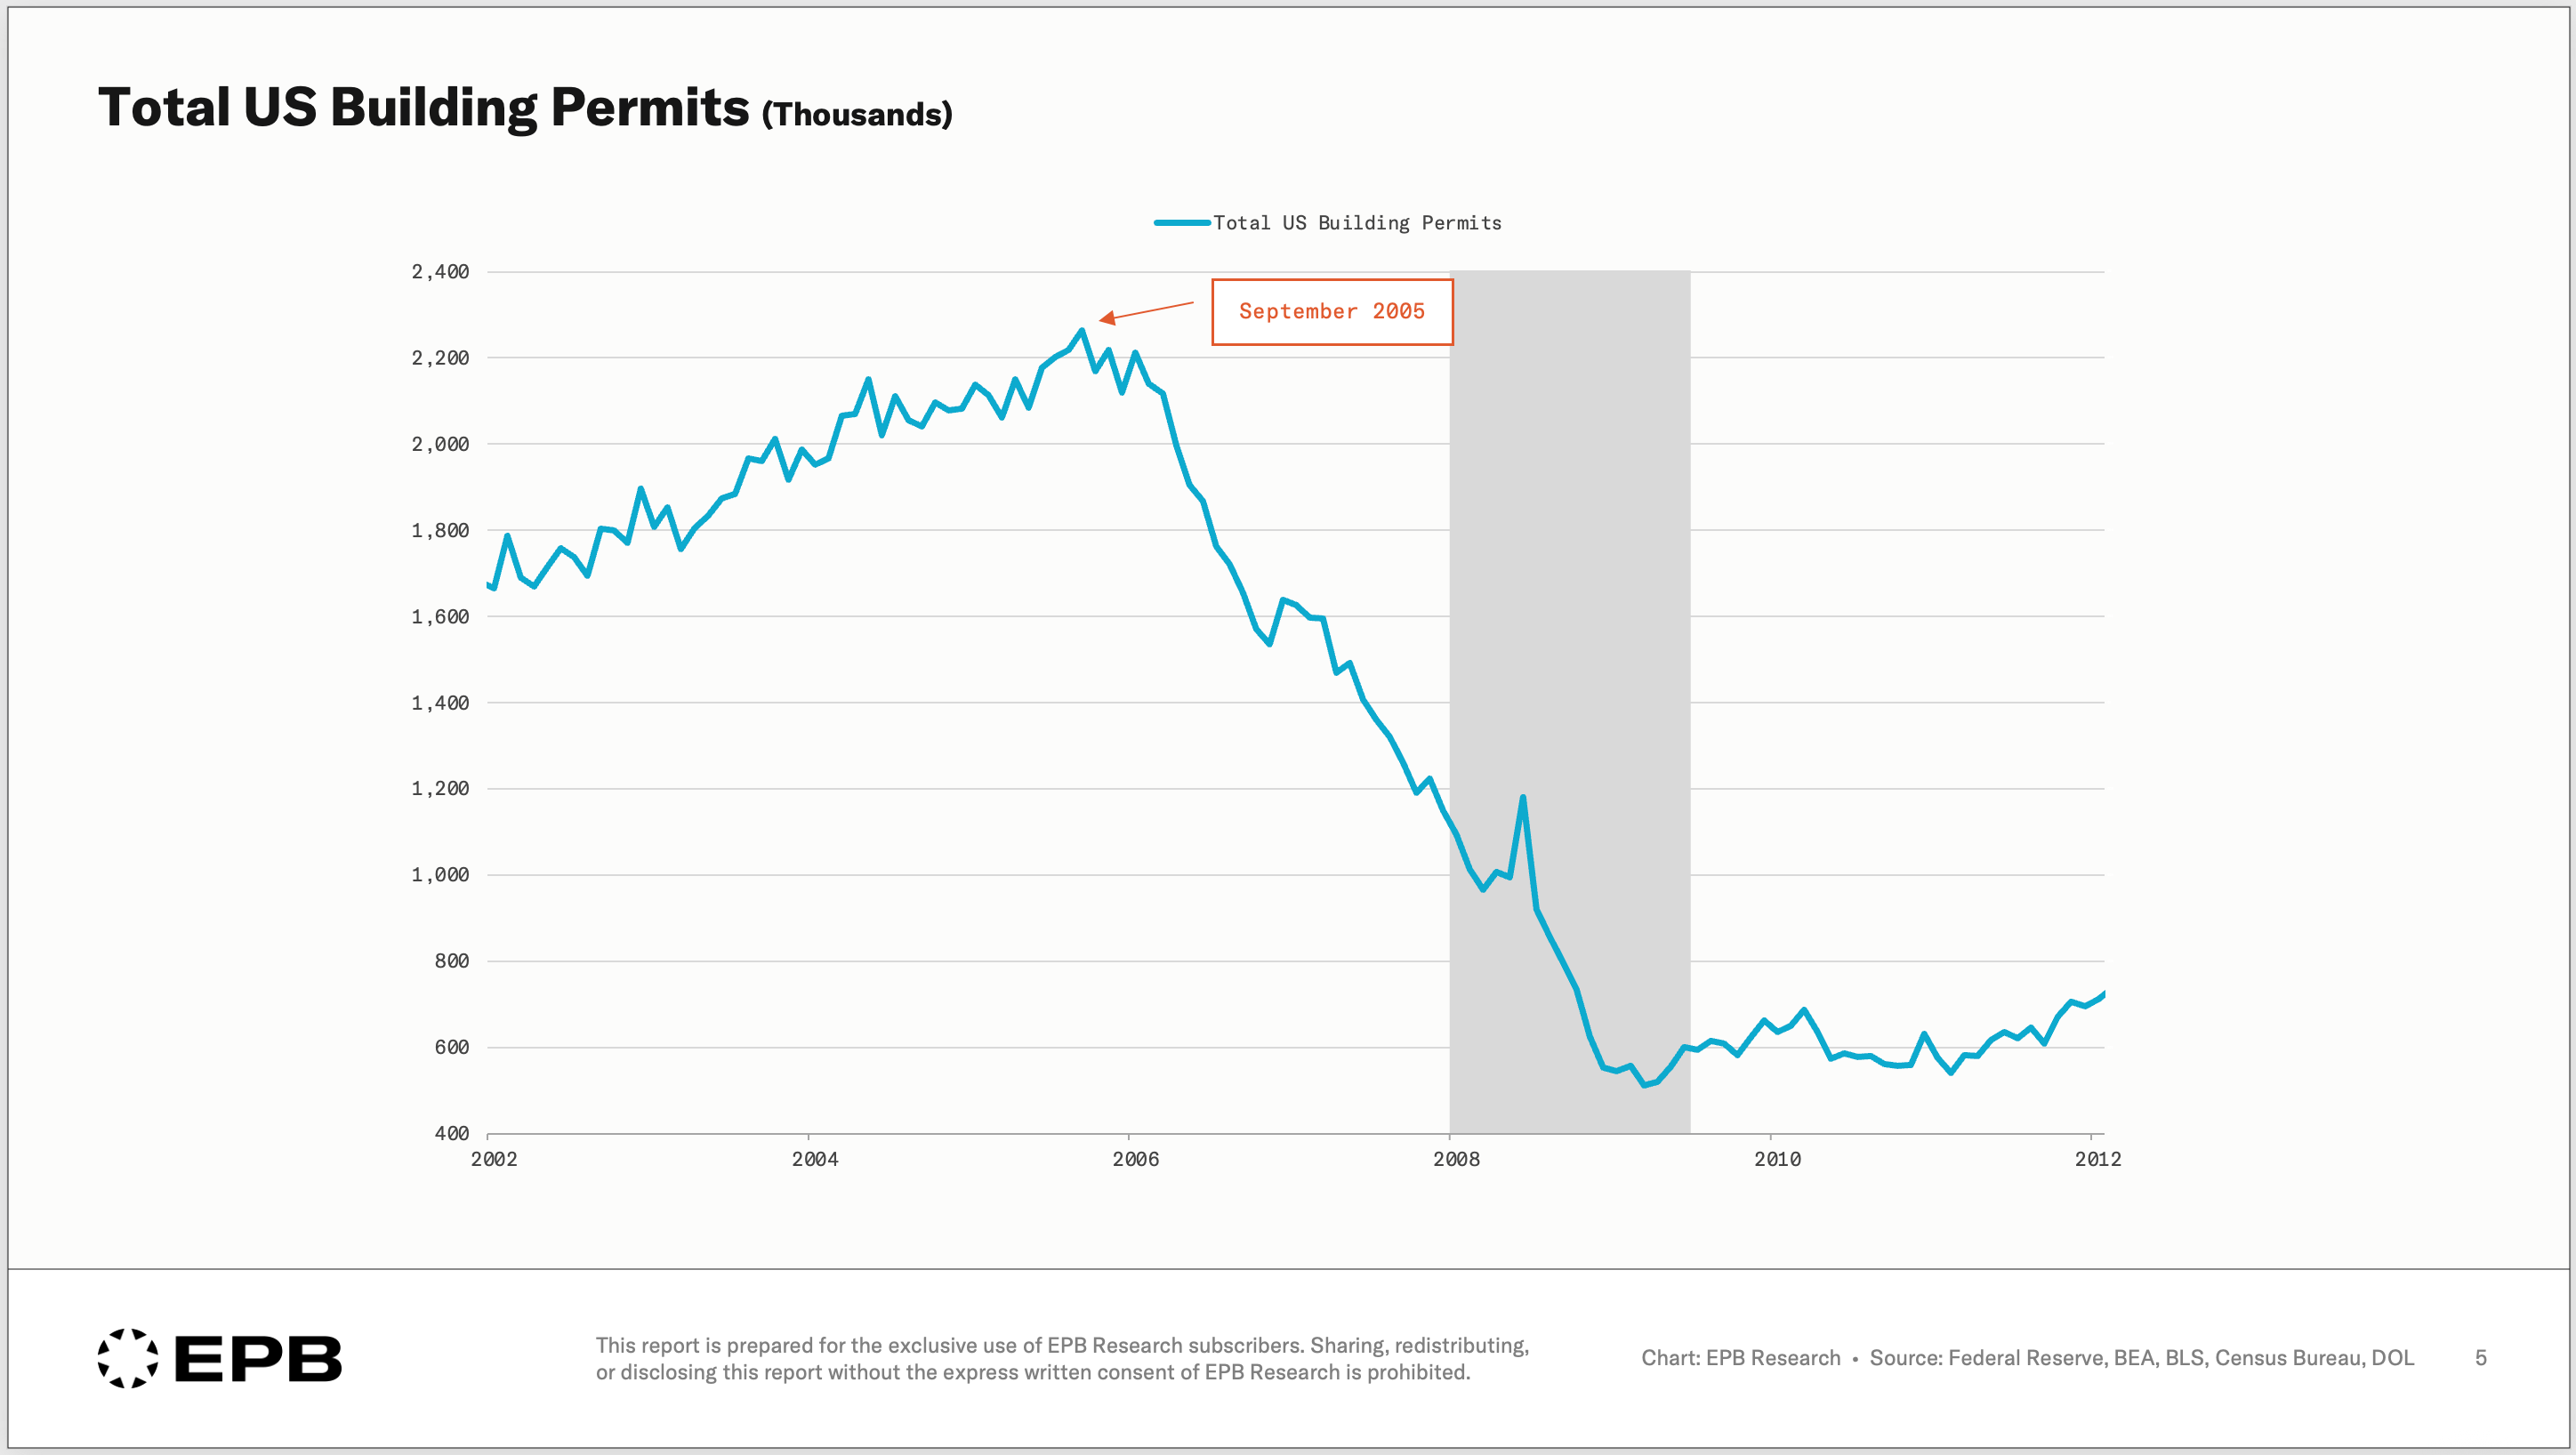
When both indicators decline together after a tightening cycle begins, it forms a cluster of leading indicators. One indicator declining can be noise. A cluster of indicators in the same bucket declining together is the sequence turning.
This is the critical concept. We are not looking at any single data point and drawing a conclusion. We are watching for a sequence of indicators all moving in the correct order, because that pattern has preceded every major housing downturn in the modern era.
From Leading Indicators To Real Economic Impact
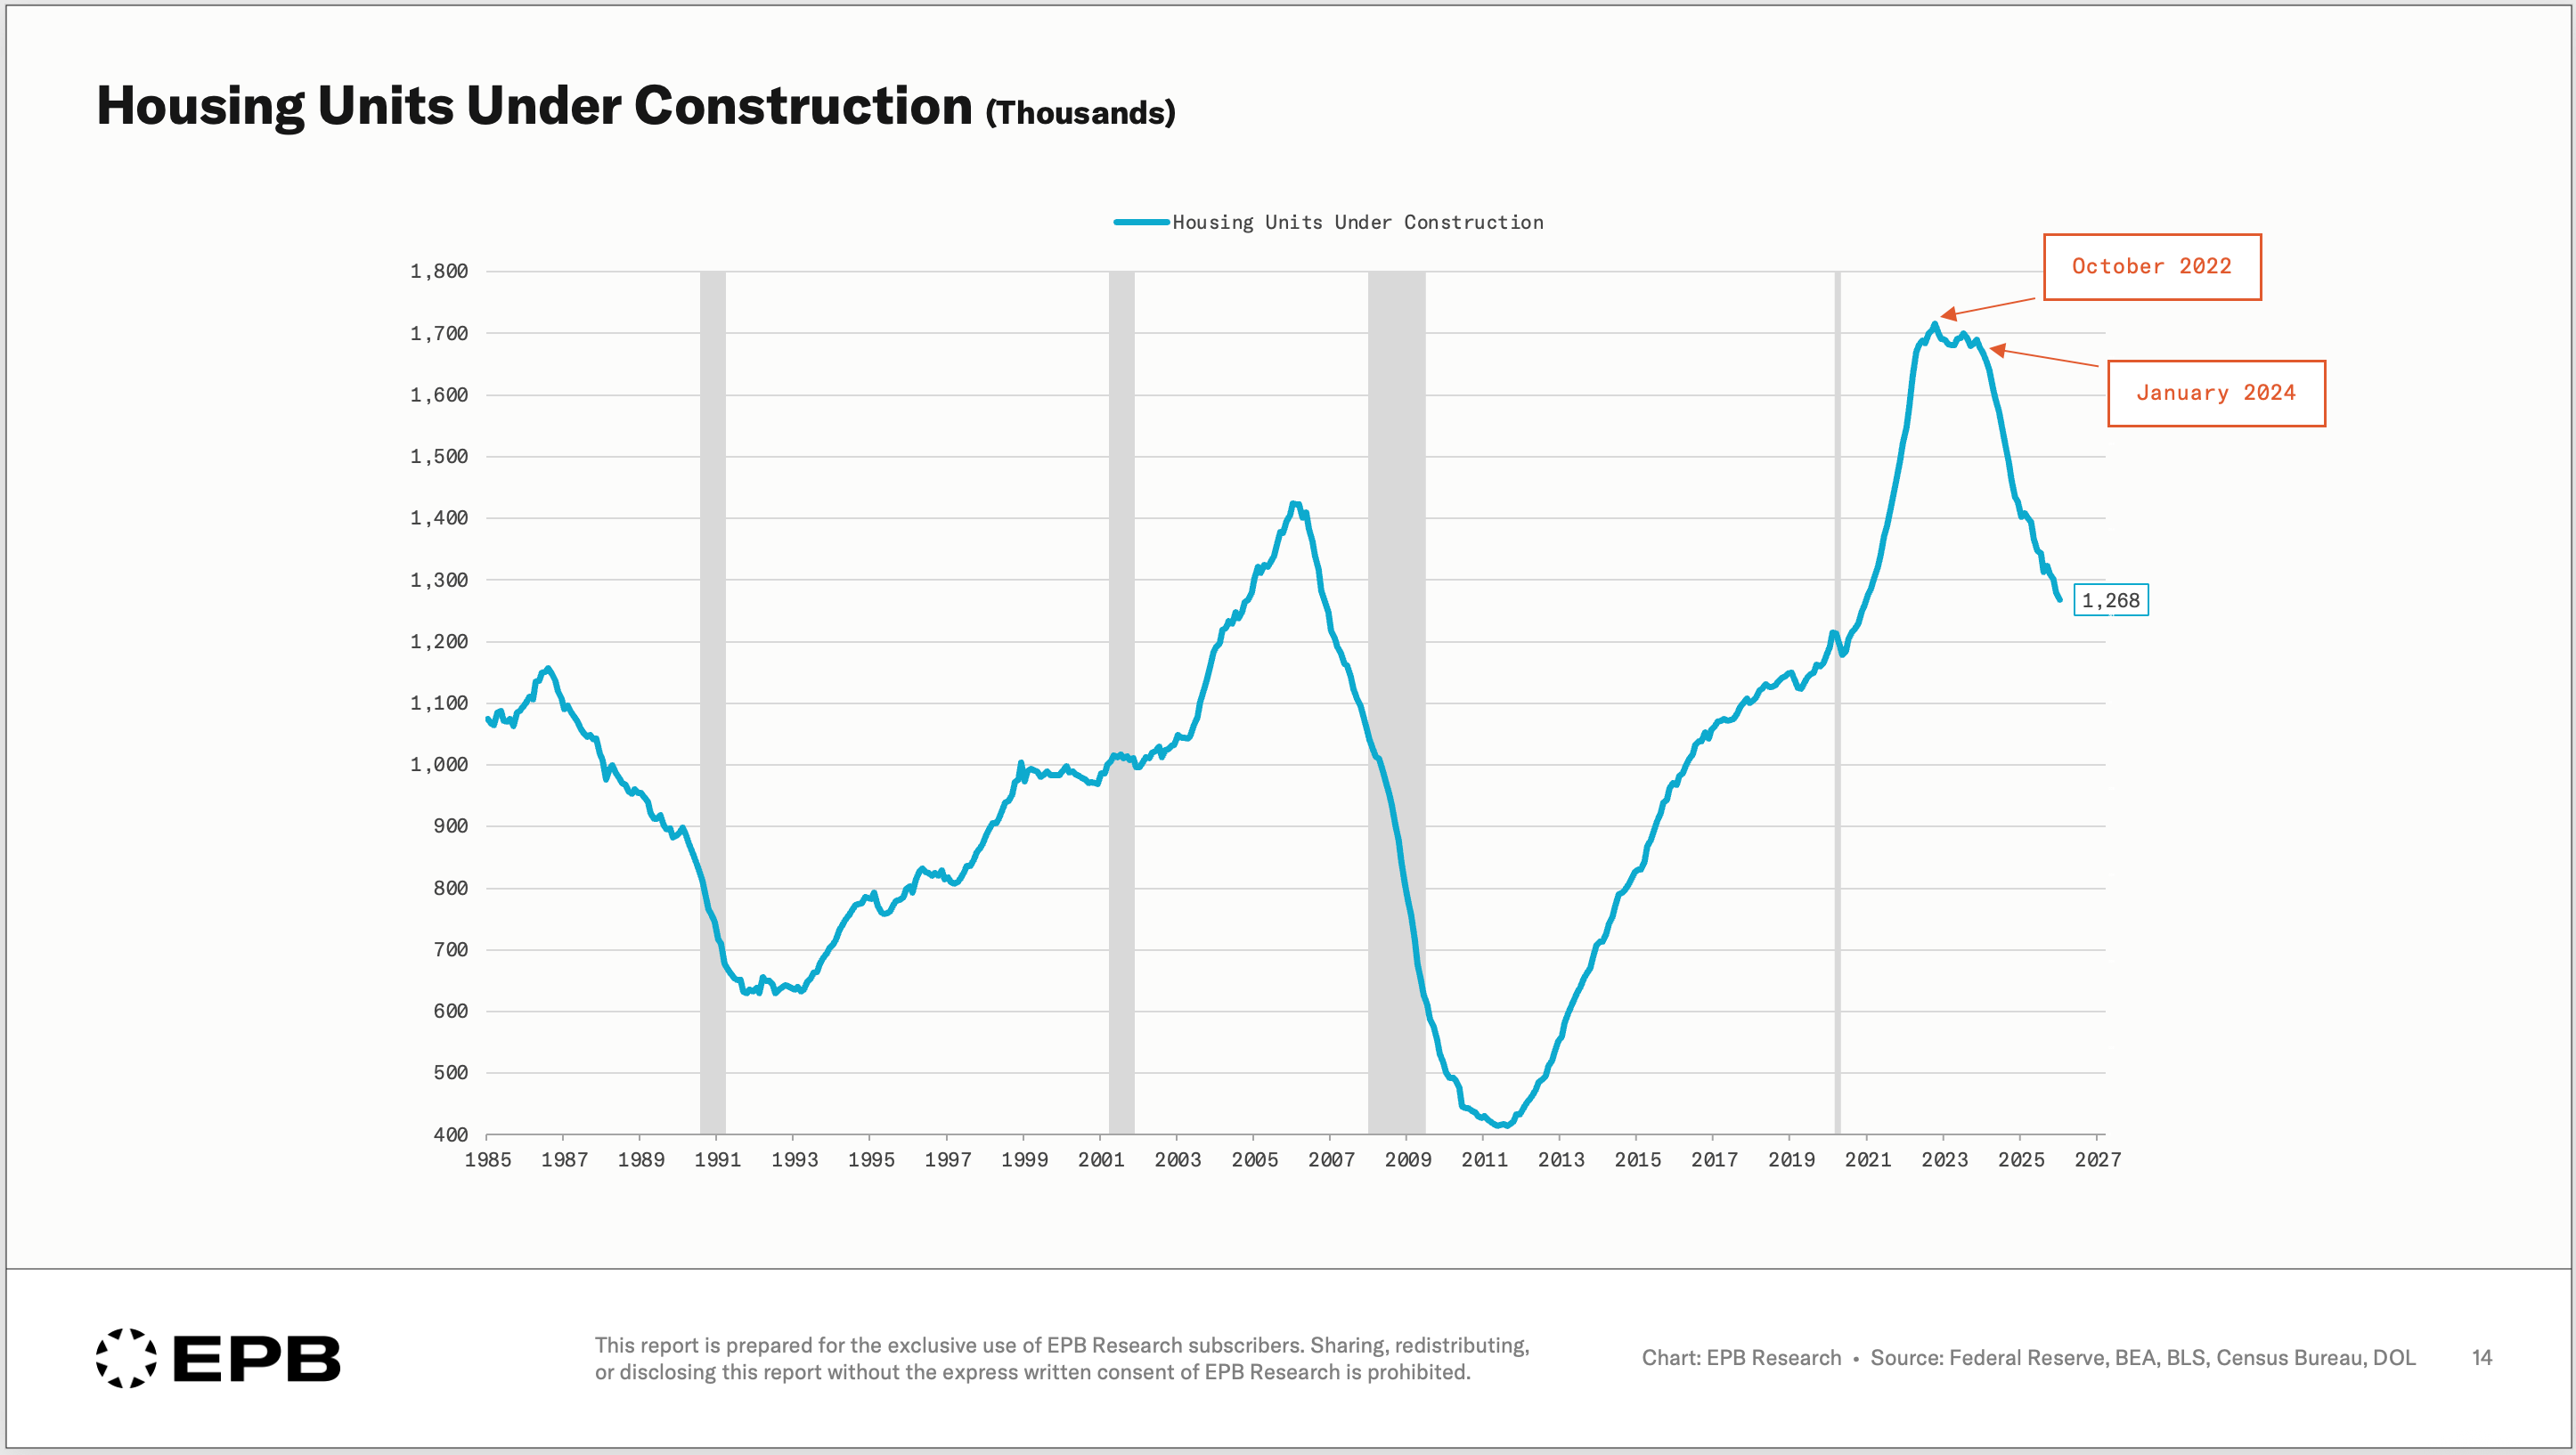
As building permits decline, actual construction activity follows. The number of housing units under construction peaked in May 2006, several months after the volume of new home sales and building permits.
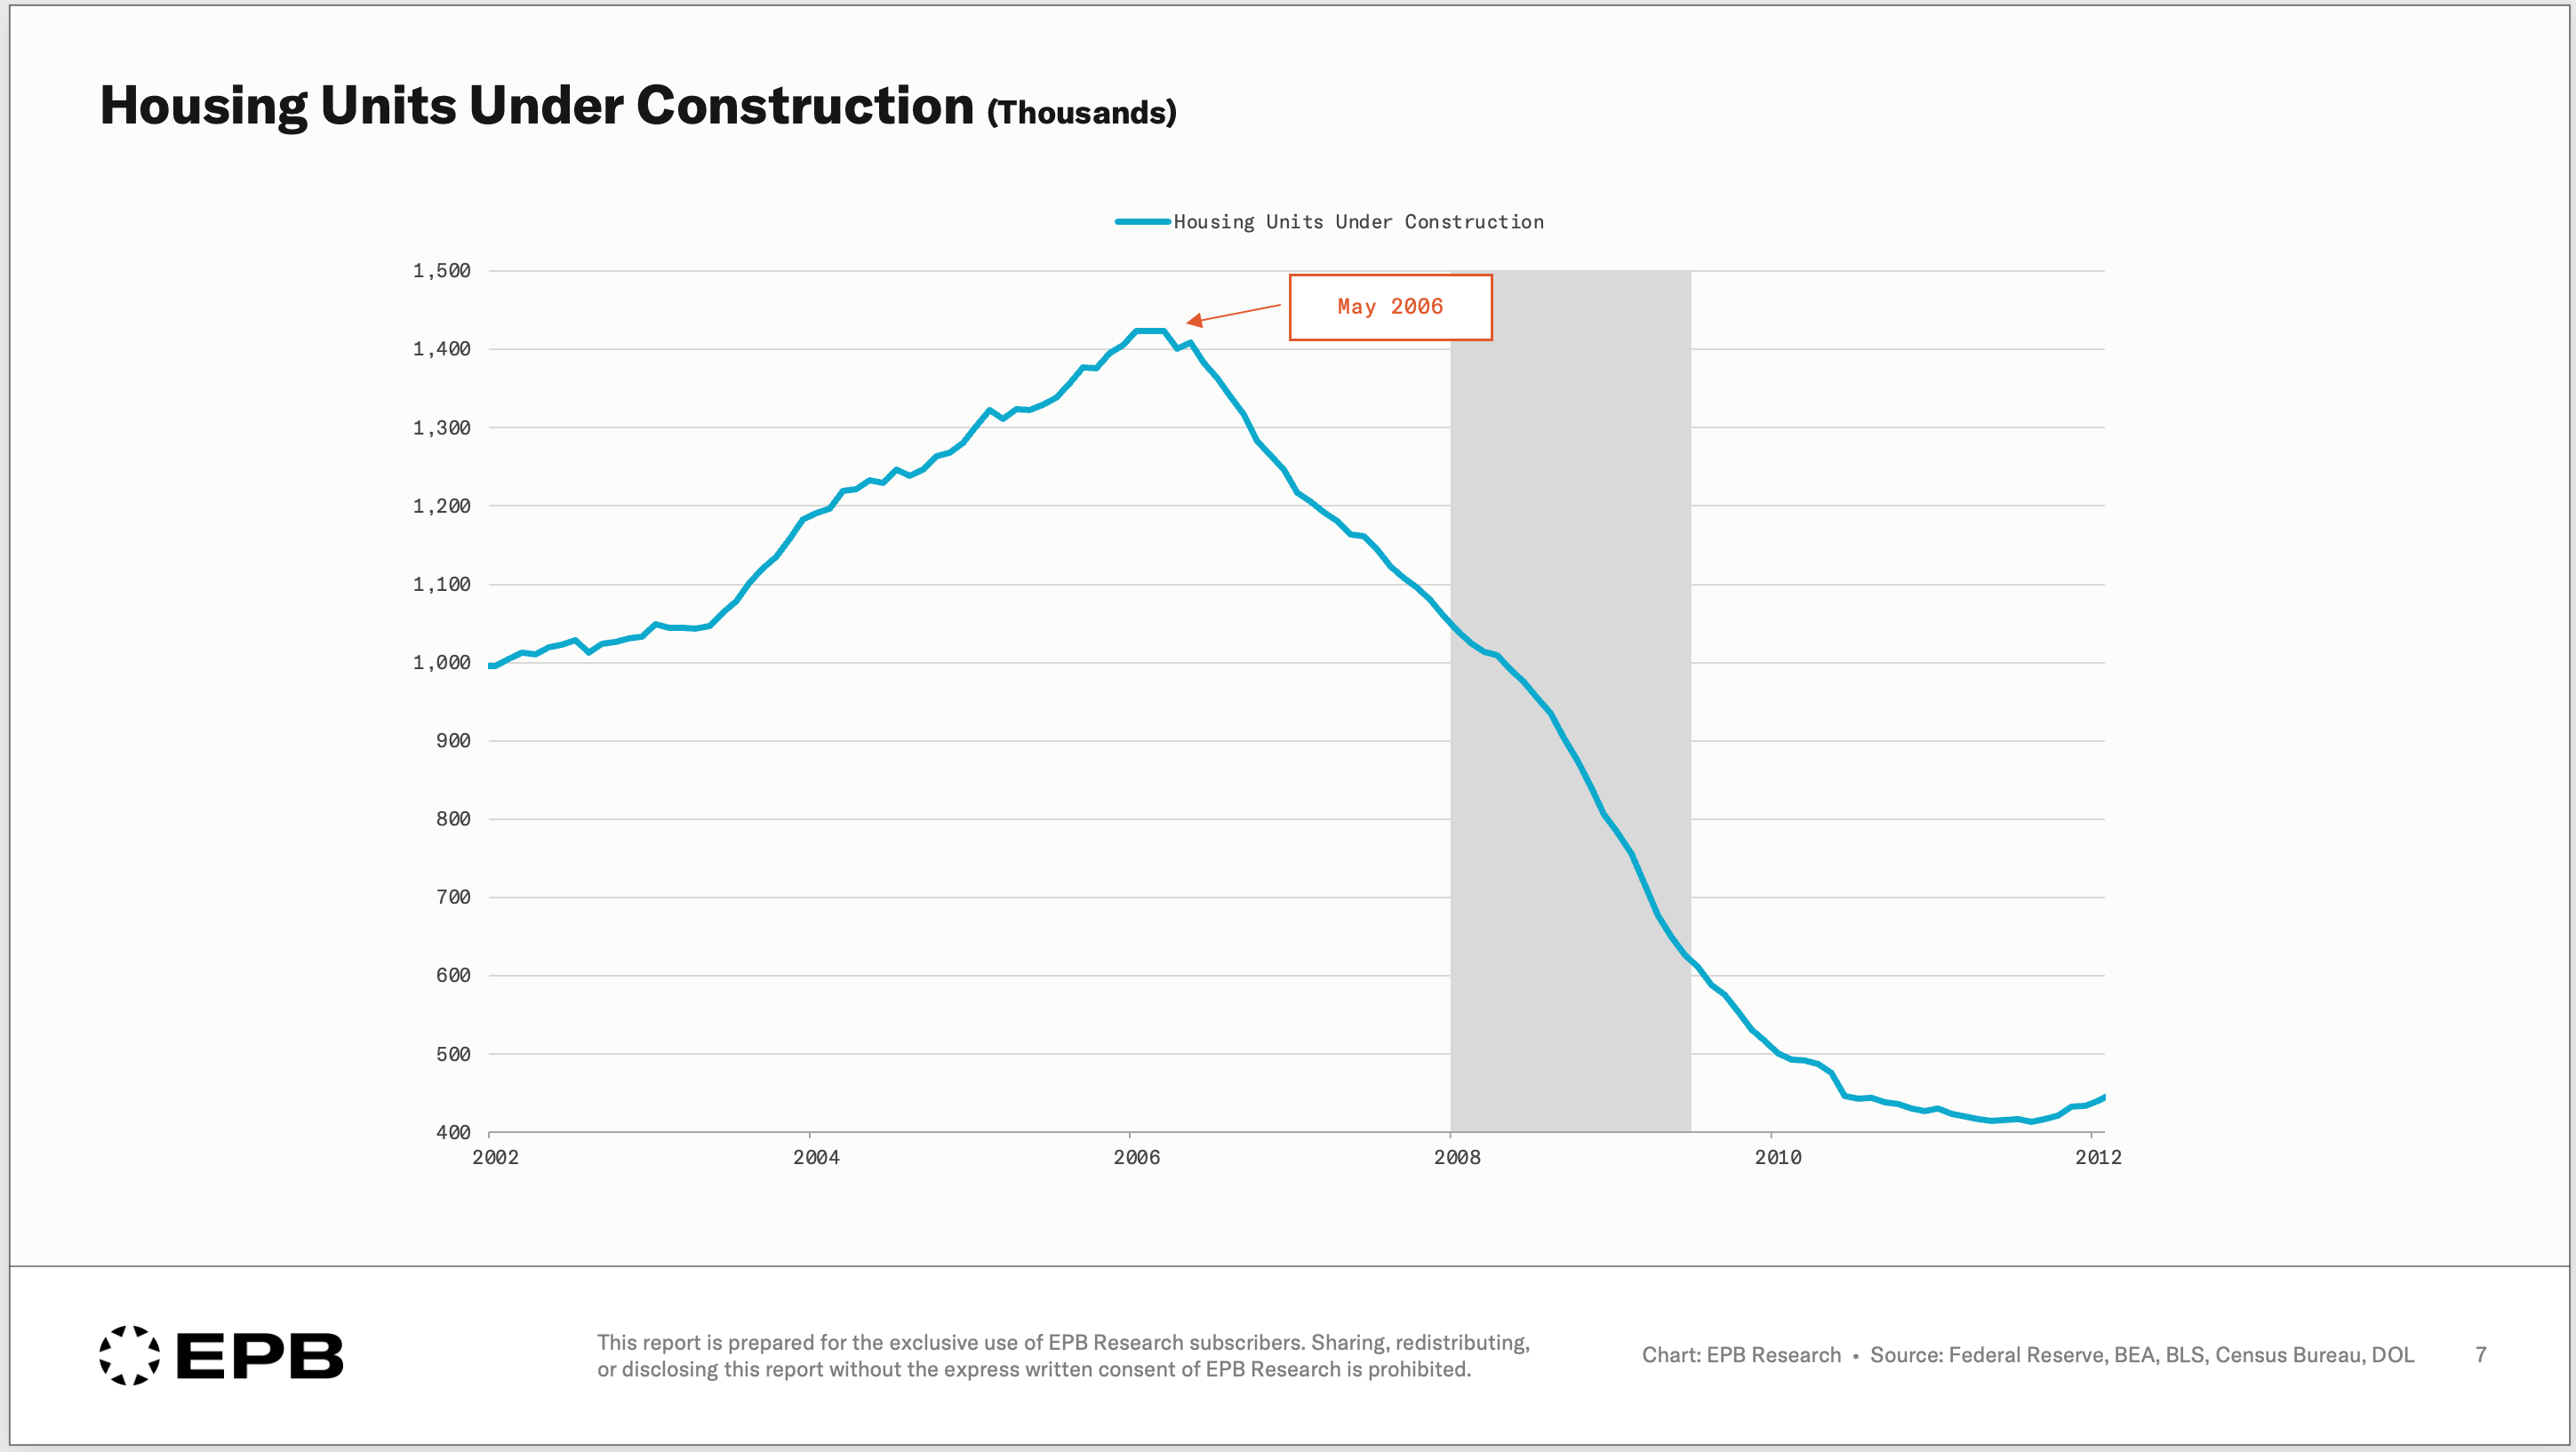
A new home sale or a building permit can change in an instant. If a home is under construction, it says under construction until it’s completed. In the terminology we use at EPB Research, this is the transition from the Leading Economy into the Cyclical Economy, from forward-looking commitments to actual production and employment.
Fewer homes under construction means fewer construction workers are needed. Residential construction employment peaked in mid-2006 and began declining. This is where the sequence becomes dangerous, because job losses in construction create downstream effects on the rest of the economy.
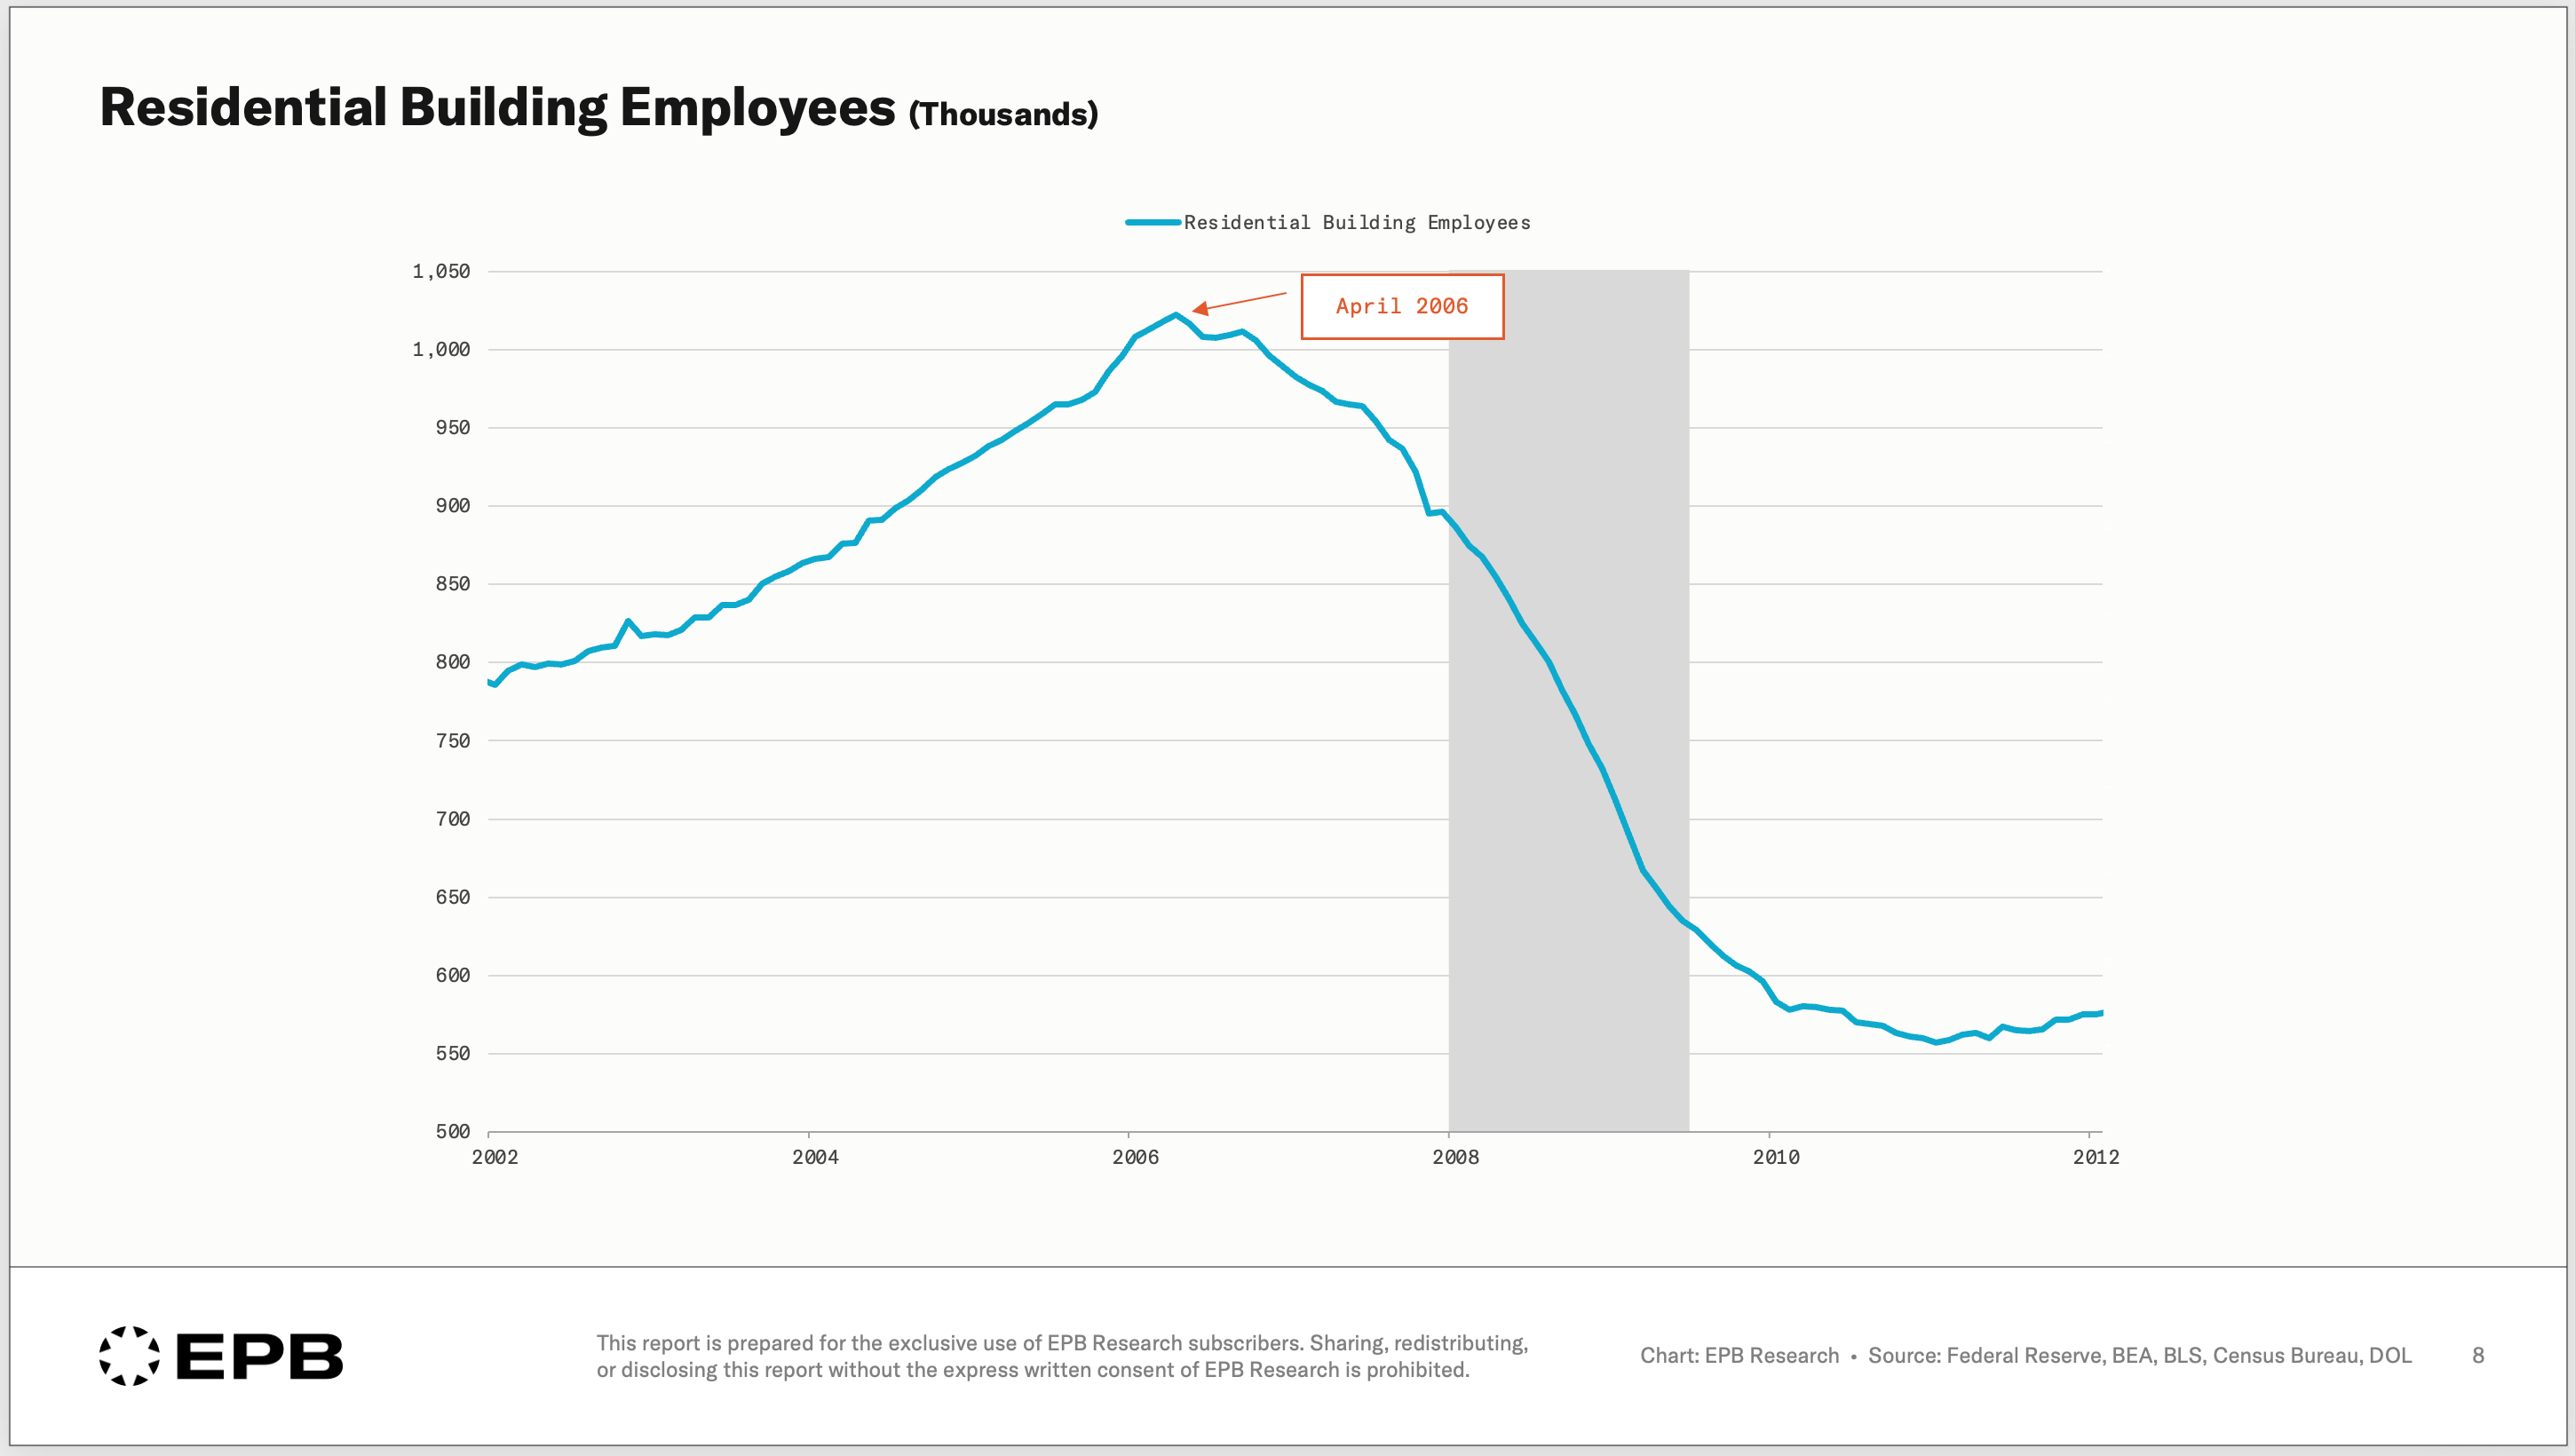
Workers who lose construction jobs immediately cut discretionary spending. They may default on auto loans, credit cards, and mortgages. Banks experience rising delinquencies and tighten lending standards. Credit contracts further, which means even fewer buyers can qualify for home purchases, which reinforces the decline in new home sales that started the sequence in the first place.
This feedback loop is the transmission mechanism. It is how weakness in residential construction spreads from the Cyclical Economy into the Aggregate Economy. And it is why the statement “housing is the business cycle” is true, but only when you are referring to the entire sequence, including construction activity and employment. Not building permits and not home prices in isolation.
Each metric moves at a different point in the sequence, and reading them in order is what gives you foresight. Reading any one of them in isolation is what gets you in trouble.
Transition to Home Prices
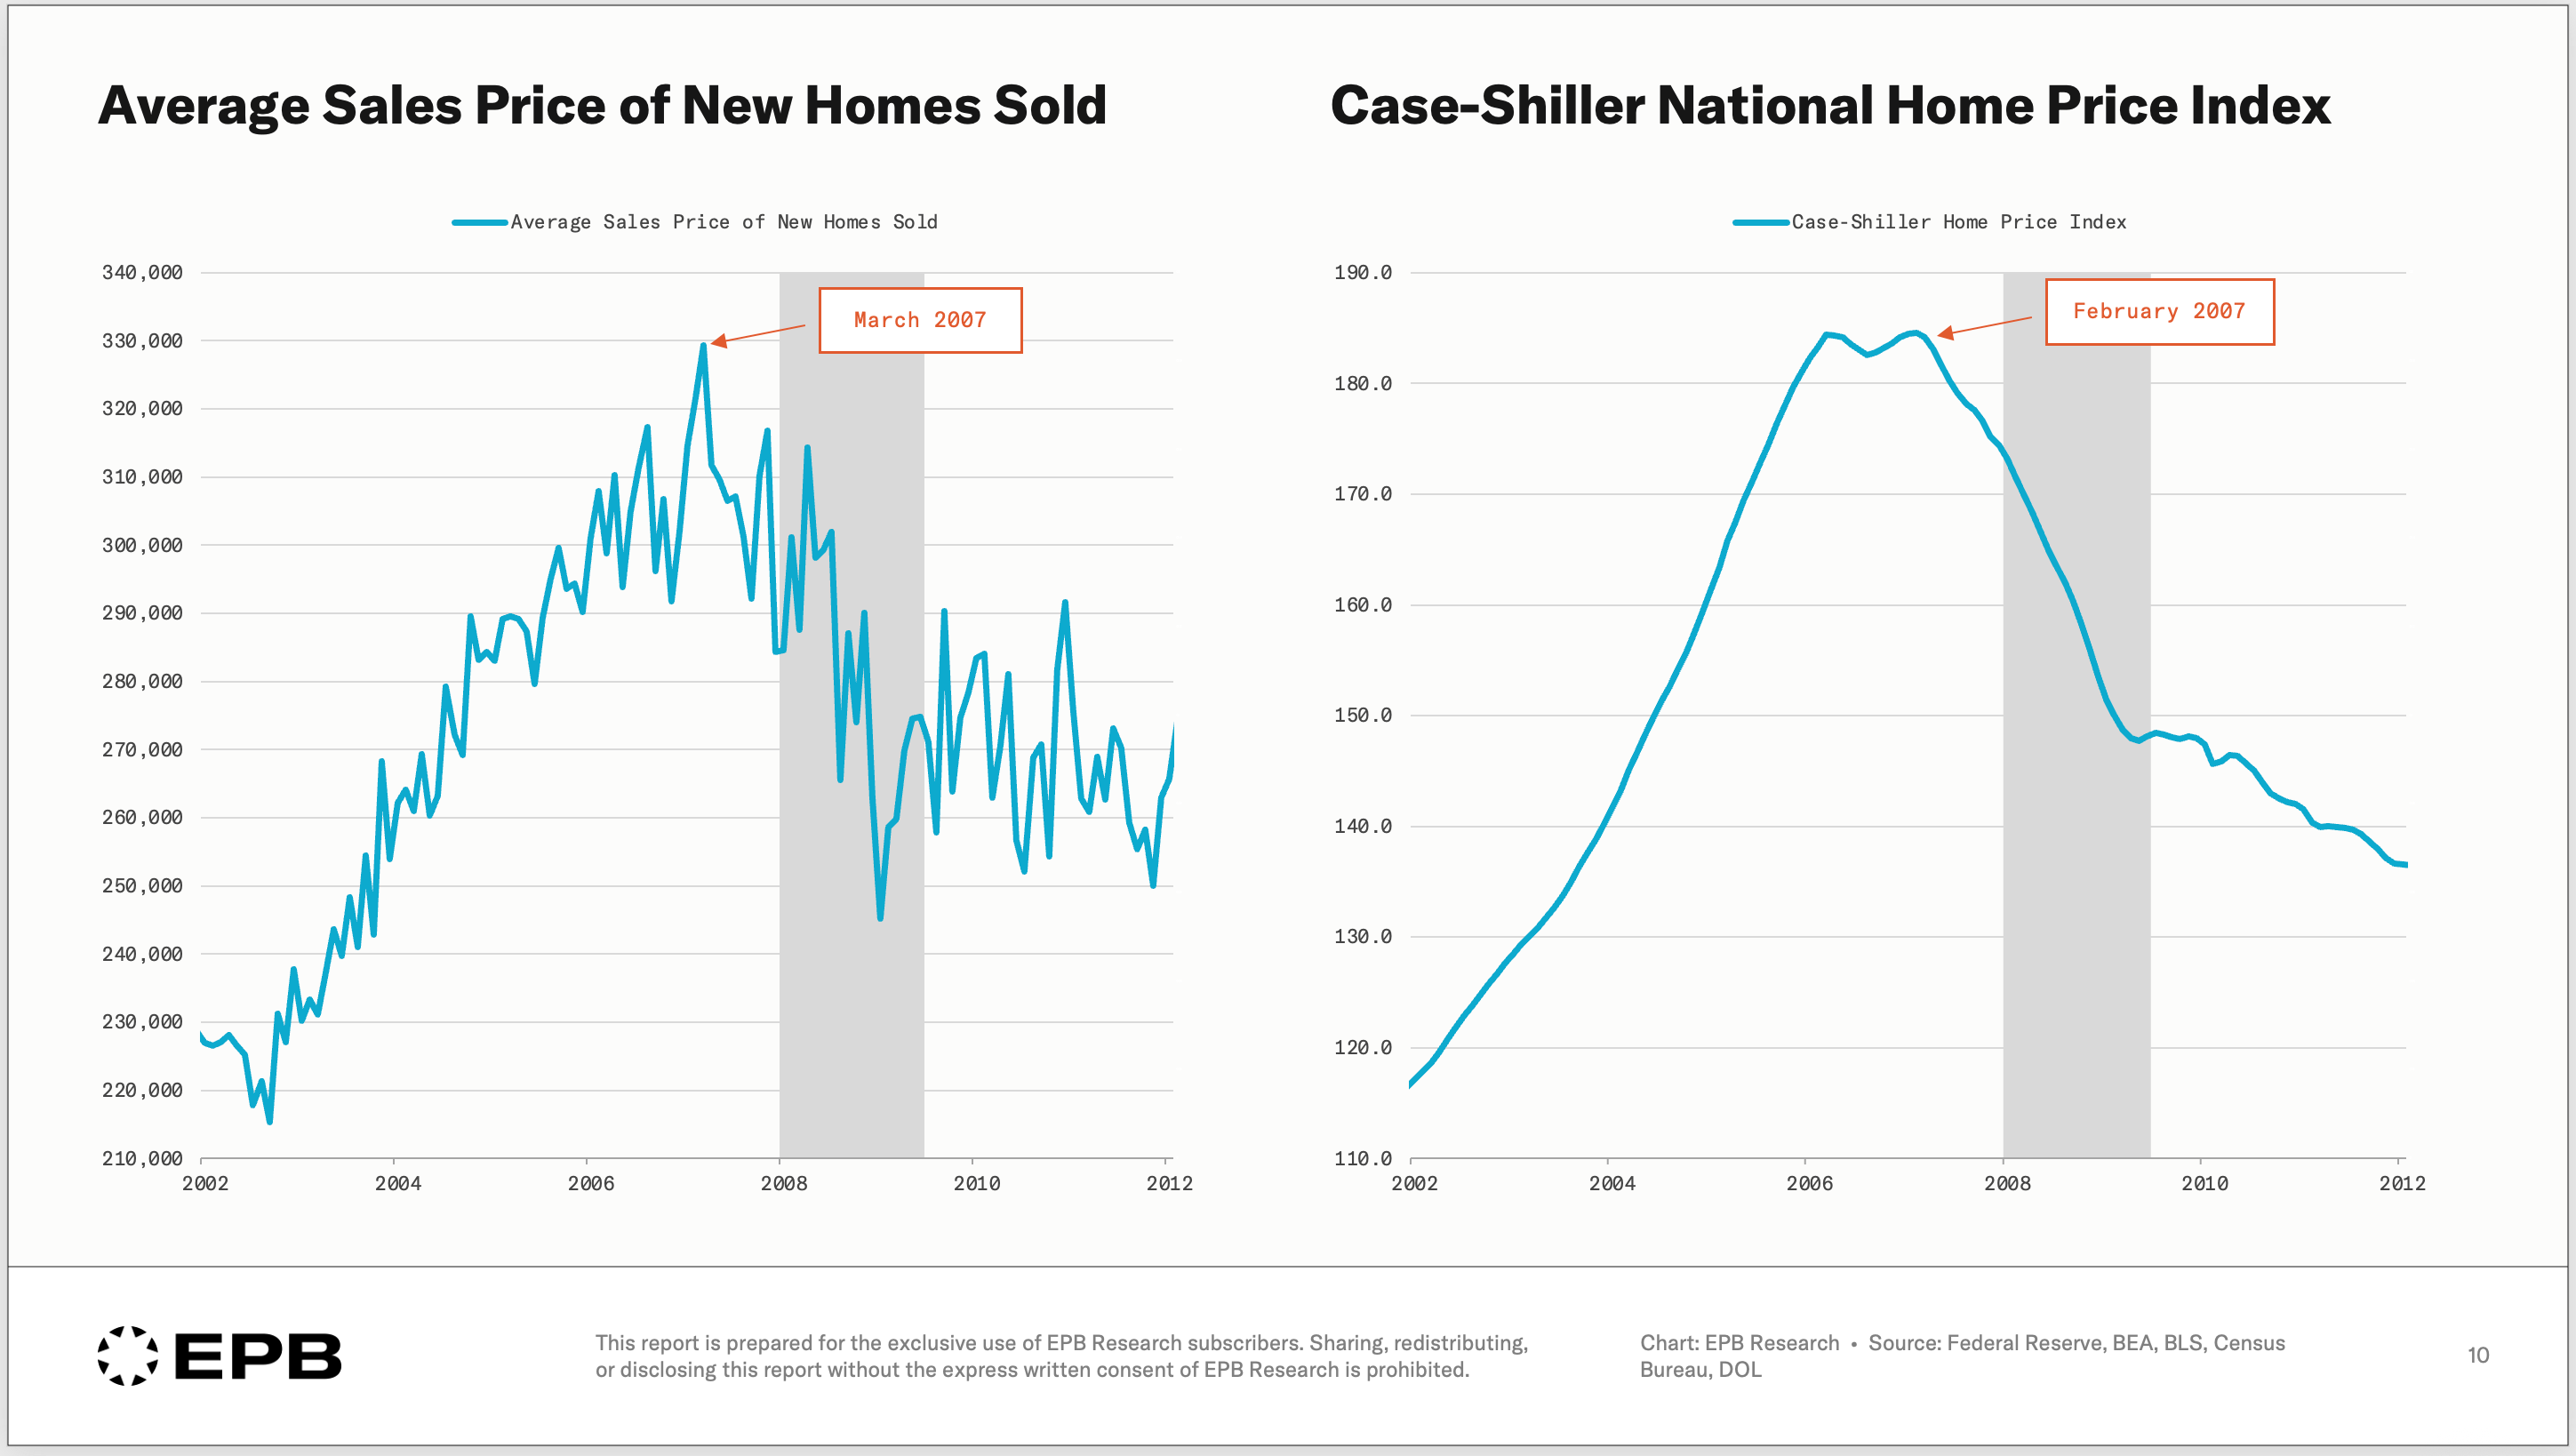
Home prices peaked in early 2007, almost two full years after new home sales peaked. Sellers resist cutting prices even as every other signal has deteriorated. Inventory builds. Days on market stretch. And only after sustained pressure do prices adjust, usually related to the labor market or job losses, which is why it is a critical piece of the puzzle.
This is not unique to 2007. It is how the sequence works in every cycle. Home prices are a lagging indicator. They confirm what the earlier parts of the sequence already showed. They do not predict what comes next.
Most people watched home prices through 2005 and 2006, saw them still rising, and concluded the housing market was healthy. Meanwhile, the leading and cyclical indicators had already turned. The sequence had been running for over a year. By the time prices confirmed the downturn, the opportunity to position ahead of it had long passed.
Where We Stand Today
So now that we have this sequence in mind, at least at a high level, we can run it through today’s data to see where we stand.
We outlined the sequence as a process that flows from monetary tightening to new home sales and building permits, then into housing units under construction and employment, and then into home prices. Home prices acting as the lagging indicator that responds to oversupply and weakening demand through labor market stress.
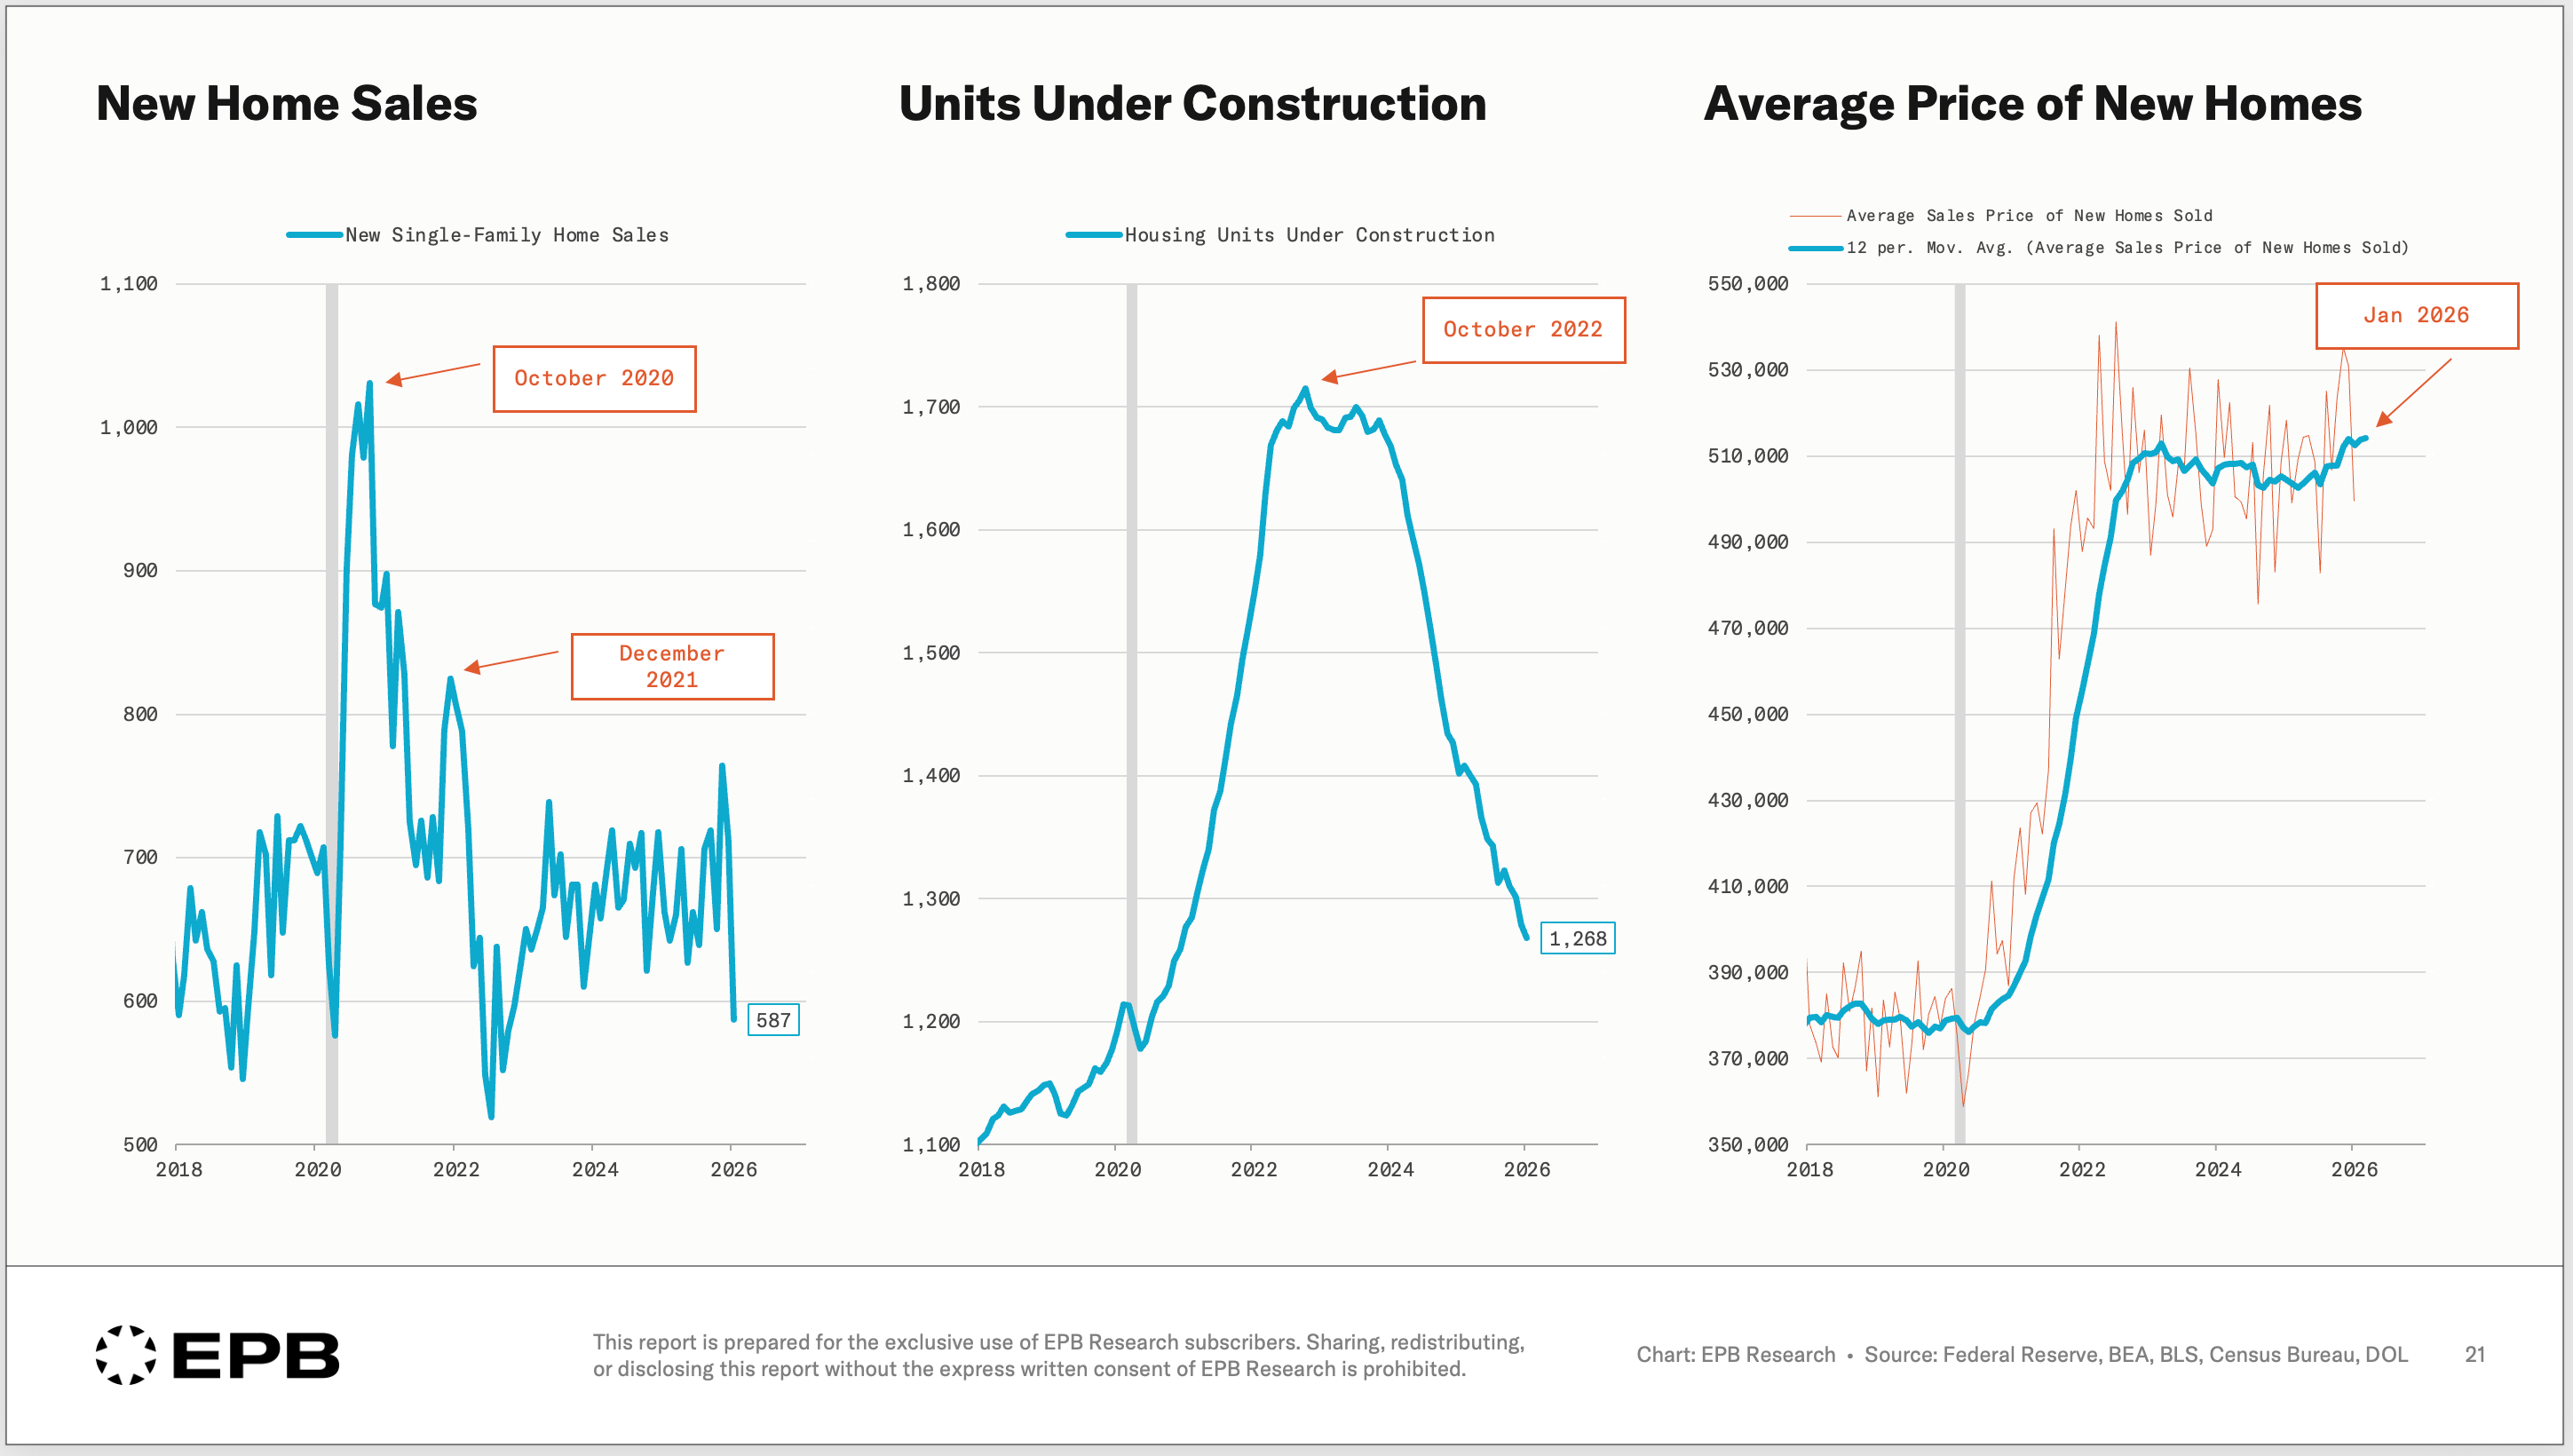
New home sales peaked in 2020, but this was strongly related to the initial reaction during the pandemic. New home sales had a secondary peak in late 2021.
Building permits peaked at the start of 2022, a few months later. Both new home sales and building permits have not staged significant upturns yet.
The number of housing units under construction had an official peak in October 2022, but stayed elevated until the start of 2024. This one year period where units under construction were stalling but not declining was a big reason why this cycle has taken a long time to play out.
Historically, housing construction peaks were more abrupt than gradual, sweeping ones.
Housing units under construction remain in a forceful downturn. With less construction activity comes less demand for residential housing employment.
This is the most critical step of the sequence today. We noted that housing units under construction didn’t really start to slide until the start of 2024 and this is when residential building employees peaked. However, we simply have not seen a huge decline in residential building employment.
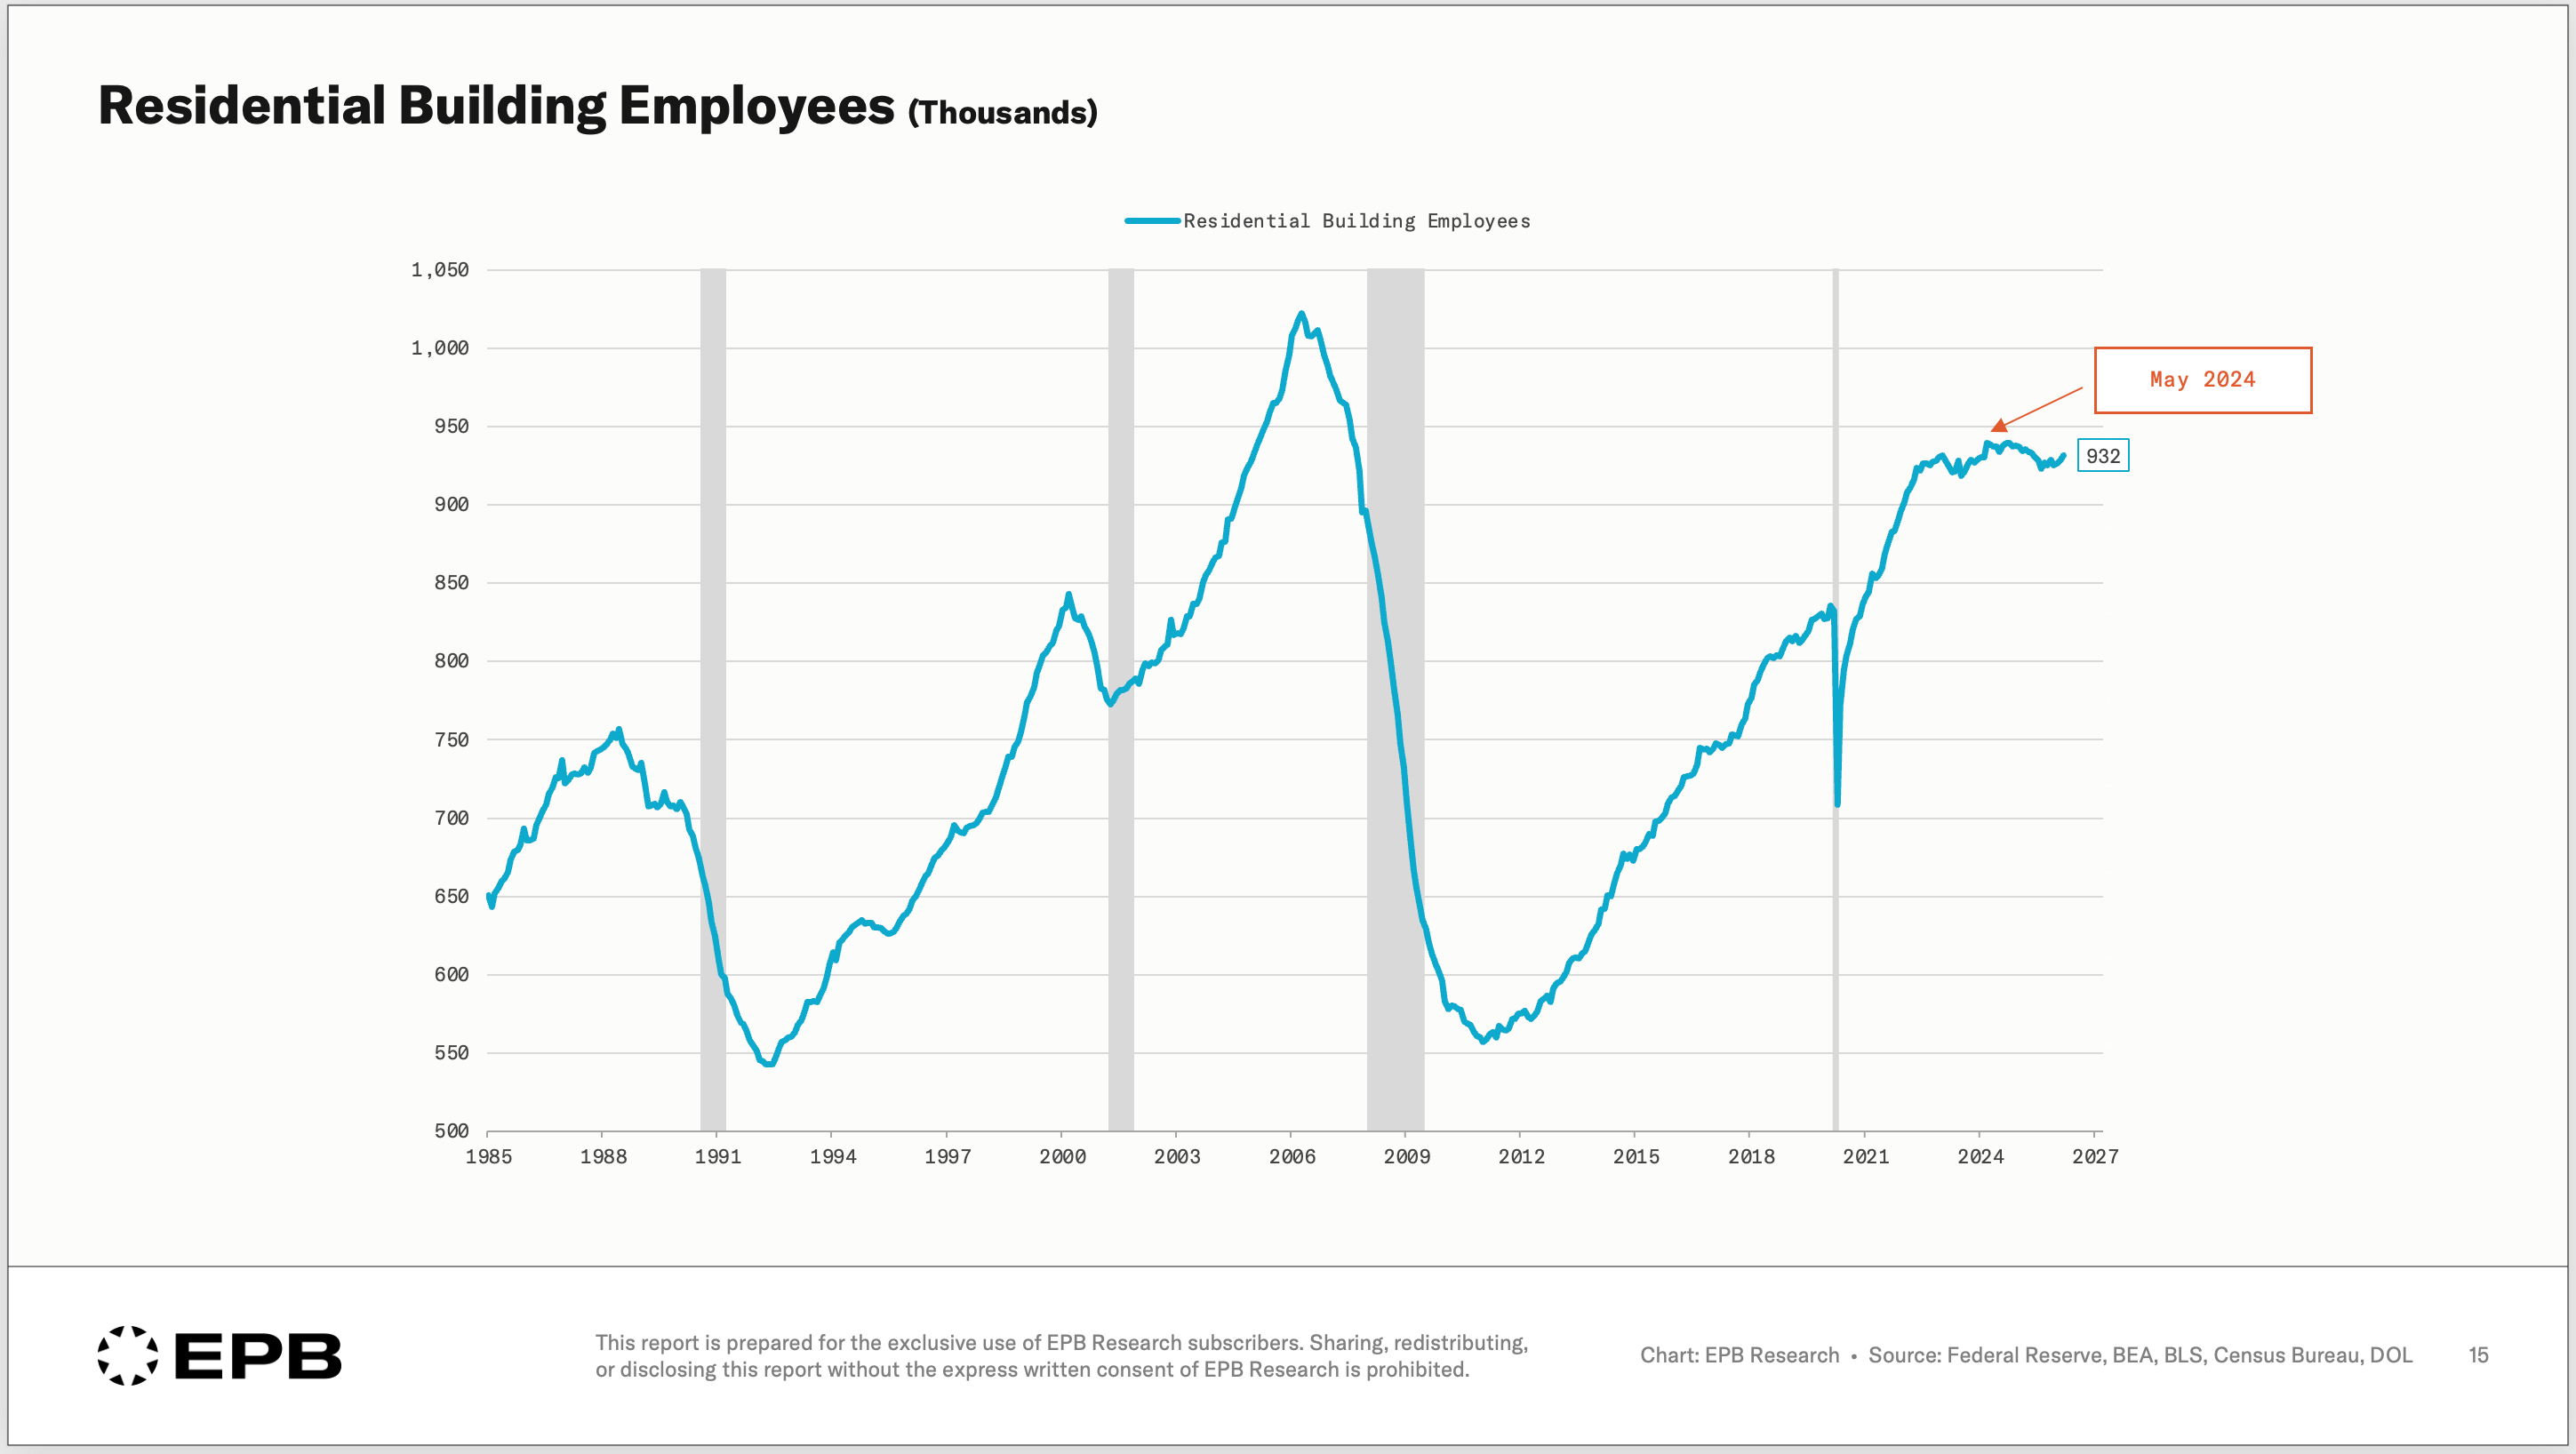
Certainly not the level of decline that occurred in past cycles when construction activity fell, and this is the absolute most critical variable in the entire economy today. Without a decline in housing-related employment, the rest of the cycle cannot complete. The next domino won’t fall.
There’s not enough downstream stress created from early stage unemployment in cyclical areas.
The average sales price of a new home hasn’t declined much from peak. It’s a volatile series, and if we smooth the data, average new home prices haven’t turned down, which makes perfect sense with the sequence.
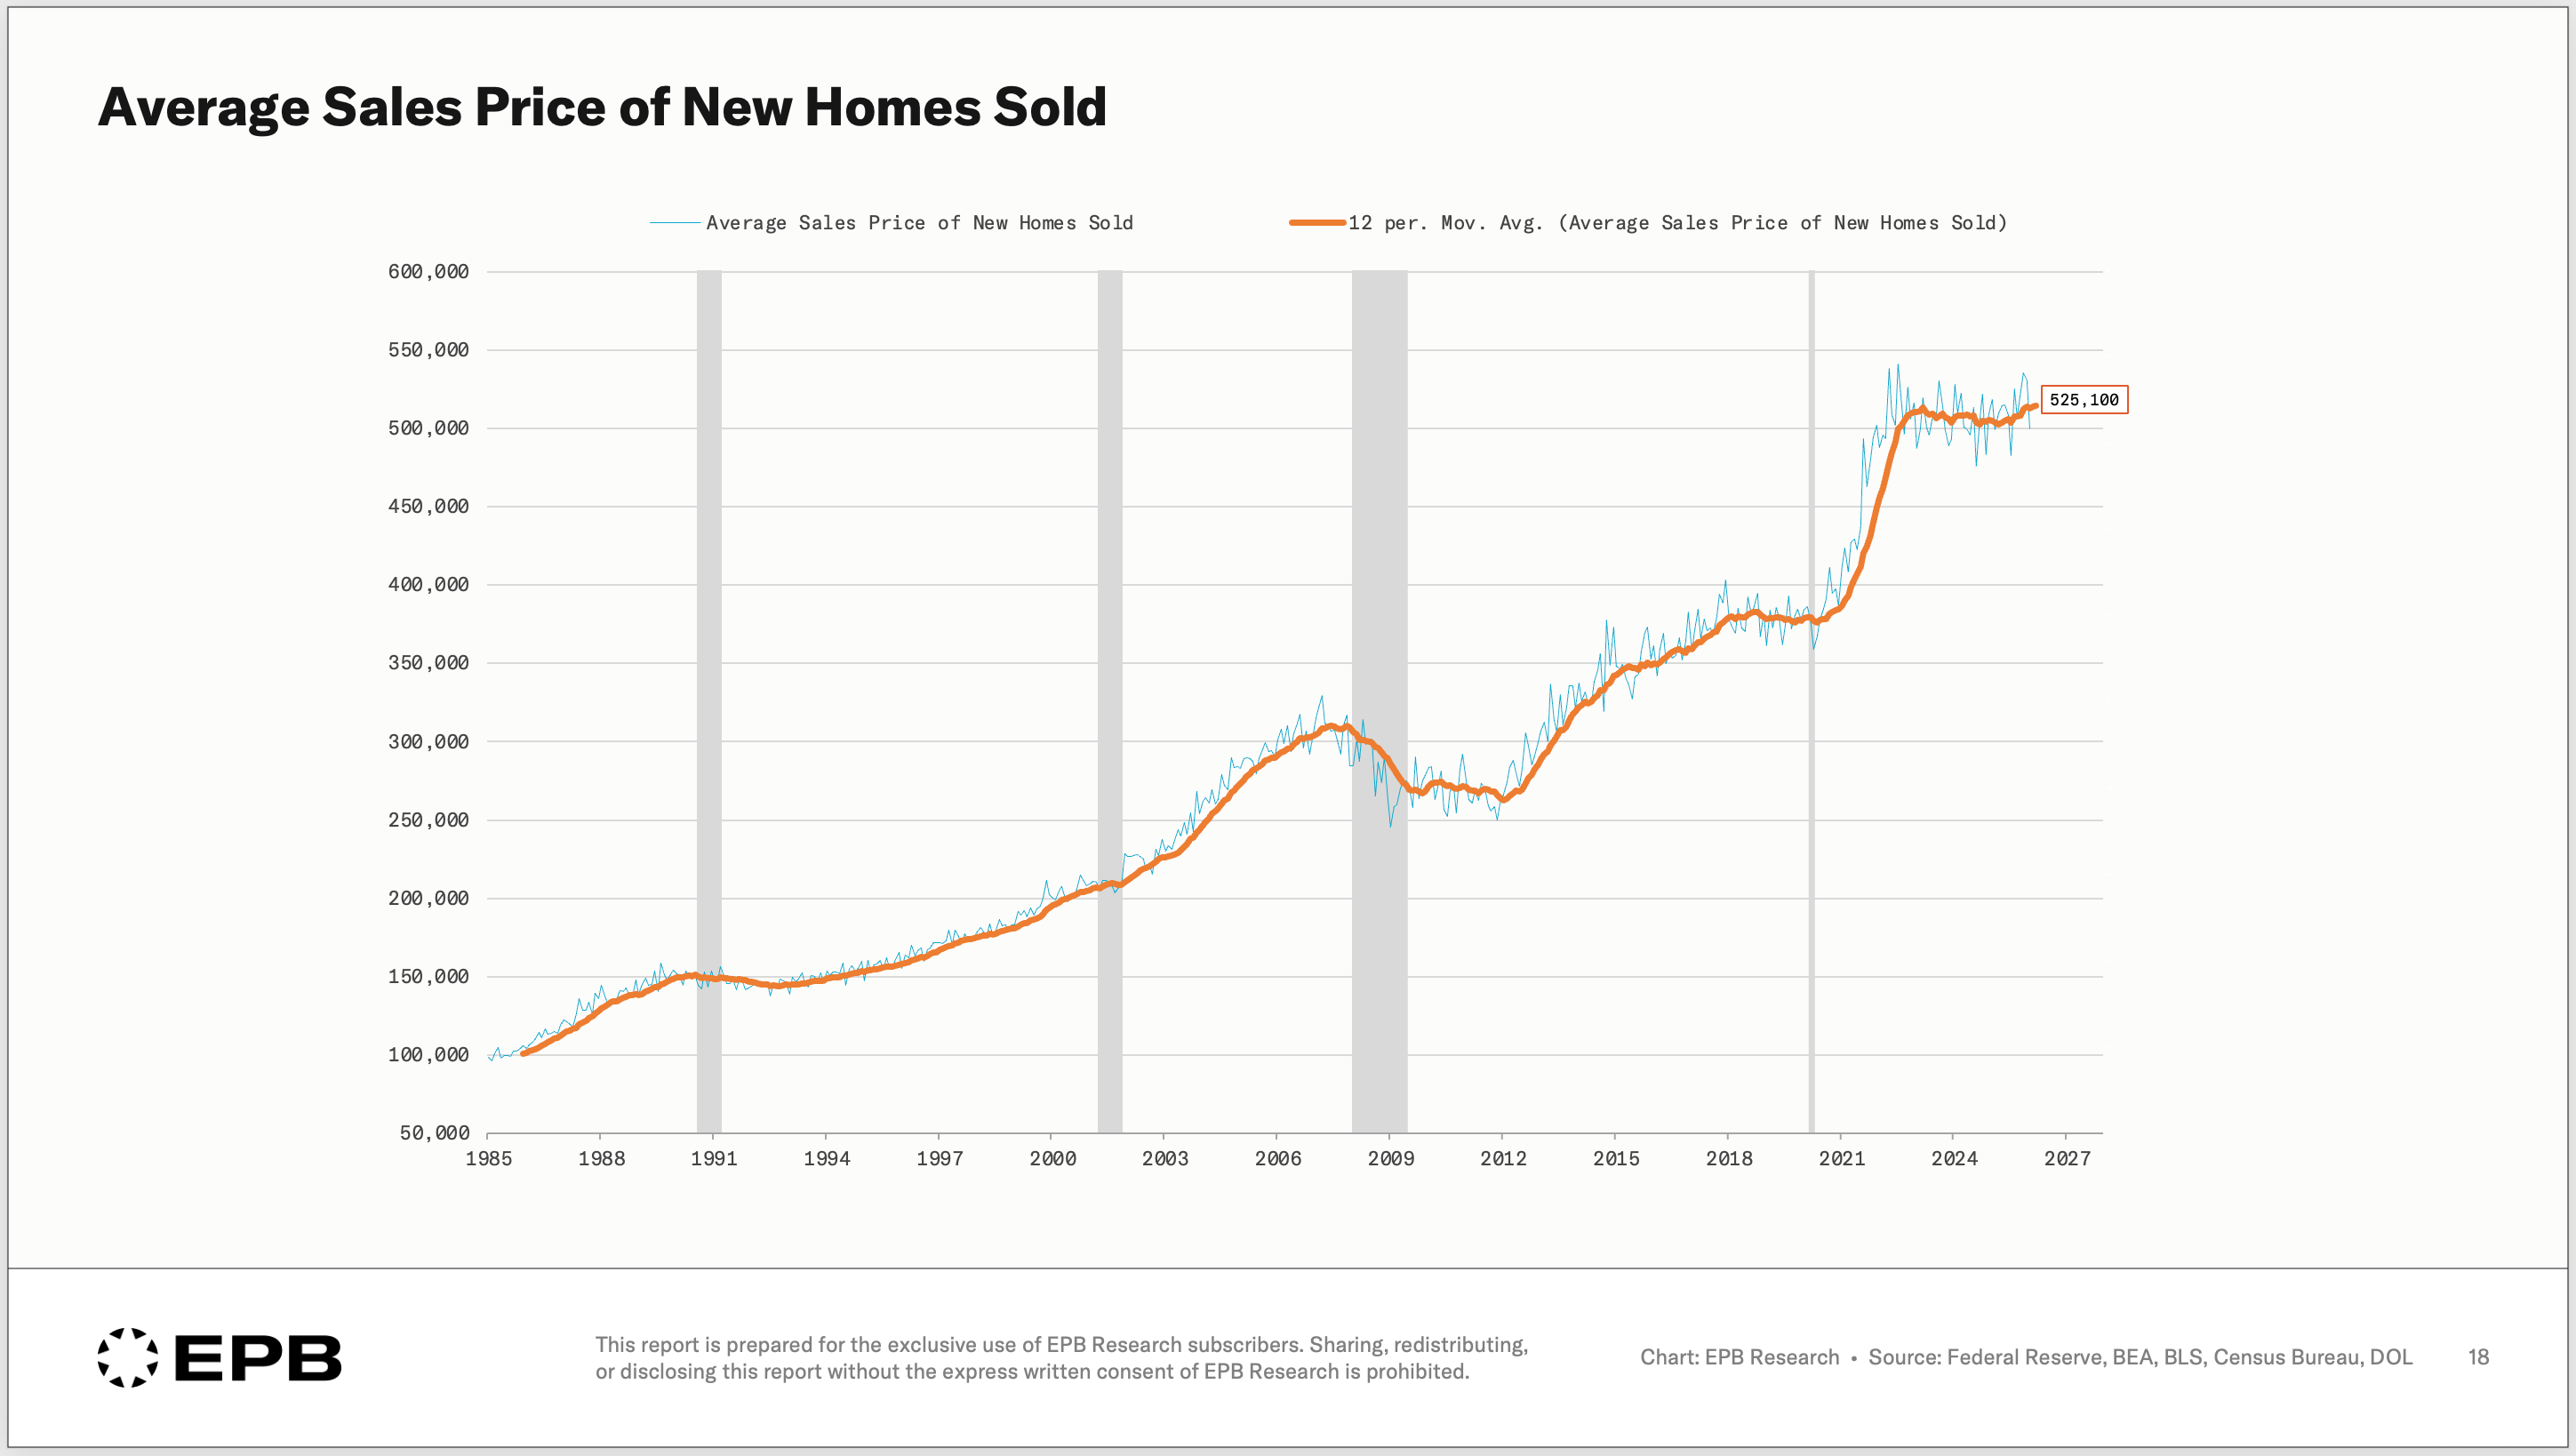
Prices have stalled, and housing is absolutely regional.
There have been some strong declines in new home prices in parts of Texas, Florida and areas with an oversupply of building.
The regional discussion is important and a topic for an entire article, but the national data is what we’re focusing on in this breakdown - and how it relates to the broader economy.
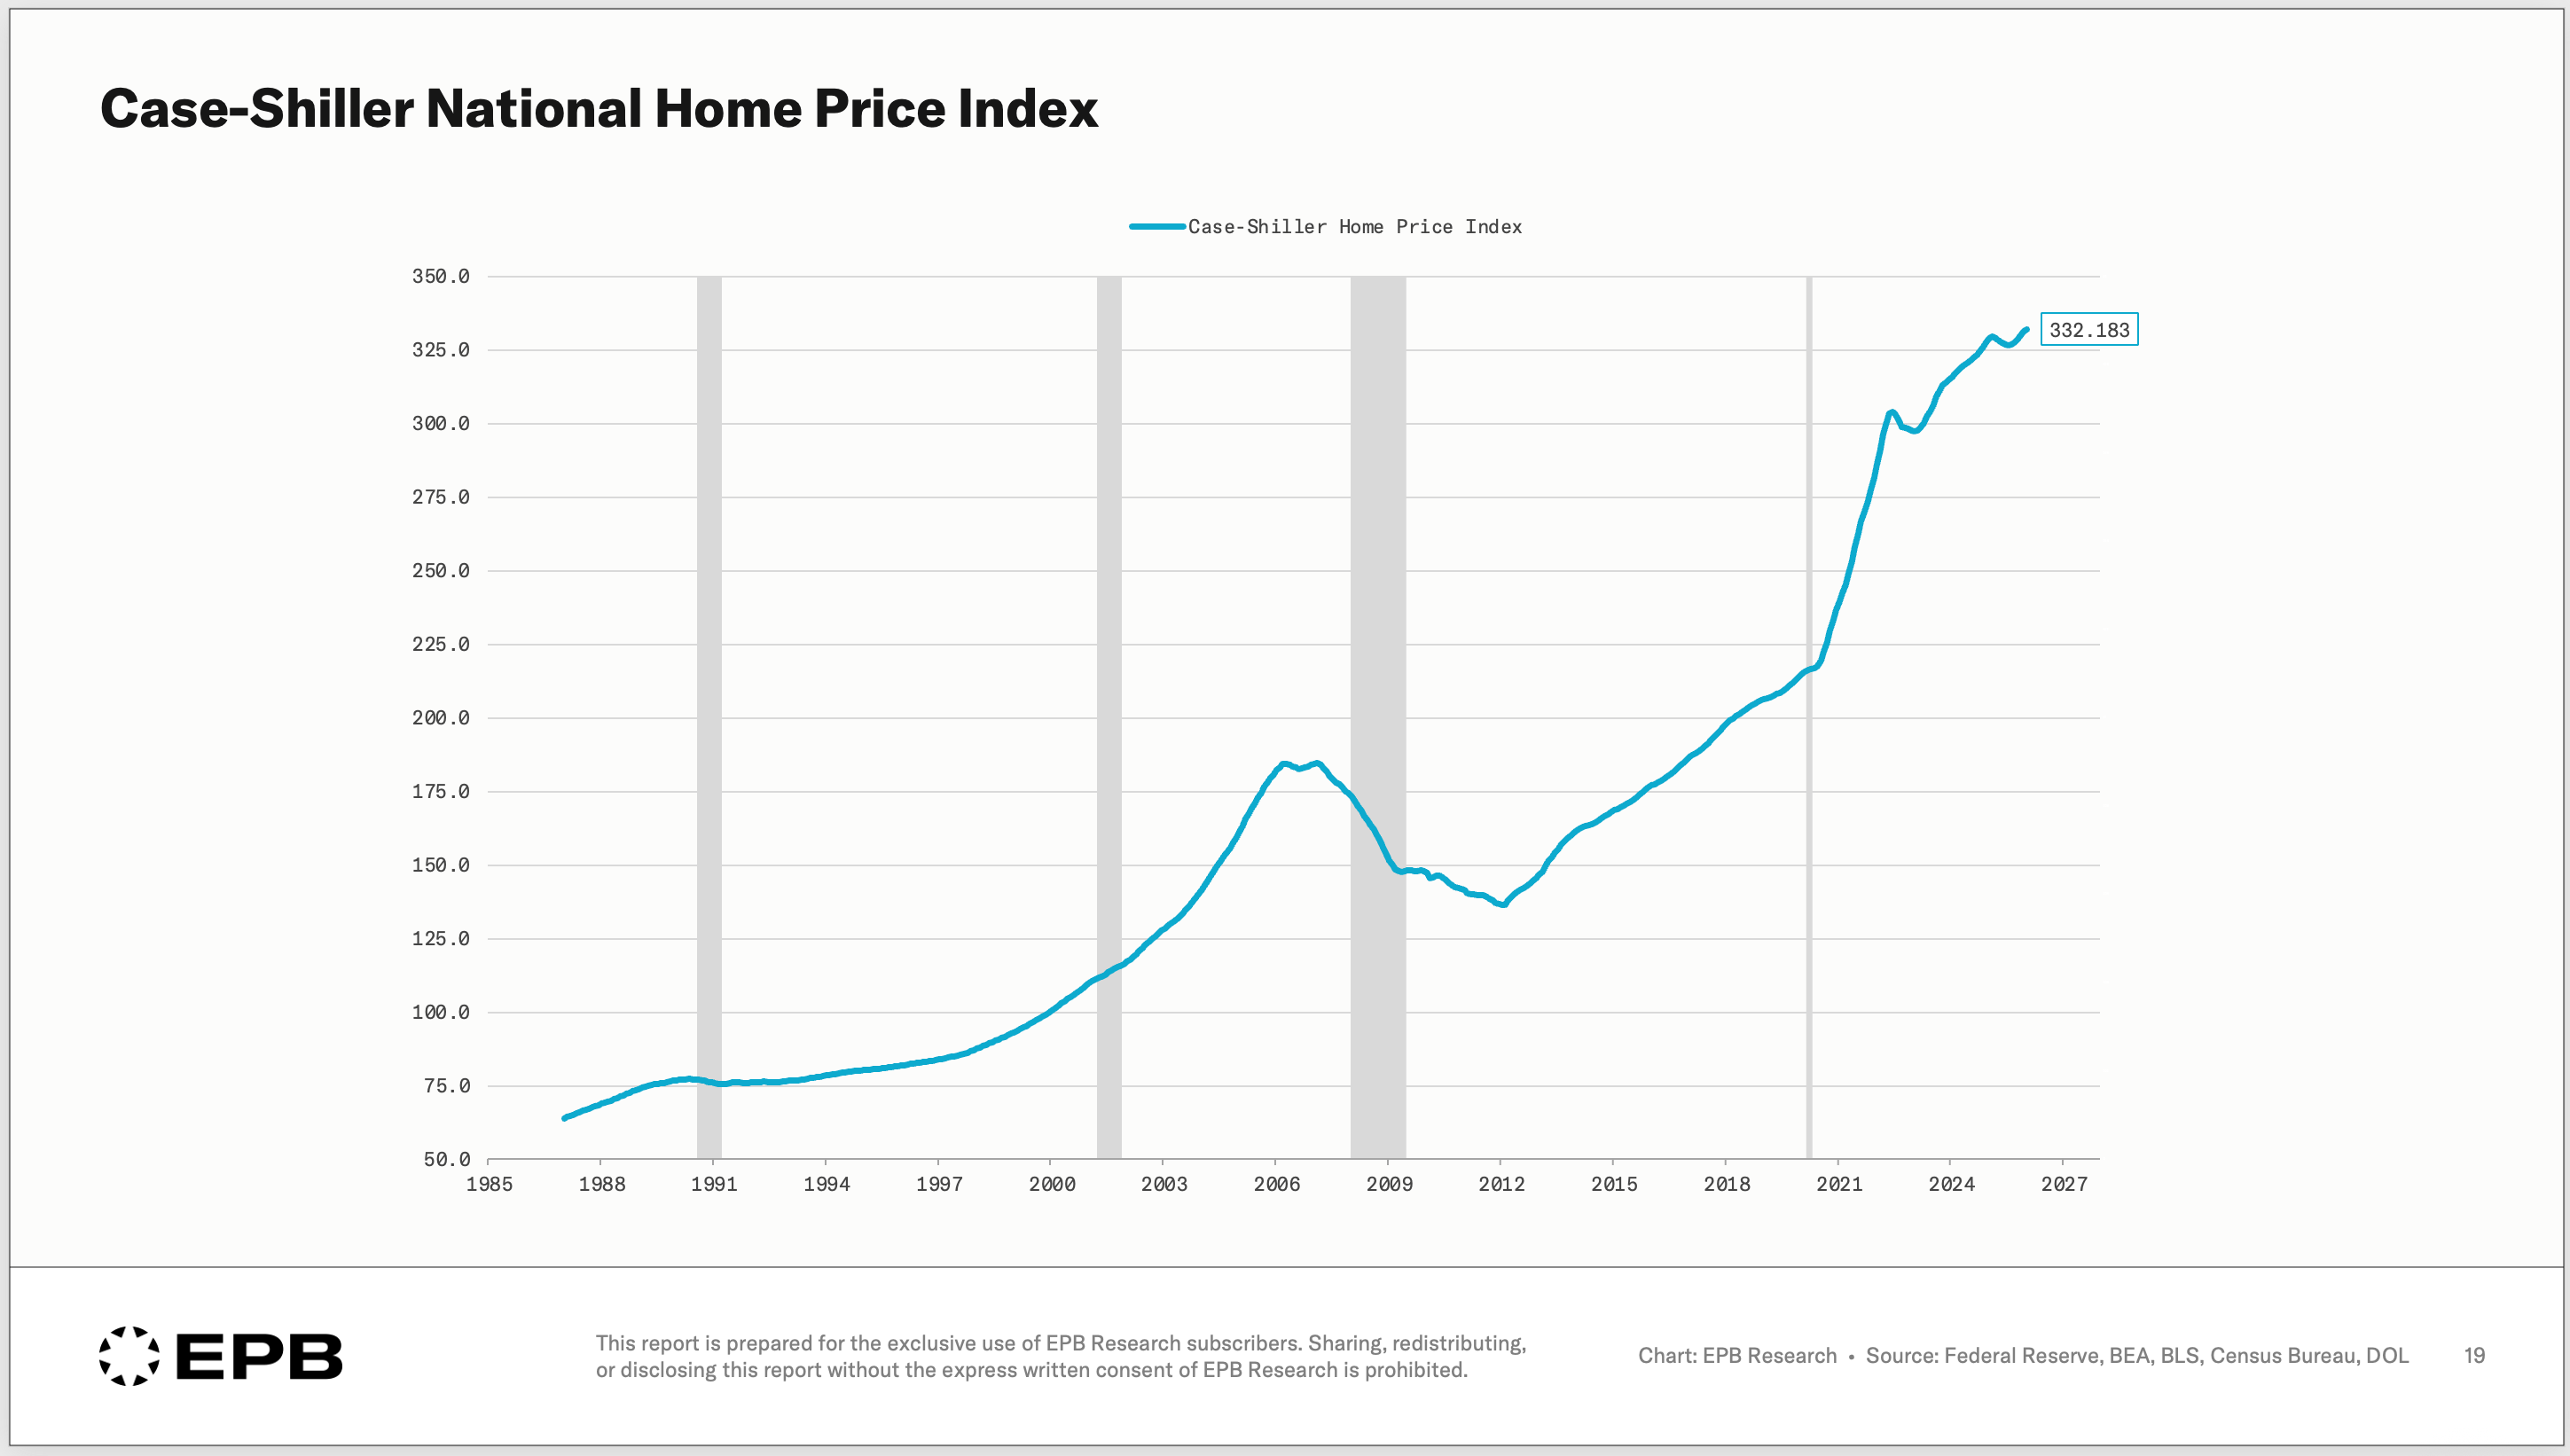
The Case-Shiller National Home Price Index, which tracks existing home prices rather than new home prices, is also at a cycle high, consistent with the sequence outlined and the fact that the home price domino cannot completely fall without the employment domino falling.
We will dive into the reasons why employment hasn’t moved as much as you would have expected, given the magnitude of the construction decline, in future posts.
The main takeaway from this analysis is the sequence or the order of events in which the housing cycle moves and how that plays into the broader business cycle.
Monetary policy has impacted the pace of new home sales and the level of new building permits. This led to a sharp decline in housing units under construction and, so far, just a small decline in the associated residential construction employment. This is where we are today.
Home prices on a national level will remain elevated until that employment domino fully declines.
There will continue to be huge regional differences in home prices, and that’s an important conversation, but for now, you know exactly where we stand in the national housing cycle.
We track this entire sequence and provide updates every month in the EPB Business Cycle Trends Report and our specific Residential Construction Report.
If you want the condensed version of this housing sequence in a quick reference guide, so you can track it yourself, download the free housing sequence guide using the button below.
If you found this breakdown helpful, please consider sharing it with your network.
The sequencing framework here is the most useful thing you can hand someone who keeps asking why prices haven't crashed yet — because the honest answer is that the employment domino hasn't fallen, and without that, the price domino structurally can't. That's not a prediction, it's just how the cycle works, and EPB lays out the historical pattern clearly enough that you can track it yourself in real time rather than waiting for someone to tell you what already happened. The regional divergence point is worth sitting with too: national averages are masking some genuinely stressed submarkets in oversupplied Texas and Florida metros where the sequence has moved further along than the headline numbers suggest. The piece doesn't tell you when — and it's honest about that — but it tells you what to watch and in what order, which is a more durable tool than a price forecast. For anyone trying to time a purchase or position a portfolio around where housing goes next, the residential construction employment number is the one variable worth tracking monthly right now. What are you seeing in the regional data that suggests which markets are furthest along in the sequence?
I work in heavy civil construction (roads, water and sewer). Contractor bids have come down a lot and each project is receiving more bids. Based on our conversations with contractors the bid reduction is primarily coming from margin compression. So the past few years they were making a lot of money. The high number of bidders is the first sign there isn't enough work out there. Then prices come down and then eventually fewer bidders. I do agree that this cycle seems to be going in slow motion. Thanks for the great article.