

The Residential Housing Cycle Has Turned
A detailed trip through the sequence of the residential housing cycle: from monetary policy to home prices.

The residential construction cycle is the most important part of the US business cycle, next to manufacturing. Residential construction is highly cyclical, sensitive to changes in monetary policy, and often the first major sector to start a boom or bust.
Many investors and market participants fail to understand that residential housing moves in sequence, like the overall business cycle, and that residential construction does not directly mean home prices.
A sequence evolves through the housing sector that starts with changes in monetary policy, moves through sales volumes and permits, then into actual construction activity and employment, and finally into home prices.
Home prices lag, like inflation, so a downturn in residential construction does not immediately cause a drop in home prices.
In this post, we will go through this sequence, starting with changes in monetary policy, moving through to building permits, analyzing construction activity, breaking down the movements in construction employment, and lastly discussing some national and regional home price trends.
Changes in Monetary Policy
A tightening of monetary policy ignites a downtrend in the residential cycle. This chart shows “real true money supply”, a measure of inflation-adjusted money supply we use at EPB Research.
Peak monetary easing was in February 2021, and major tightening began in mid to late 2022. Monetary policy has been tight, as evidenced by contracting real money supply, but the stock or excess money relative to the pre-COVID trend is likely what has made this downcycle drag out longer than usual.
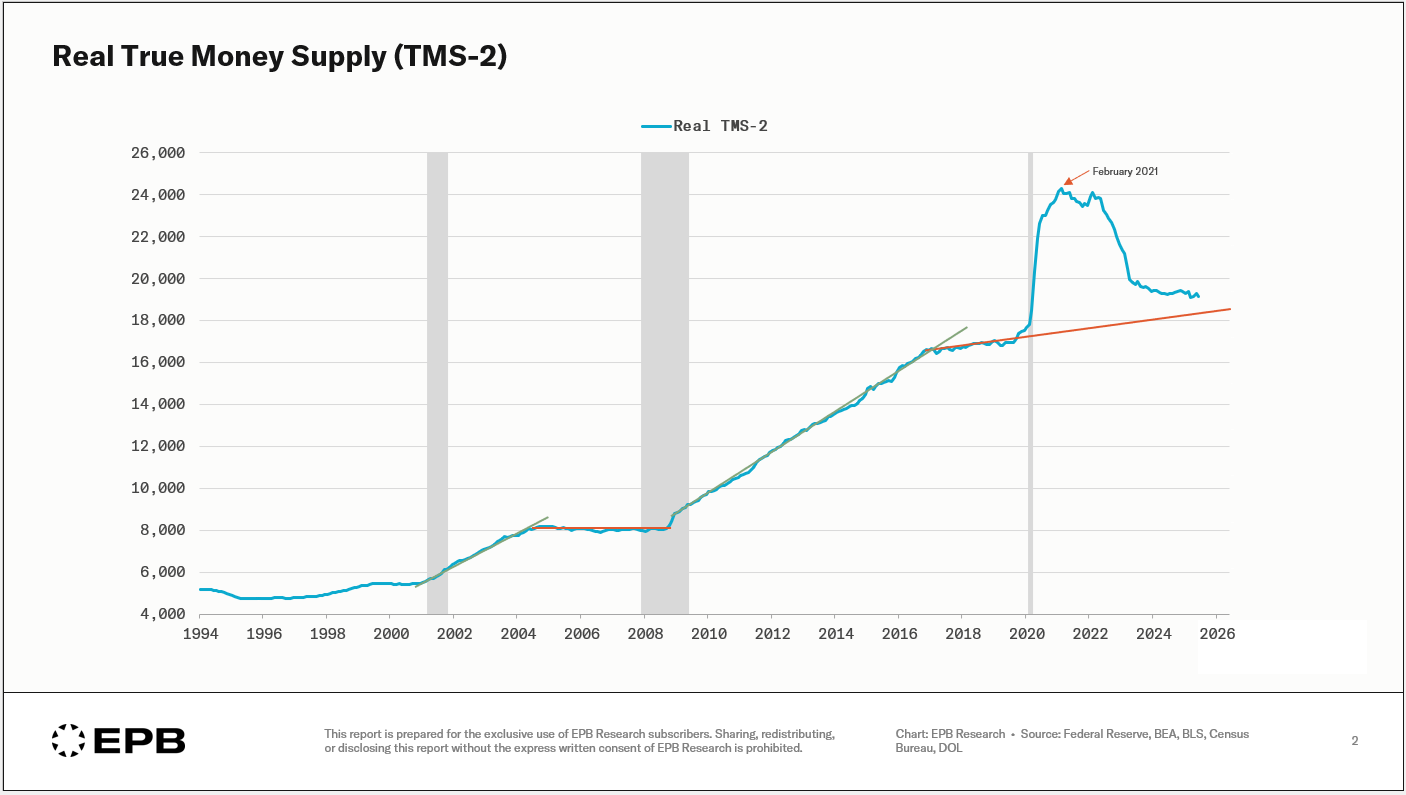
As the Fed has kept policy tight, excess money, even relative to the muted pre-COVID trend, has been virtually eliminated, which should accelerate the downward momentum that’s already in place.
Permitting Activity
After monetary policy tightens, the first thing to move is sales volumes as well as applications for new building permits.
The peak in easy monetary policy was in February 2021, and building permits peaked three quarters later in December 2021.
Due to the excess money referenced in the above chart, it’s been a slower grind down, but building permits have not stopped with the downward momentum.
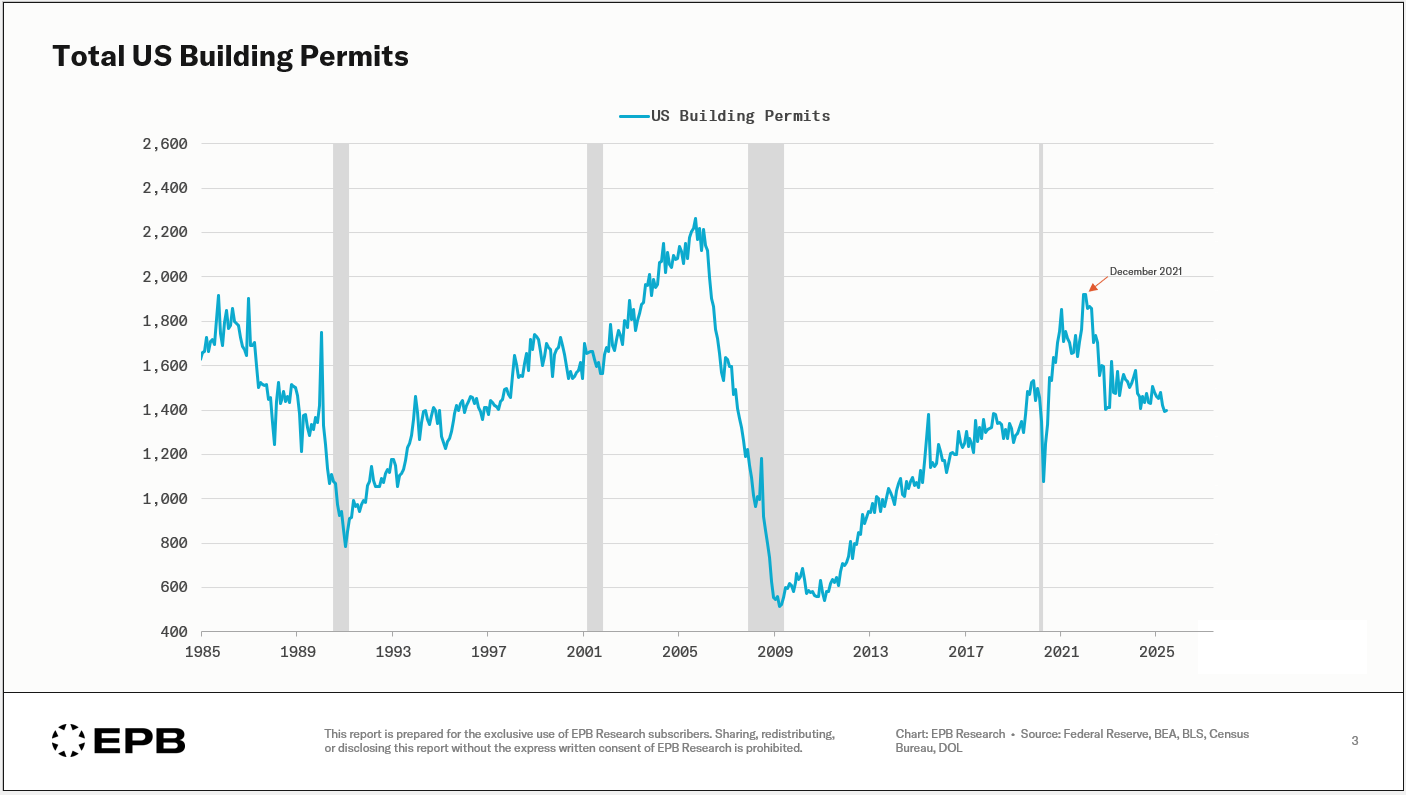
As monetary policy remains tight, as evidenced by the still contracting money supply, sales volume will remain weak, and applications for new permits will continue to drop.
Actual Construction Activity
Building permits can change on a dime since it’s simply an application. The number of housing units under construction takes time to turn since construction activity continues until it’s completed.
Peak monetary easing was in February 2021, building permits peaked in December 2021, and housing units under construction peaked in October 2022.
This is the clear residential housing sequence in motion.
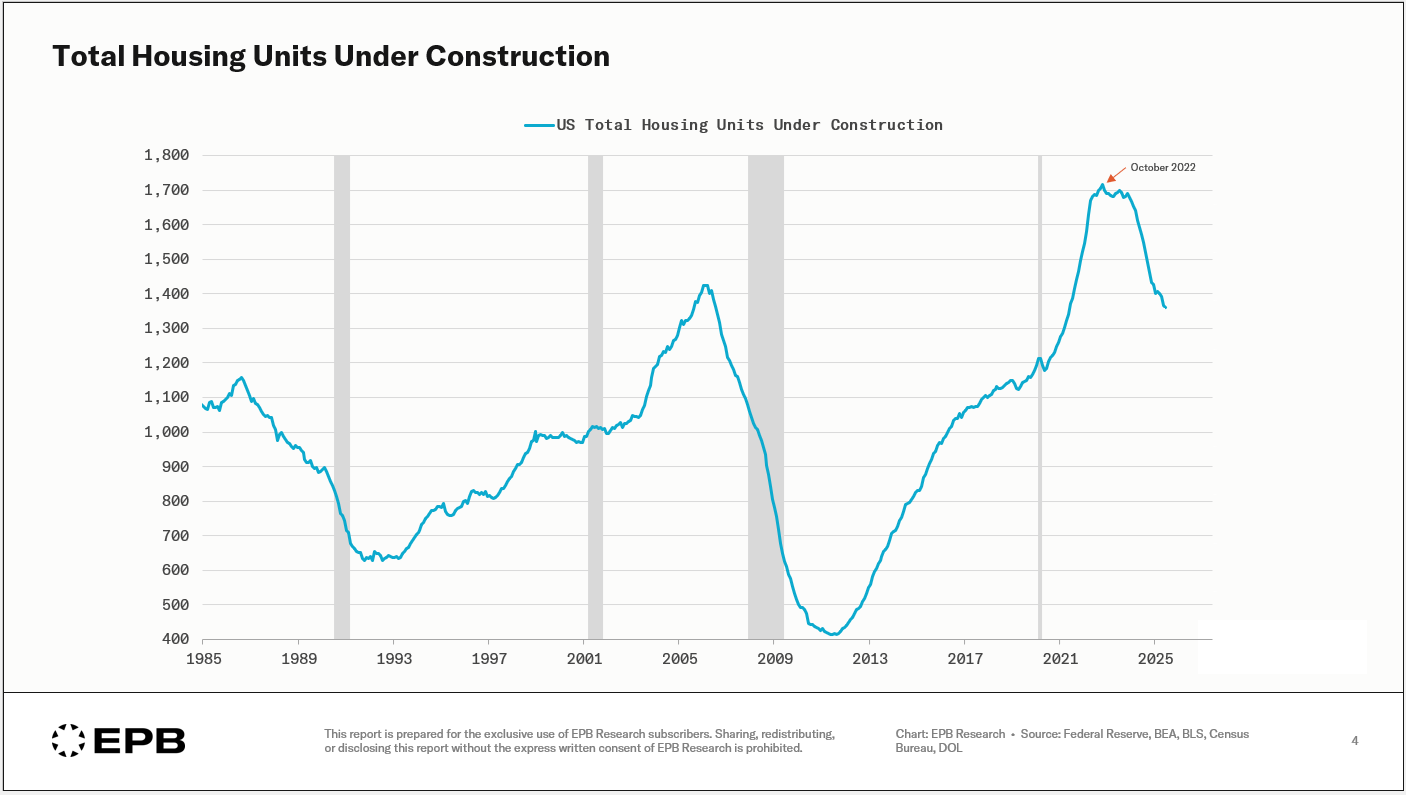
While the level of activity remains somewhat elevated with just under 1.4 million units under construction, the downward momentum is precipitous.
Since monetary policy is still tight, sales volume is anemic, and building permits are still dropping, the number of housing units under construction will continue to slide.
From Activity to Employment
Residential construction employment is split between two major categories, building employment and contractor employment.
Building employment is new building plus general contractors for remodeling, while contractors are the sub-contractor specific industries like plumbers and electricians.
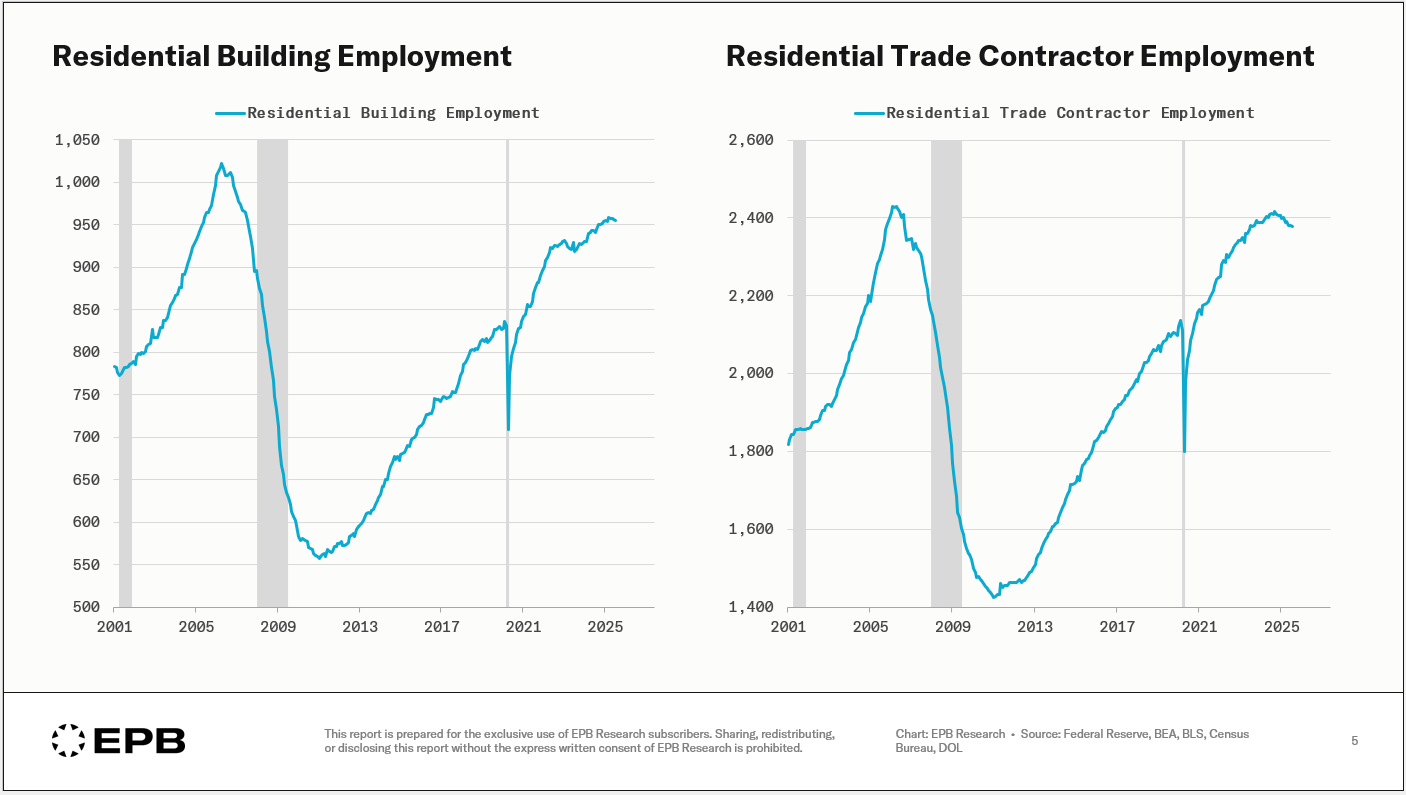
Neither category has dropped sharply, but the sub-contractor employment level peaked in late 2024, while building employment has been more firm.
Why Has Employment Remained Stable?
In addition to a strong remodeling cycle, the second and equally important reason as to why employment has held up better than production in the residential sector is profit margins.
Profit margins for the eight largest homebuilders exploded to the highest level in recorded history after the pandemic, hitting 20% in 2022.
As production or activity levels fell but employment did not, profit margins compressed 600bps down to 14%. Any other time in history, a 600bps compression in margins would have led to layoffs.
However, margins were so high that 600bps compression still left companies with a more profitable position than pre-COVID.
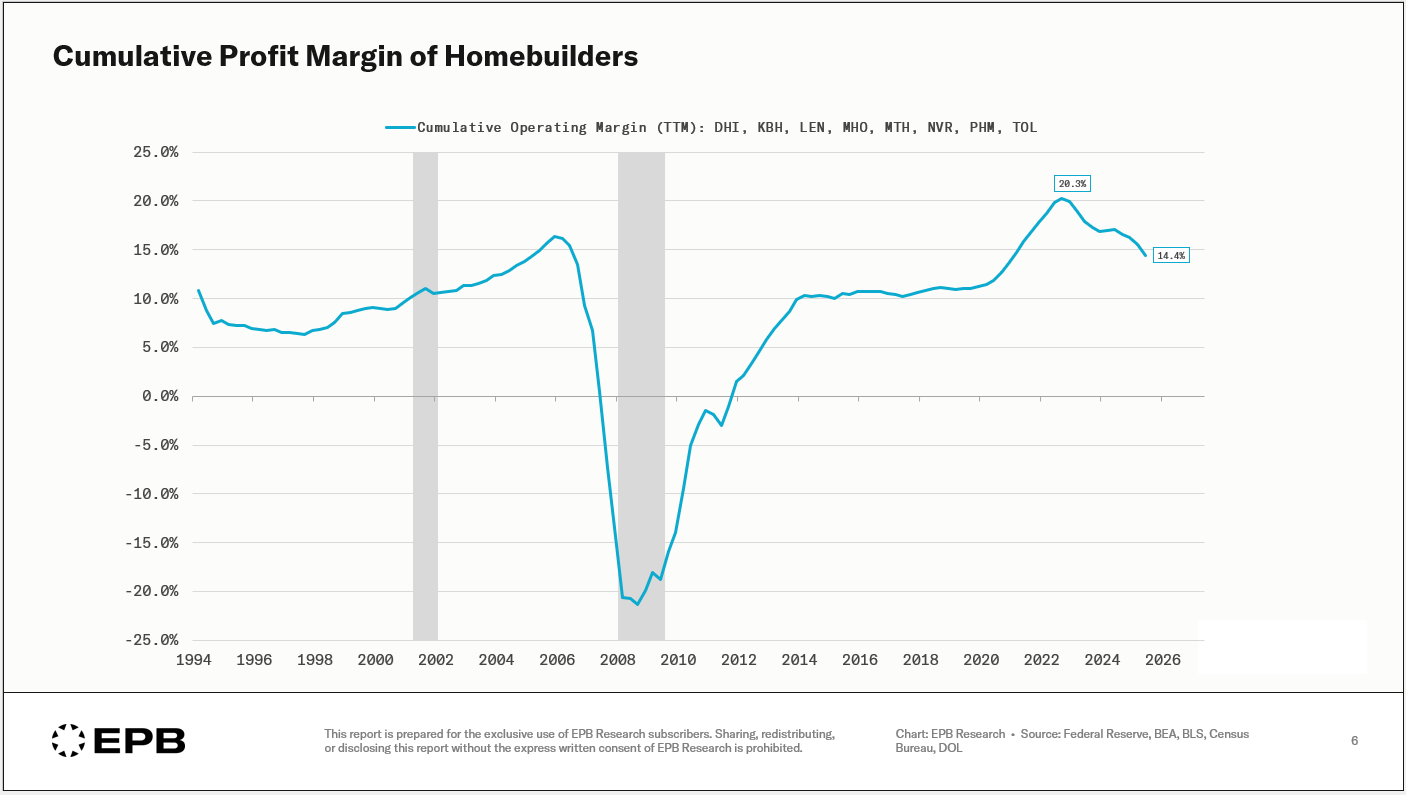
Margins are accelerating downwards, and based on the sequence referenced, it will continue. The extremely important wildcard is tariffs.
The tariff impact has not been extreme in the first half of 2025, but if tariff pressure increases in the second half and companies cannot pass the cost through, margin erosion could potentially intensify further, bringing margins below pre-COVID levels and accelerating the job losses that are just begging to appear in the residential construction sector.
Home Prices: Last In The Sequence
At the end of the residential cycle comes home prices – the last to move, just like inflation in the broader business cycle.
Changes in monetary policy lead to a pullback in sales volume and new permits, followed by a downturn in construction activity, a decrease in profit margins, and then a fall in employment. After employment, home prices suffer, which is what we are now starting to see mildly.
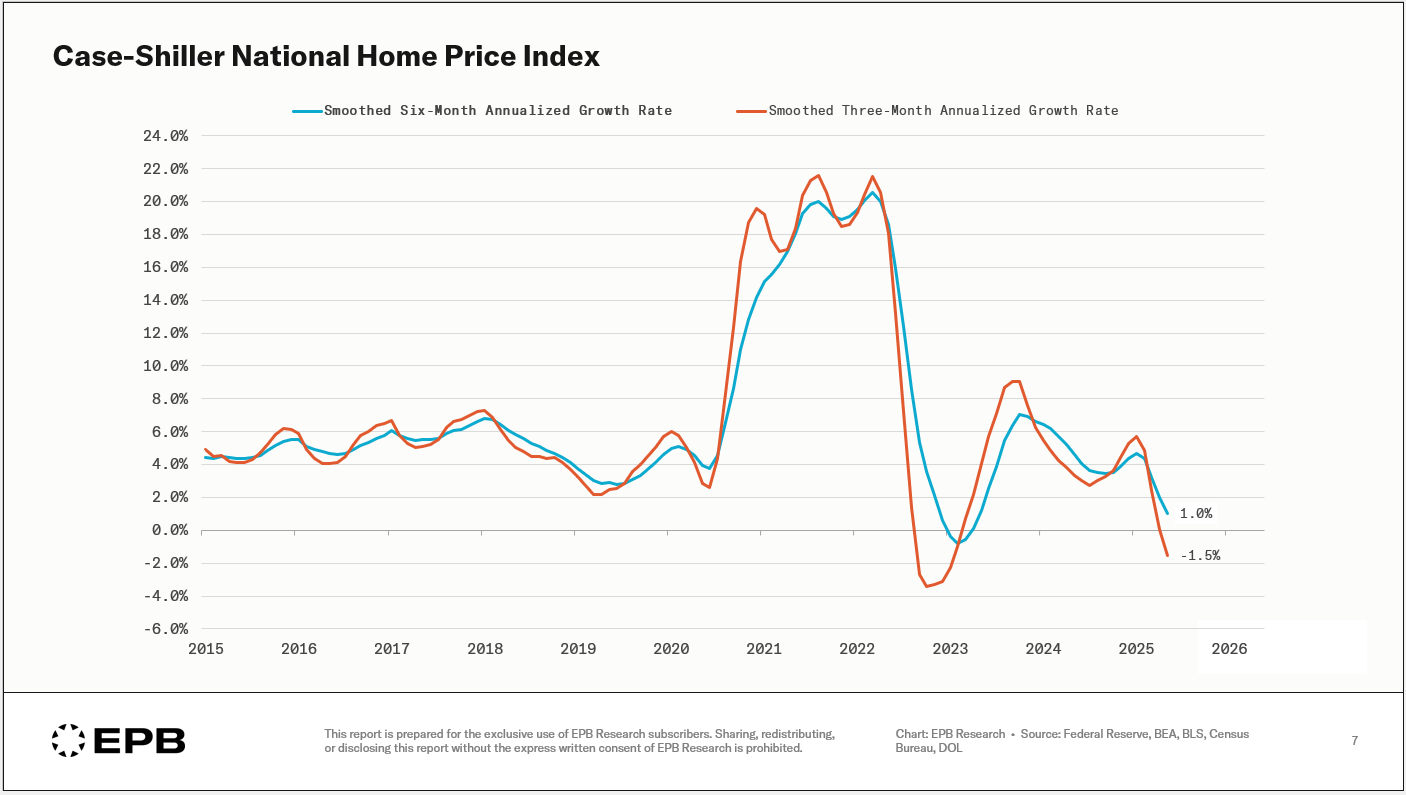
On a 3M annualized basis, home prices are dropping 1.5% but as we know, changes in home prices are extremely regional, and national averages don’t capture the full story.
This cycle has come with the most extreme regional differences in history.
Home Price Trends Are Regional
This chart shows the change in active housing inventory by state for 2025 compared to the average of 2018/2019. Orange colors mean higher inventory levels and prices are susceptible to fall, while green colors mean very low inventory and likely still price increases.
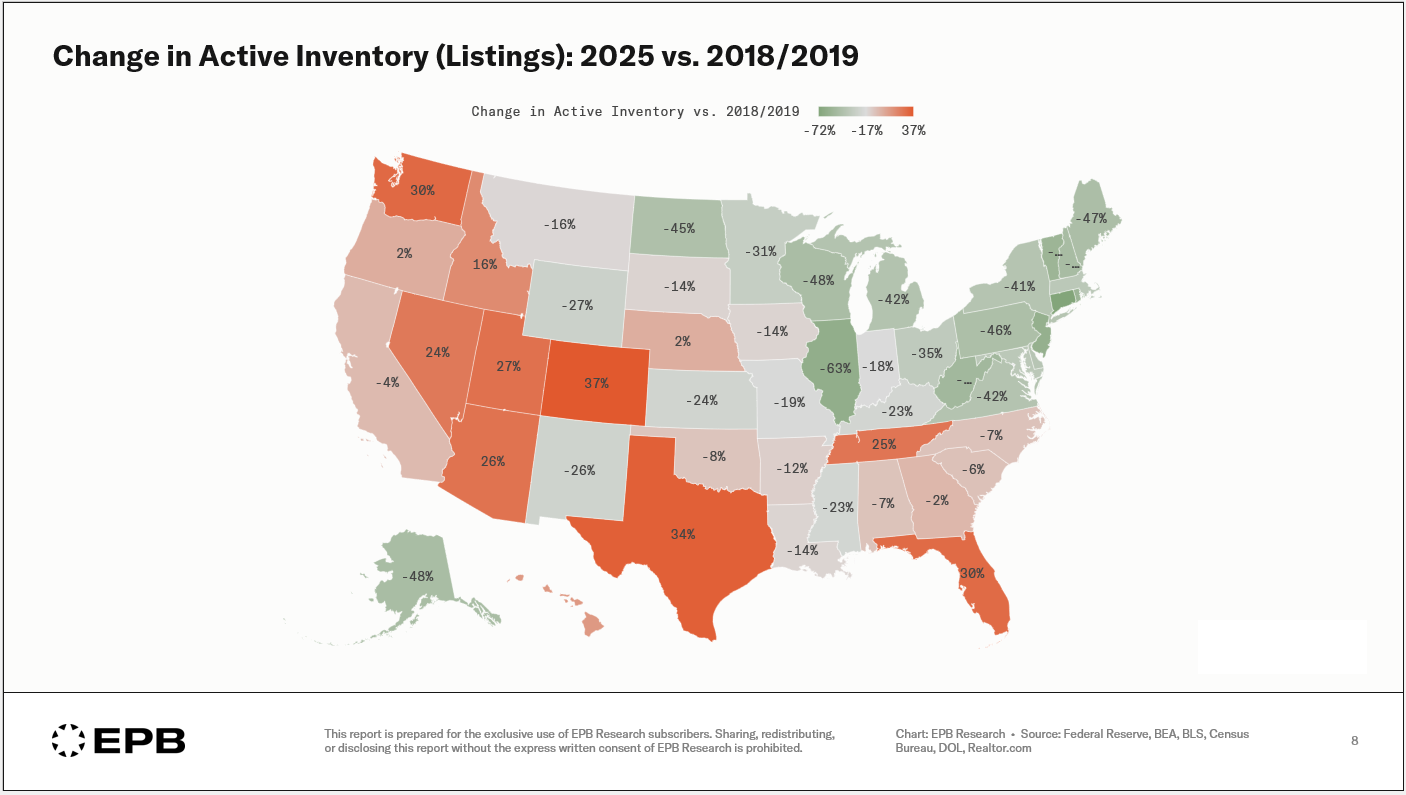
Florida and Texas used to have the highest change in inventory, but Colorado has shot to the top of the list.
Biggest Increase in Inventory (2025 vs. 2018/2019):
•Colorado: +37%
•Texas: +34%
•Washington: +30%
•Florida: +30%
•Utah: +27%
Biggest Decrease in Inventory (2025 vs. 2018/2019):
•Connecticut: -72%
•Illinois: -63%
•New Jersey: -61%
•Vermont: -56%
•Rhode Island: -56%
Disparities extend beyond the state-level data and into the metro-level data.
To show one example, the state of Florida has very high inventory in 2025 compared to pre-COVID, with homes moving much more slowly.
Across the entire state, inventory is 30% higher than in 2019 – but that’s not the case in all metro regions.
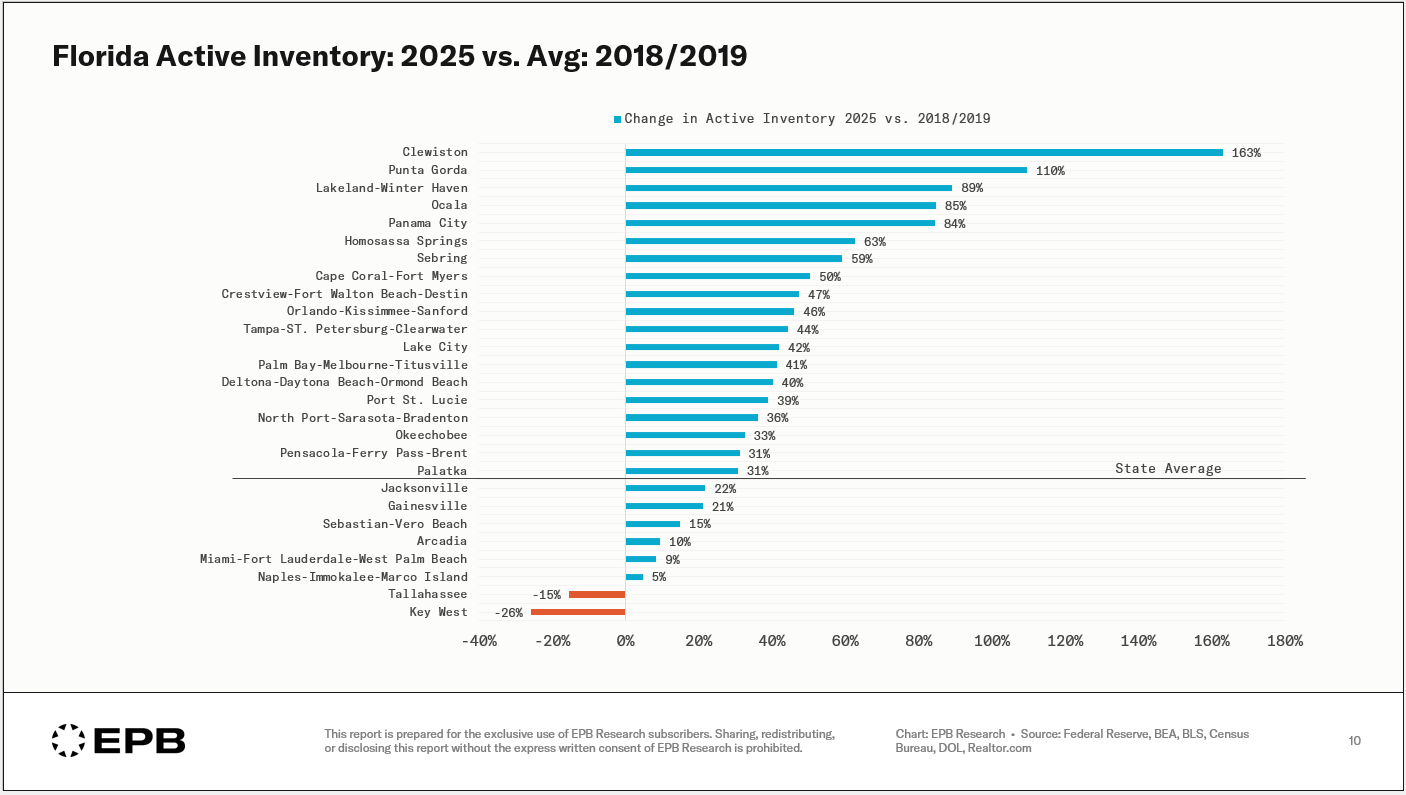
Key West, Miami-Fort Lauderdale-West Palm Beach, and Naples still have the same or lower inventory compared to pre-COVID.
The inventory explosion in Florida is mainly on the west coast in places like Punta Gorda, Panama City, and Fort Myers.
One more example is California. On average across the state, inventory is 4% lower than pre-pandemic, but differences across metro regions are large.
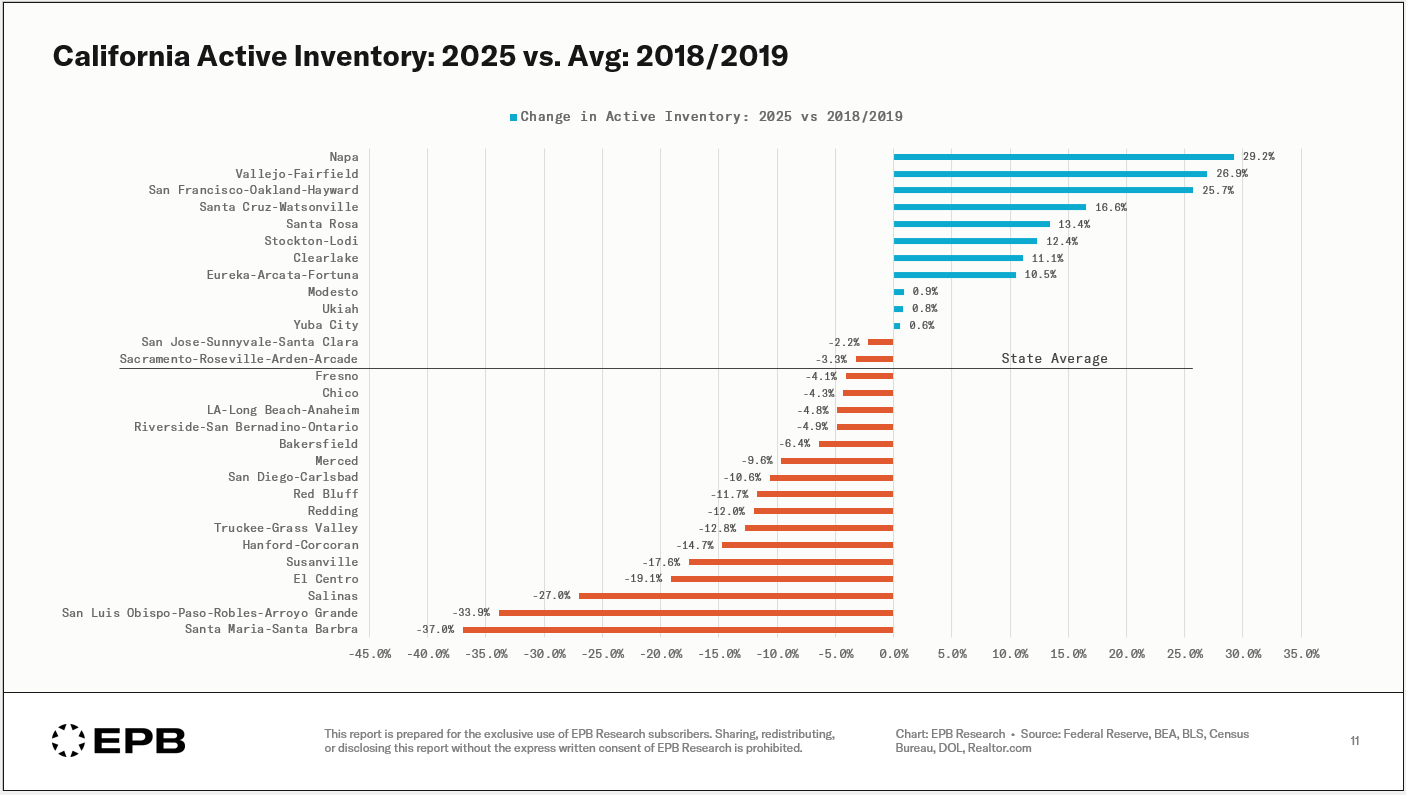
We can also look at the relative change in home prices for major cities compared to the national average.
In other words, when the line is moving up, it means that city has home prices that are outperforming the national average. When the line is moving lower, that city has home prices underperforming the national average.
This chart shows the three worst-performing cities from the Case-Shiller 20-city data relative to the national average – the cities dragging down the national average.
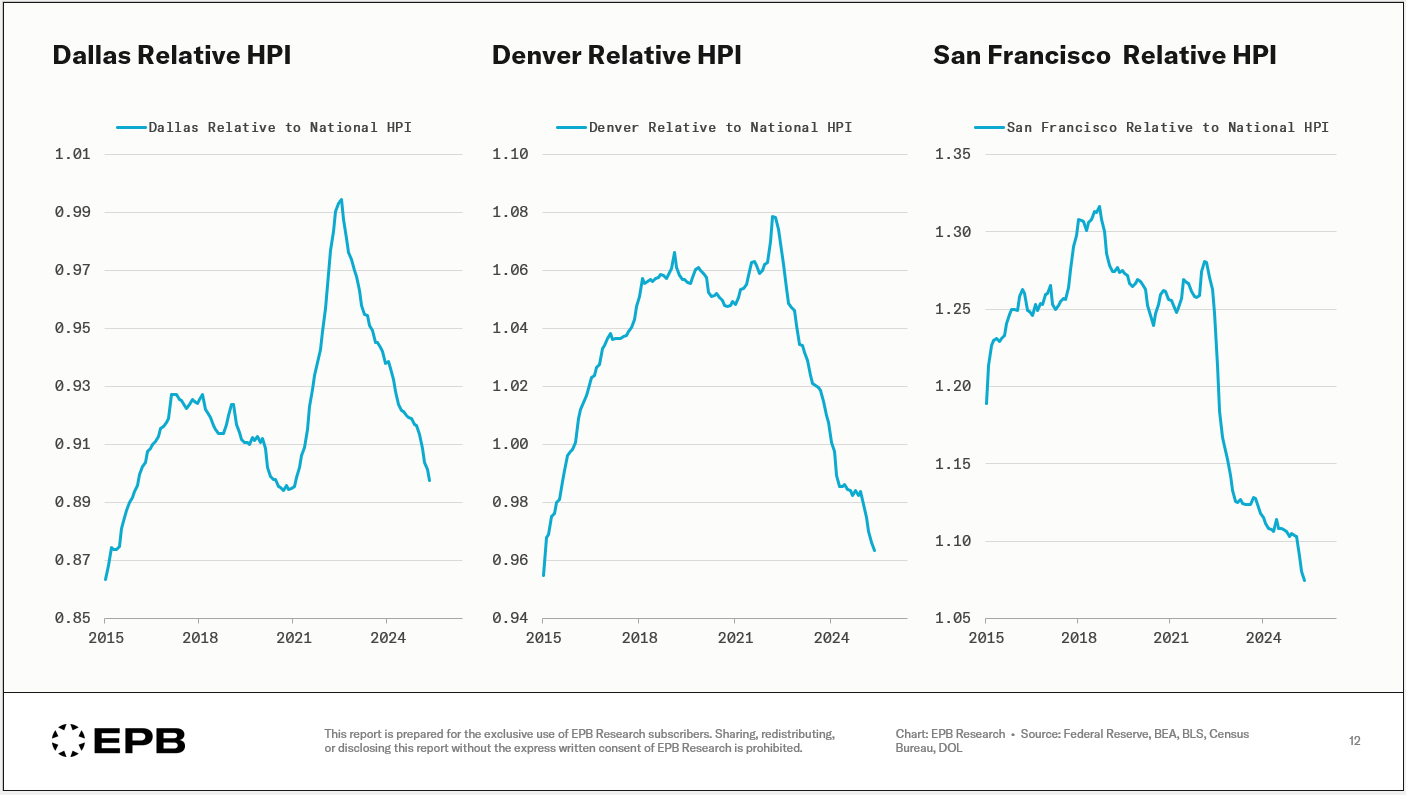
Dallas, Denver, and San Francisco have home prices that are performing considerably worse in recent months and quarters than the national average.
On the flip side, Charlotte, Miami, and New York are outperforming.
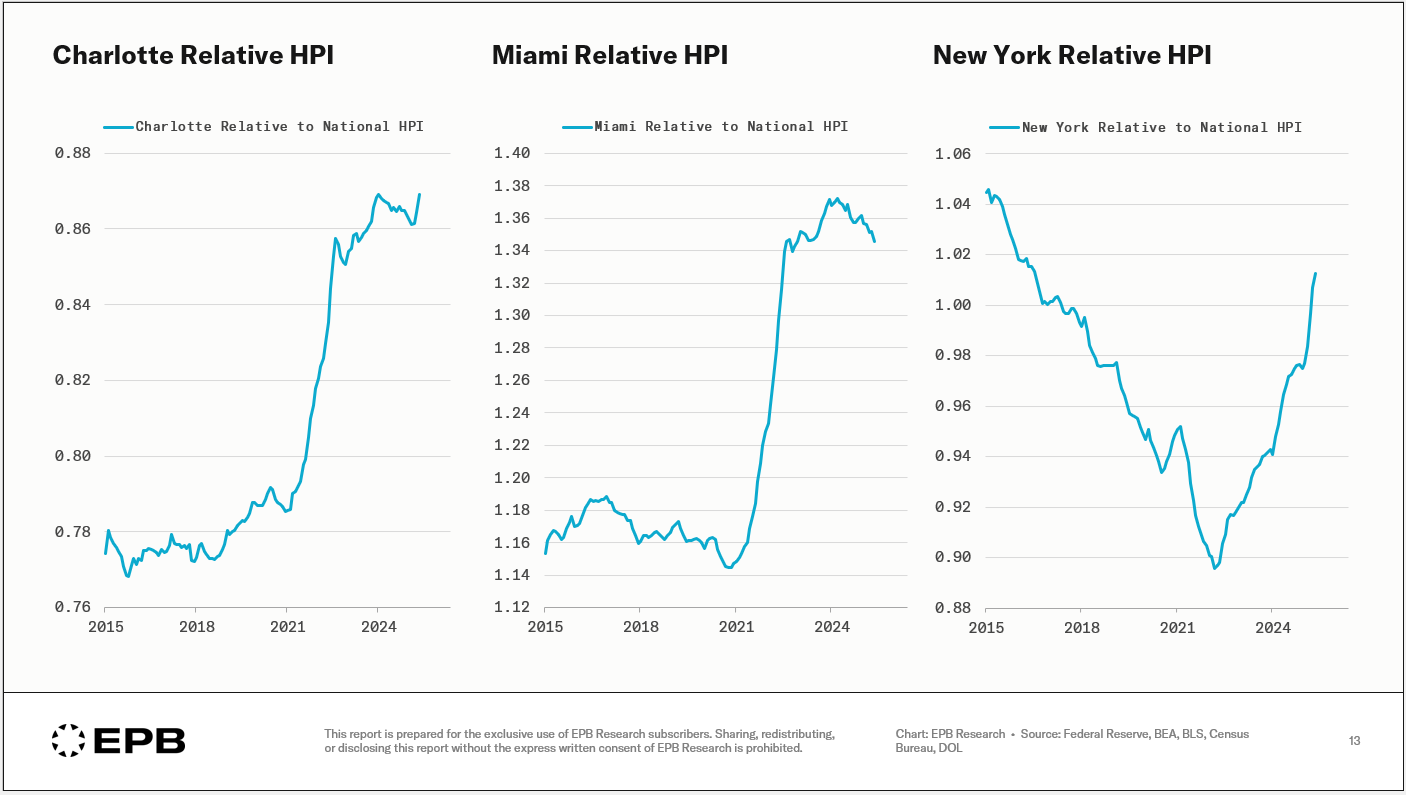
Charlotte has been a strong outperformer since the early days of COVID.
Miami exploded from 2021 through 2024 in absolute and relative terms, but has just started to mildly underperform the national average.
New York was a laggard, suffering during the pandemic, but now outperforming due to extreme inventory issues.
The Residential Housing Cycle Has Turned
Overall, the residential housing cycle moves in a sequence, and that sequence remains in a solid downturn - although it takes time for the full sequence to evolve and this cycle has been more extreme in that regard.
With employment starting to soften, we see signs of the last phase in the sequence – home price declines – but the declines are extremely different across states.
States with a lot of building have high inventory, and homes are sitting longer, but many parts of the country have inventory issues, which is keeping prices elevated.
The most problematic states include Florida, Texas, Colorado, Washington, Arizona, Utah, and Nevada.
Tight inventory and upward price pressure still exist across the Northeast and Midwest.
The key takeaway from this report is that the residential housing cycle follows a sequence.
It’s critical to analyze the entire cycle as a process rather than select one part of the sequence, like home prices, to make a claim about the residential cycle in general.
If you want to follow this entire residential sequence as it unfolds — with more detailed updates, animated video presentations, and forward-looking business cycle comments— you can subscribe to the EPB Business Cycle Research Package below.
The residential housing cycle is one of our six critical areas of weekly coverage within the overall US business cycle.
This is one of most lucid financial reports I’ve read in quite a while. Thank you for the clear concise information. Eric, I don’t often see you on the financial talking heads YouTube videos (ie Wealtheon, thoughtful money etc). I think it would give you great exposure.
Brilliant! As usual.