

The Consumer Is 70% of GDP. Less Than 20% of It Matters.
Most analysts watch total consumer spending and see stability. Break it down by cyclicality and the picture looks completely different.

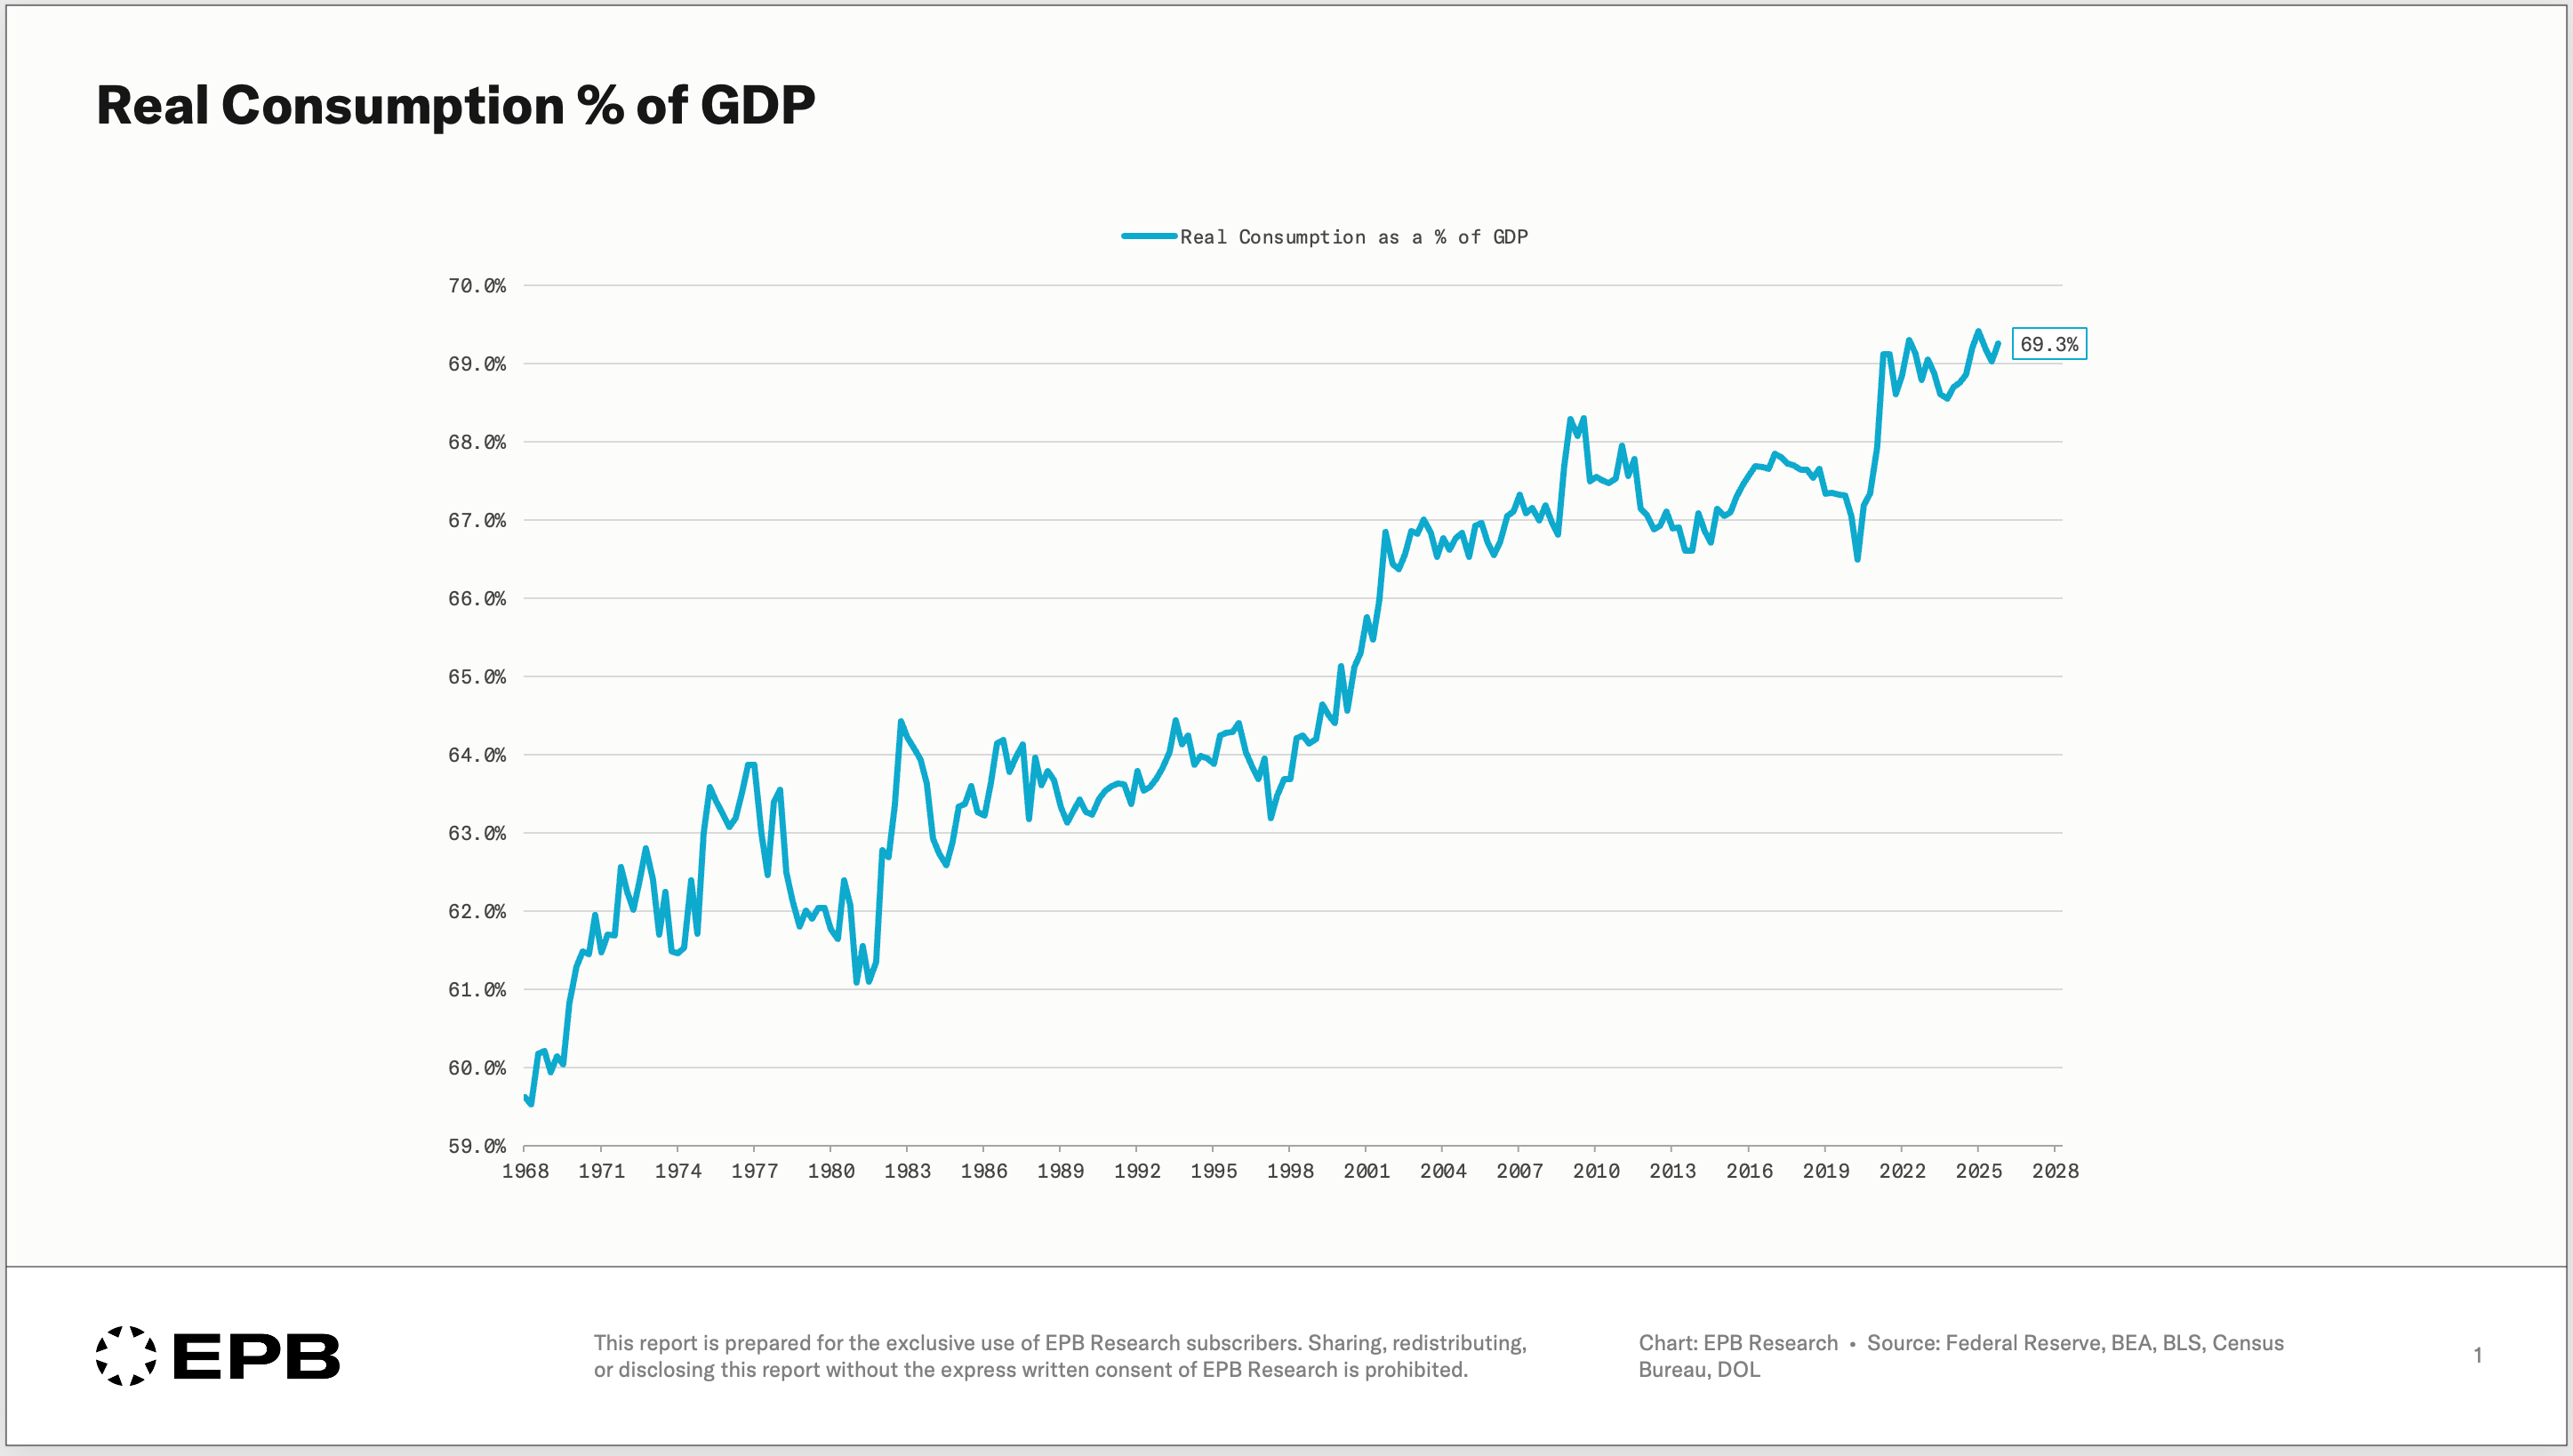
Consumer spending is 70% of GDP.
This statement is repeated nearly every day across financial media as proof that “the consumer” drives the economy.
The logic seems correct.
If consumer spending is almost 3/4 of the entire economy, and consumer spending slows, the economy will decline…
So the best practice must be to watch the consumer, track sentiment, and focus on anecdotal data points like “is the airplane full?” or “is the restaurant packed?”, all things we hear discussed frequently.
The problem is that these comments about the consumer and the focus on economic data like personal consumption treat the consumer as a single, uniform bucket.
The consumer is either still spending or not.
But when you dig beneath the headline and look across all categories of consumer spending, it becomes clear that the 70% figure is dangerously misleading. In reality, less than 20% of all consumer spending really matters for the economy.
In this post, we will highlight which categories of consumer spending actually impact the business cycle and why focusing on “the consumer” and waiting for a slowdown in total consumption is a horrible idea.
Breaking Down Consumption
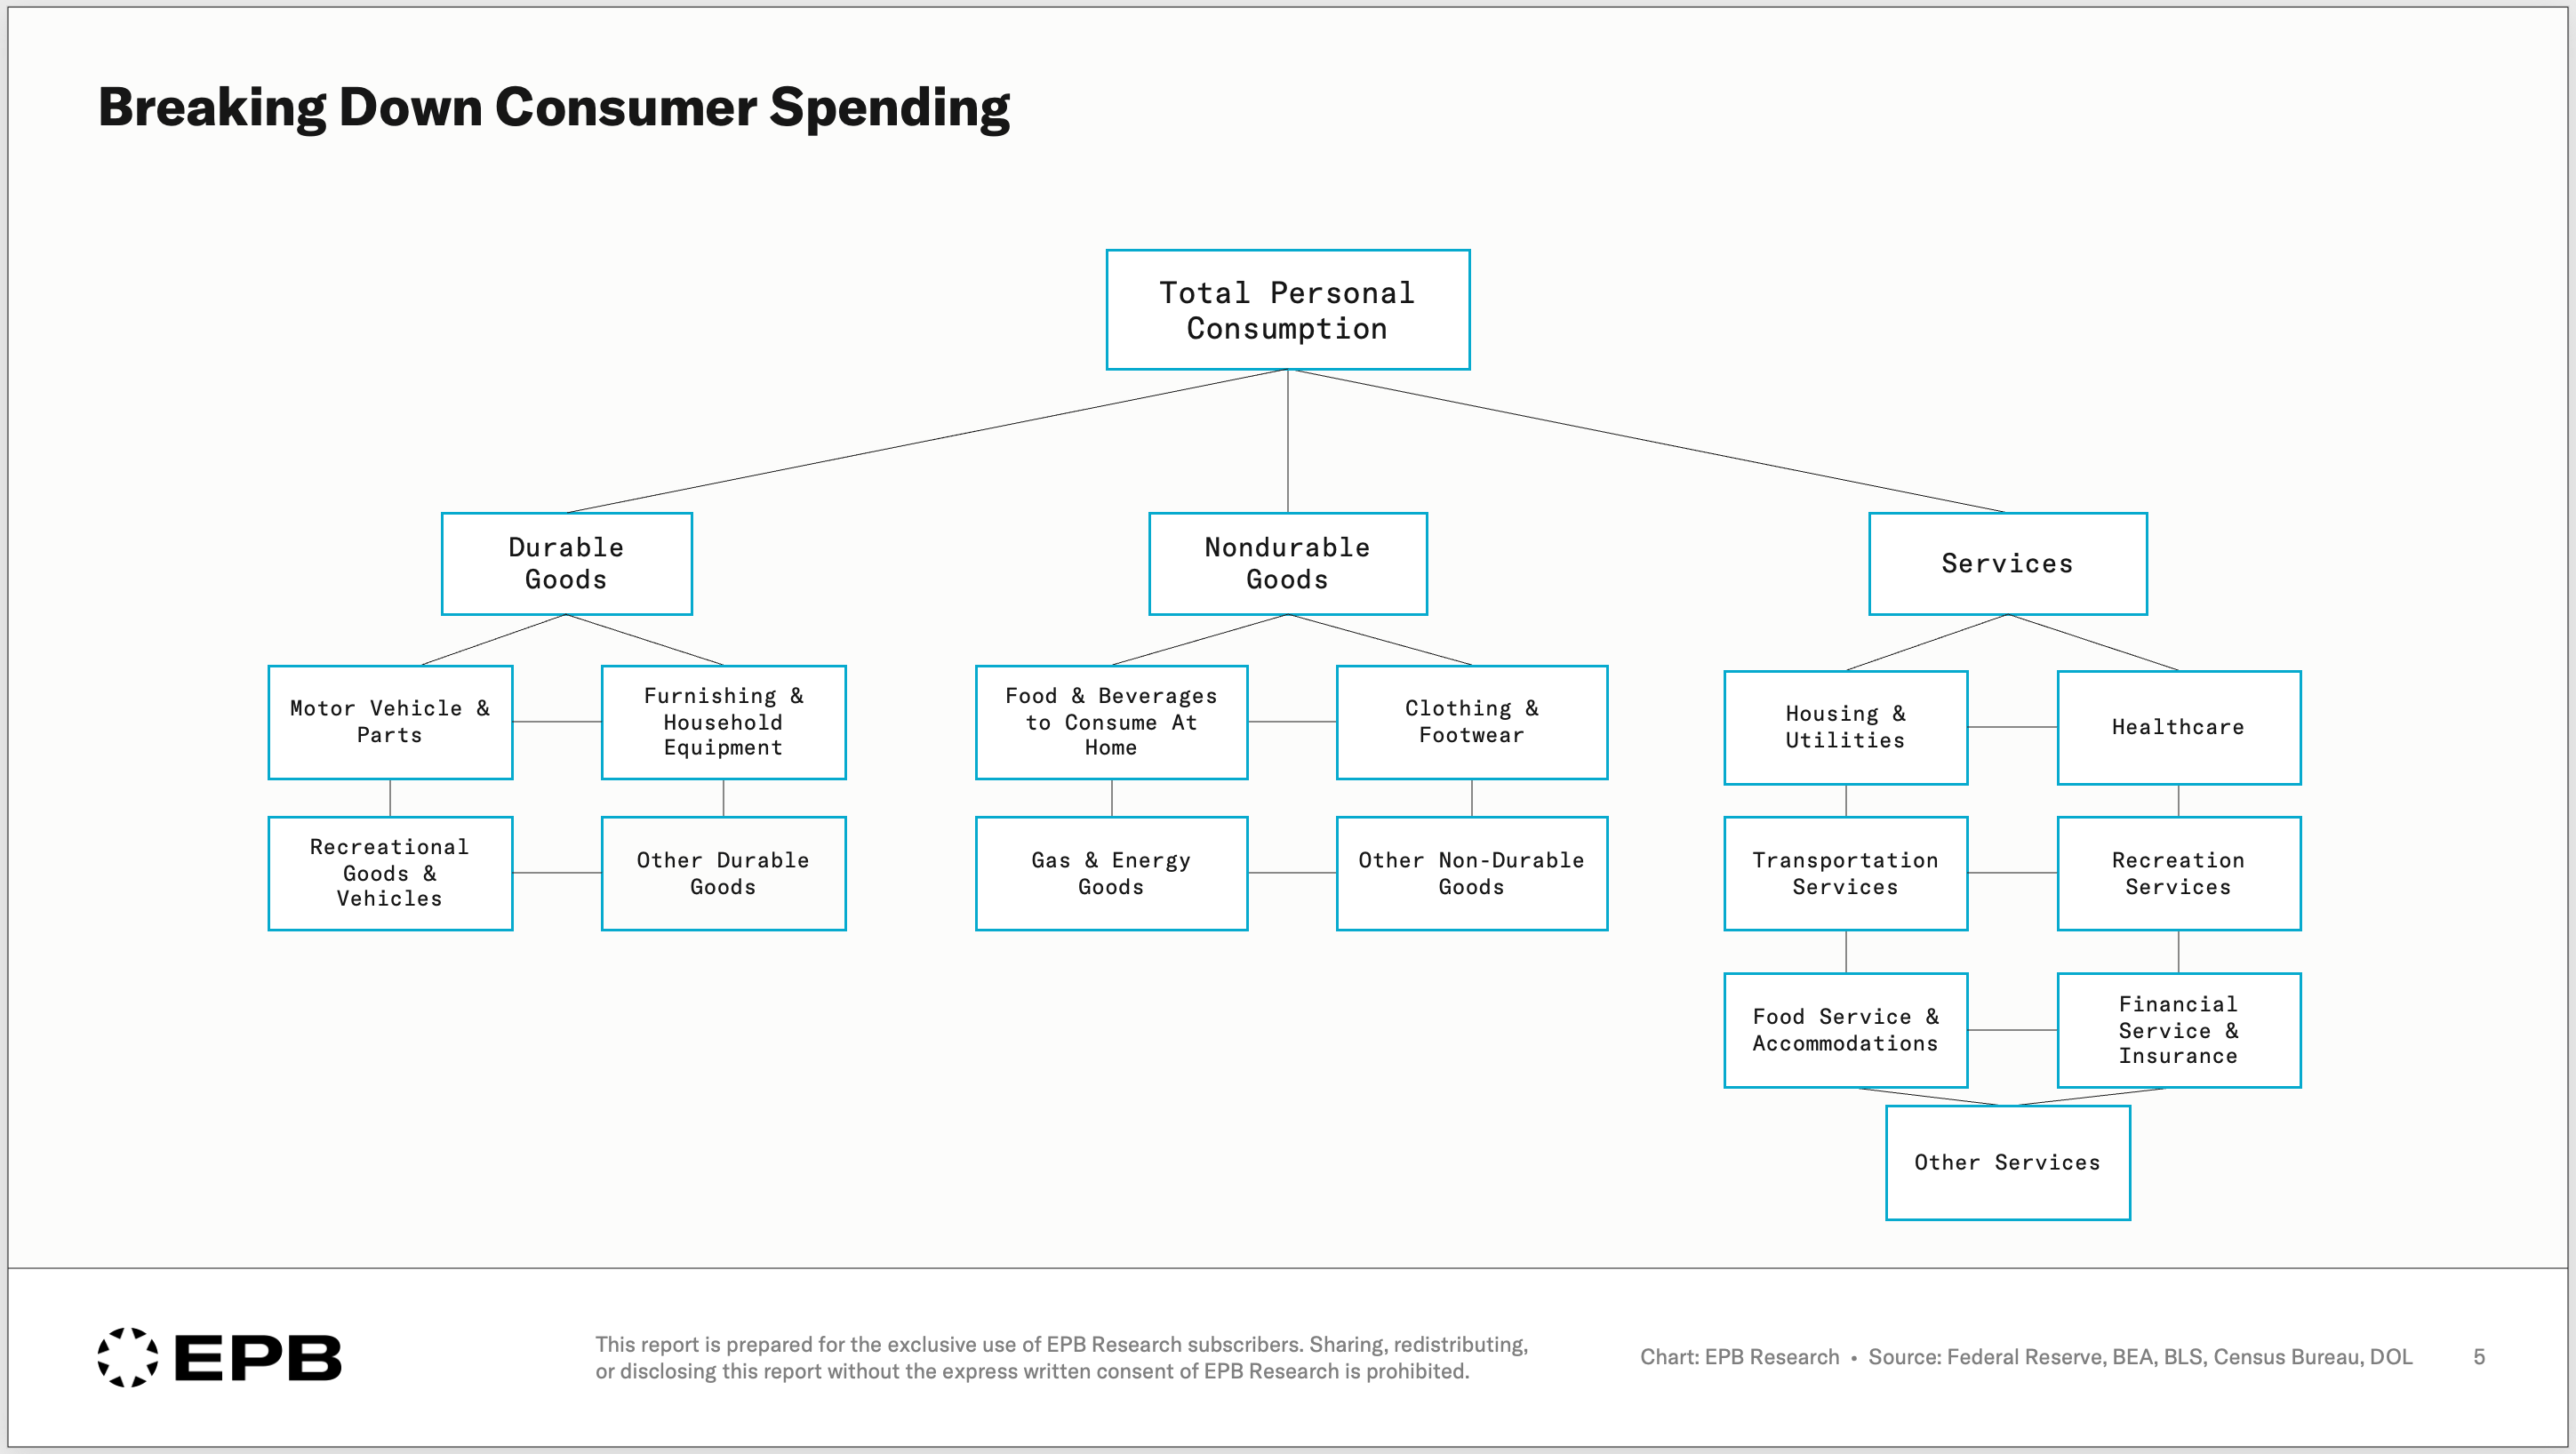
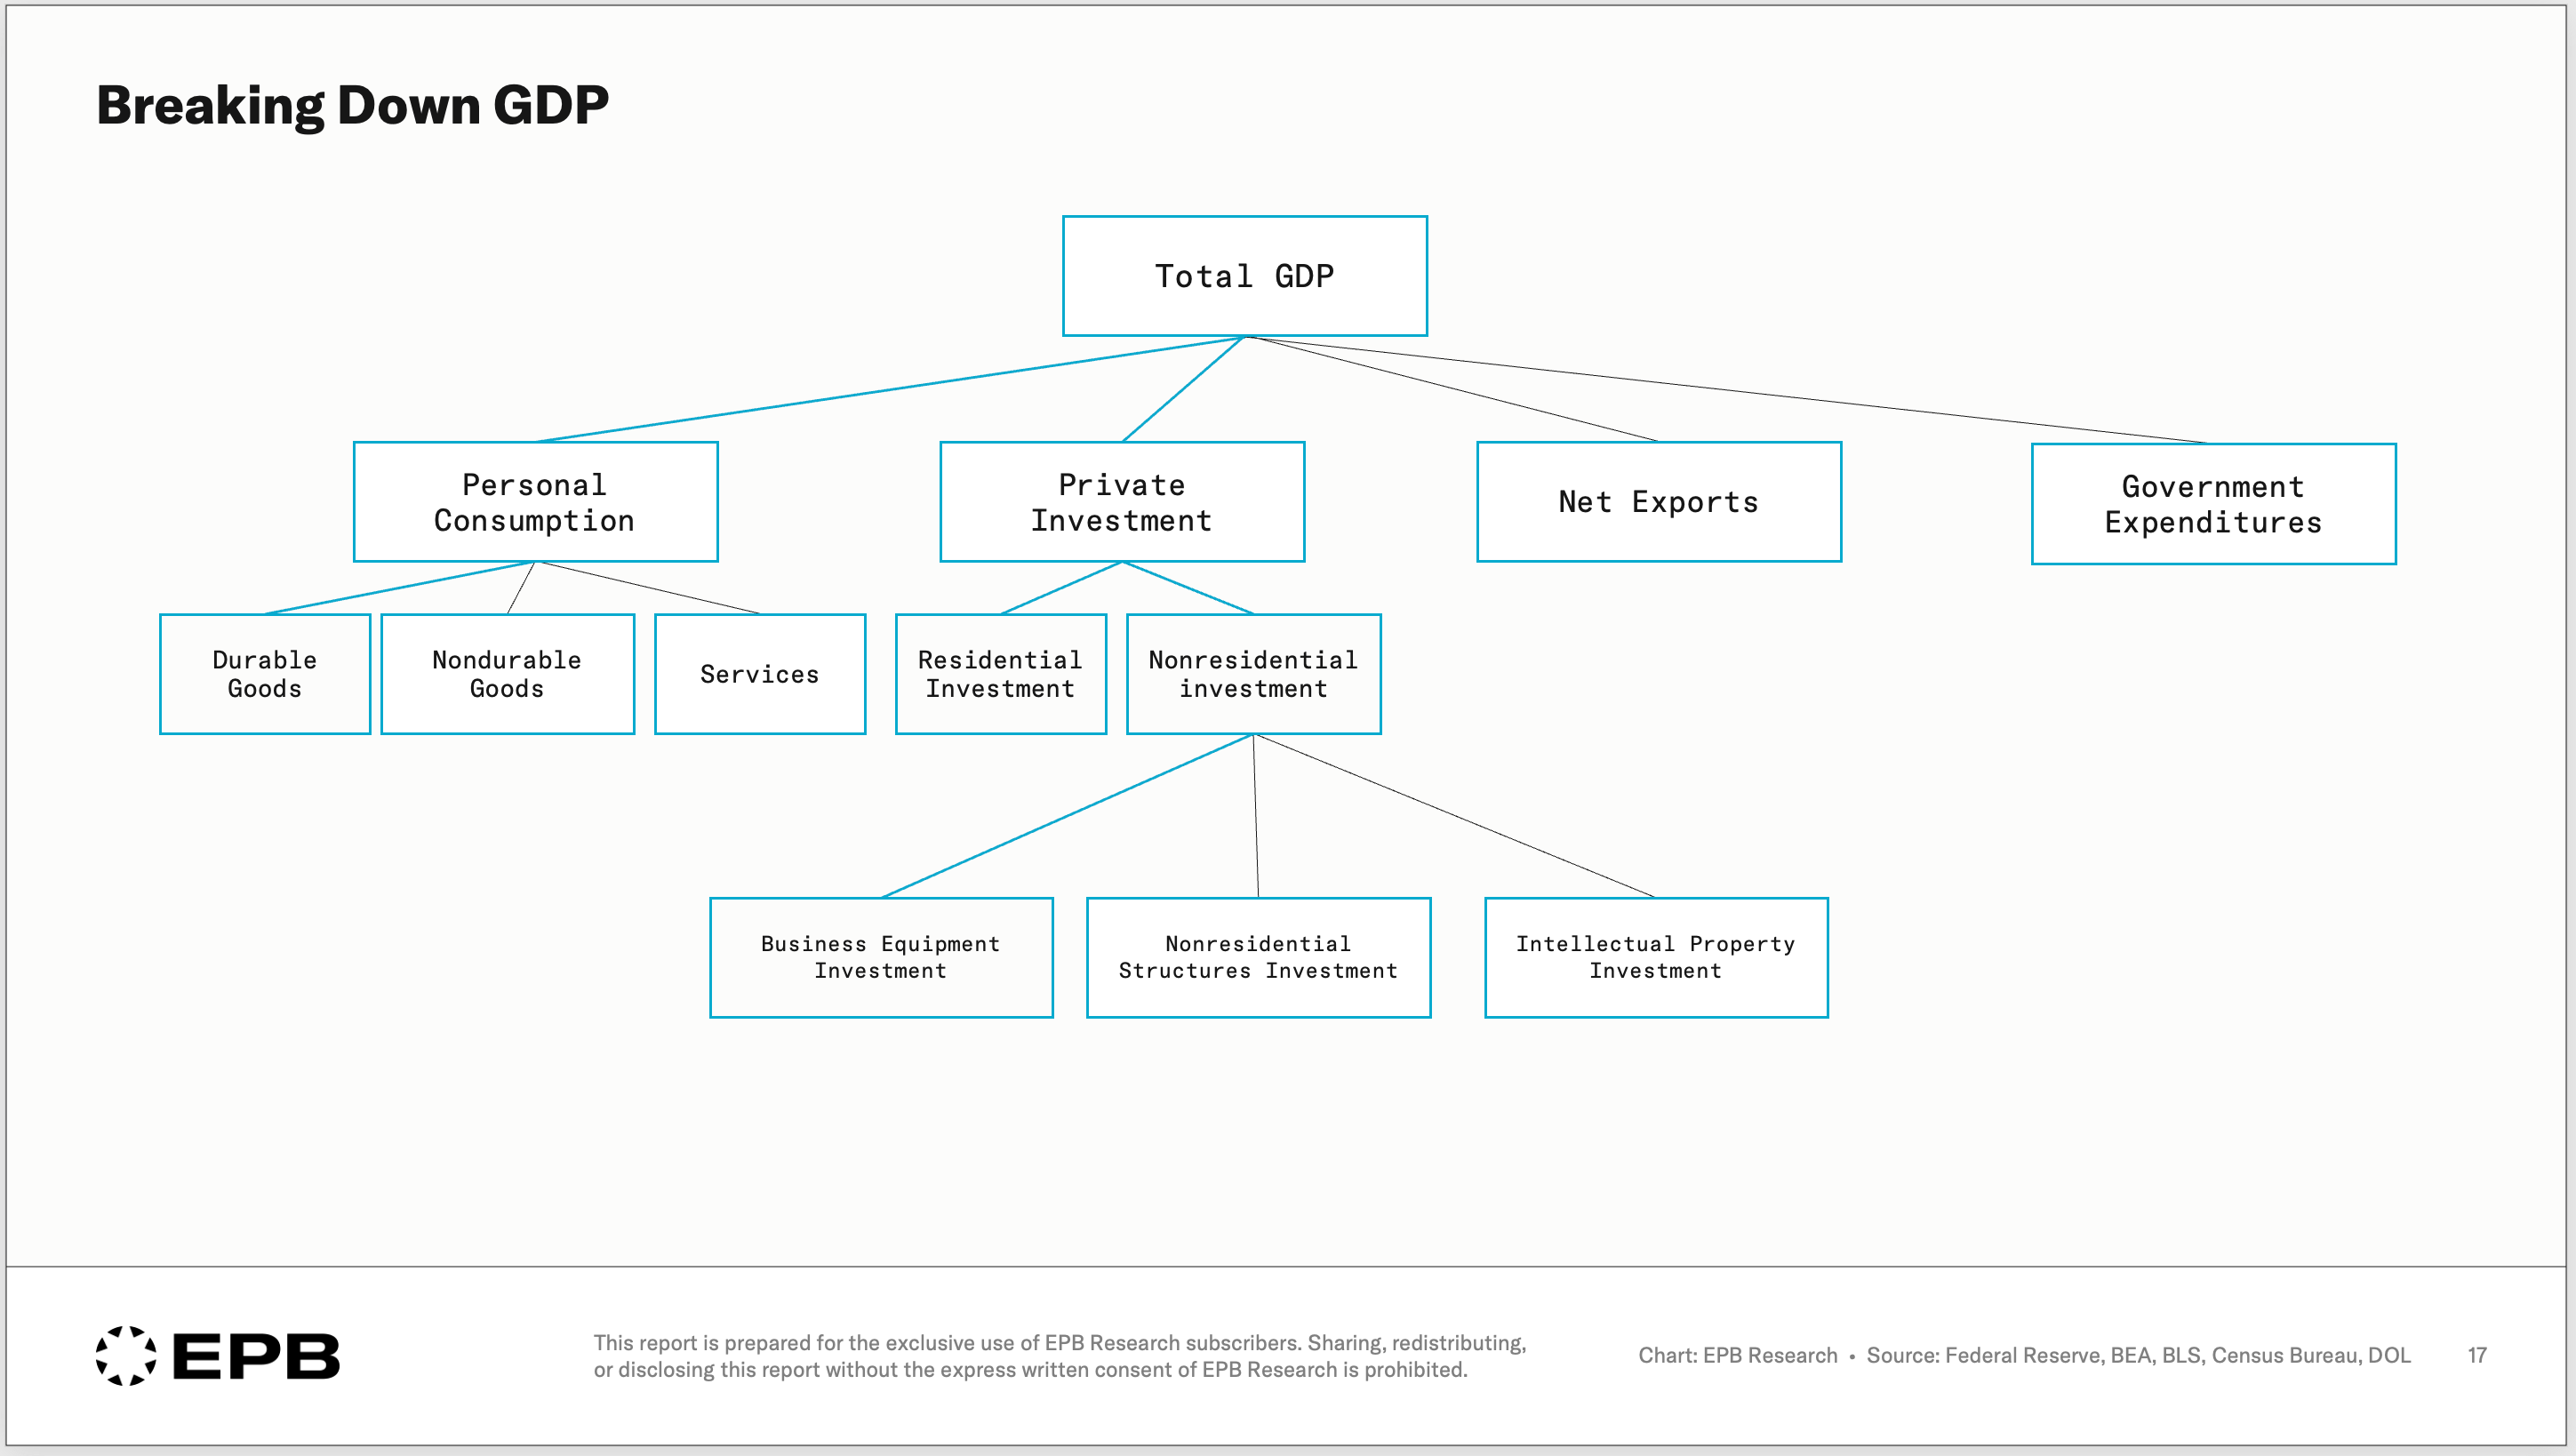
Personal consumption can be split into three primary categories: durable goods, non-durable goods, and services.
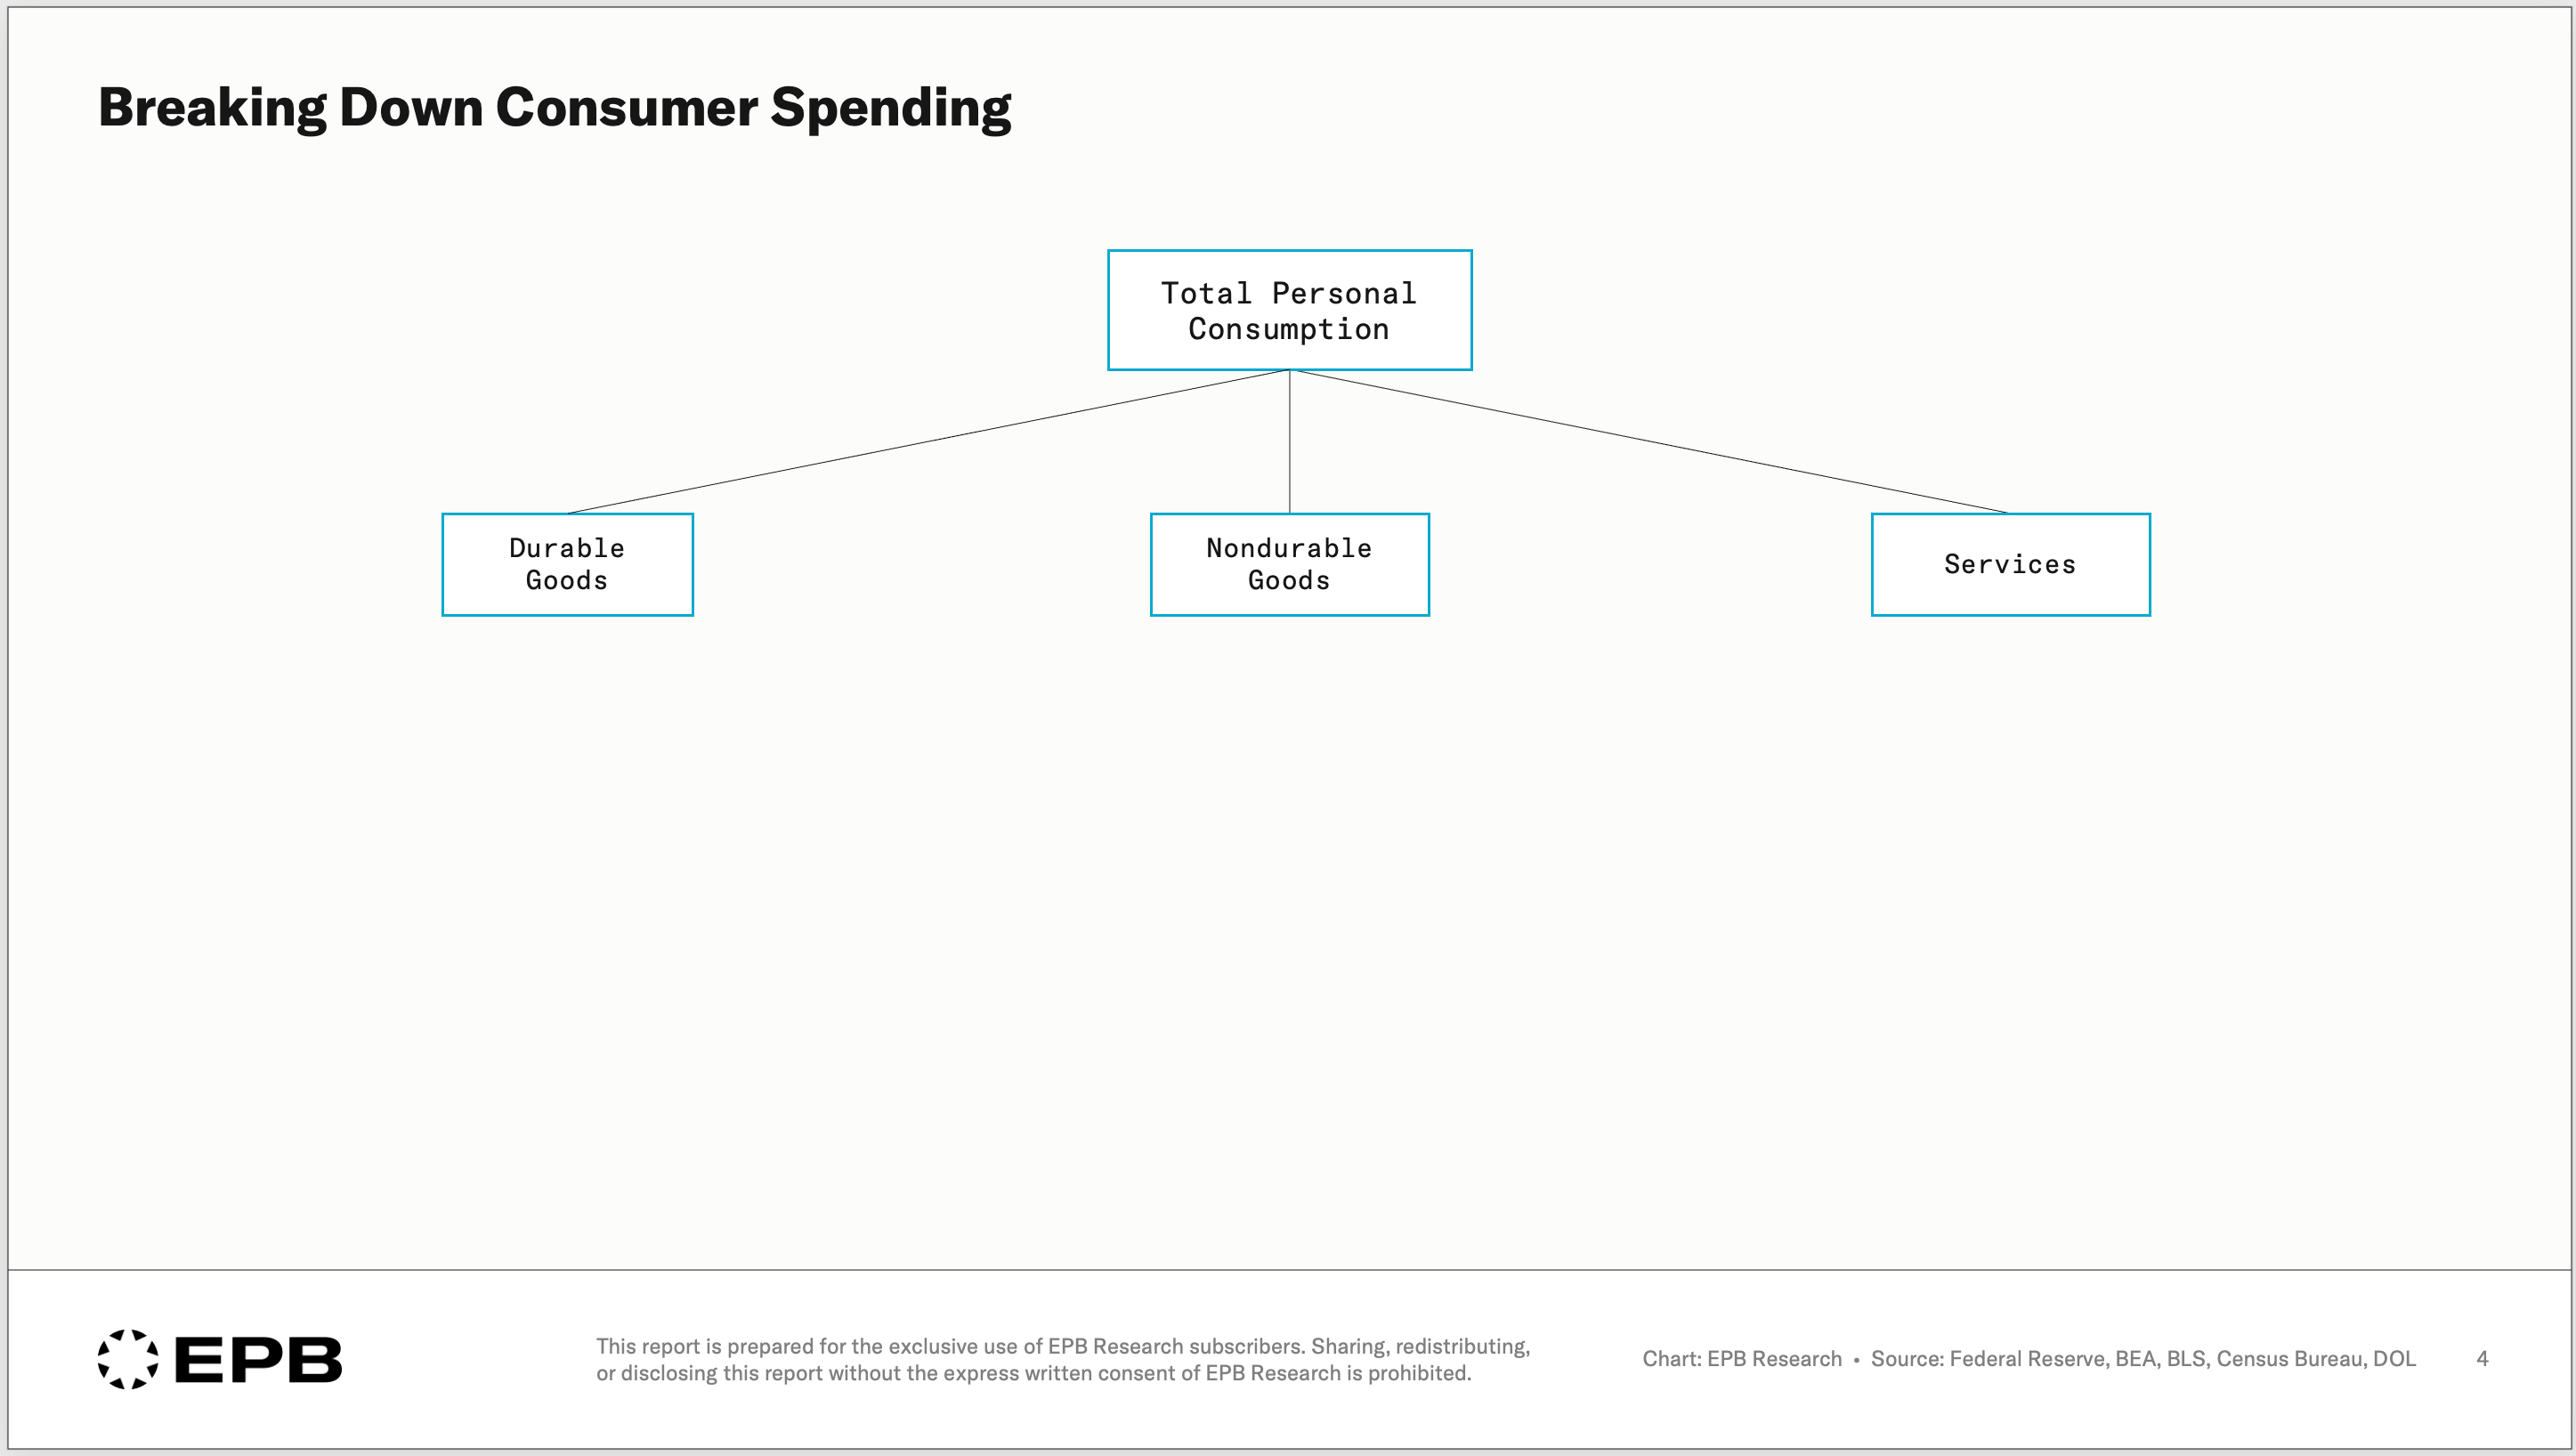
Durable goods include items such as motor vehicles, furniture, and household appliances.
Non-durable goods are items such as food, clothing, and gasoline.
Service consumption is by far the largest category, including housing, healthcare, insurance, restaurants, and utilities.
These three primary categories of consumer spending can be split into 15 more specific buckets, which offer a lot of detail on how certain categories behave in recessions and expansions.
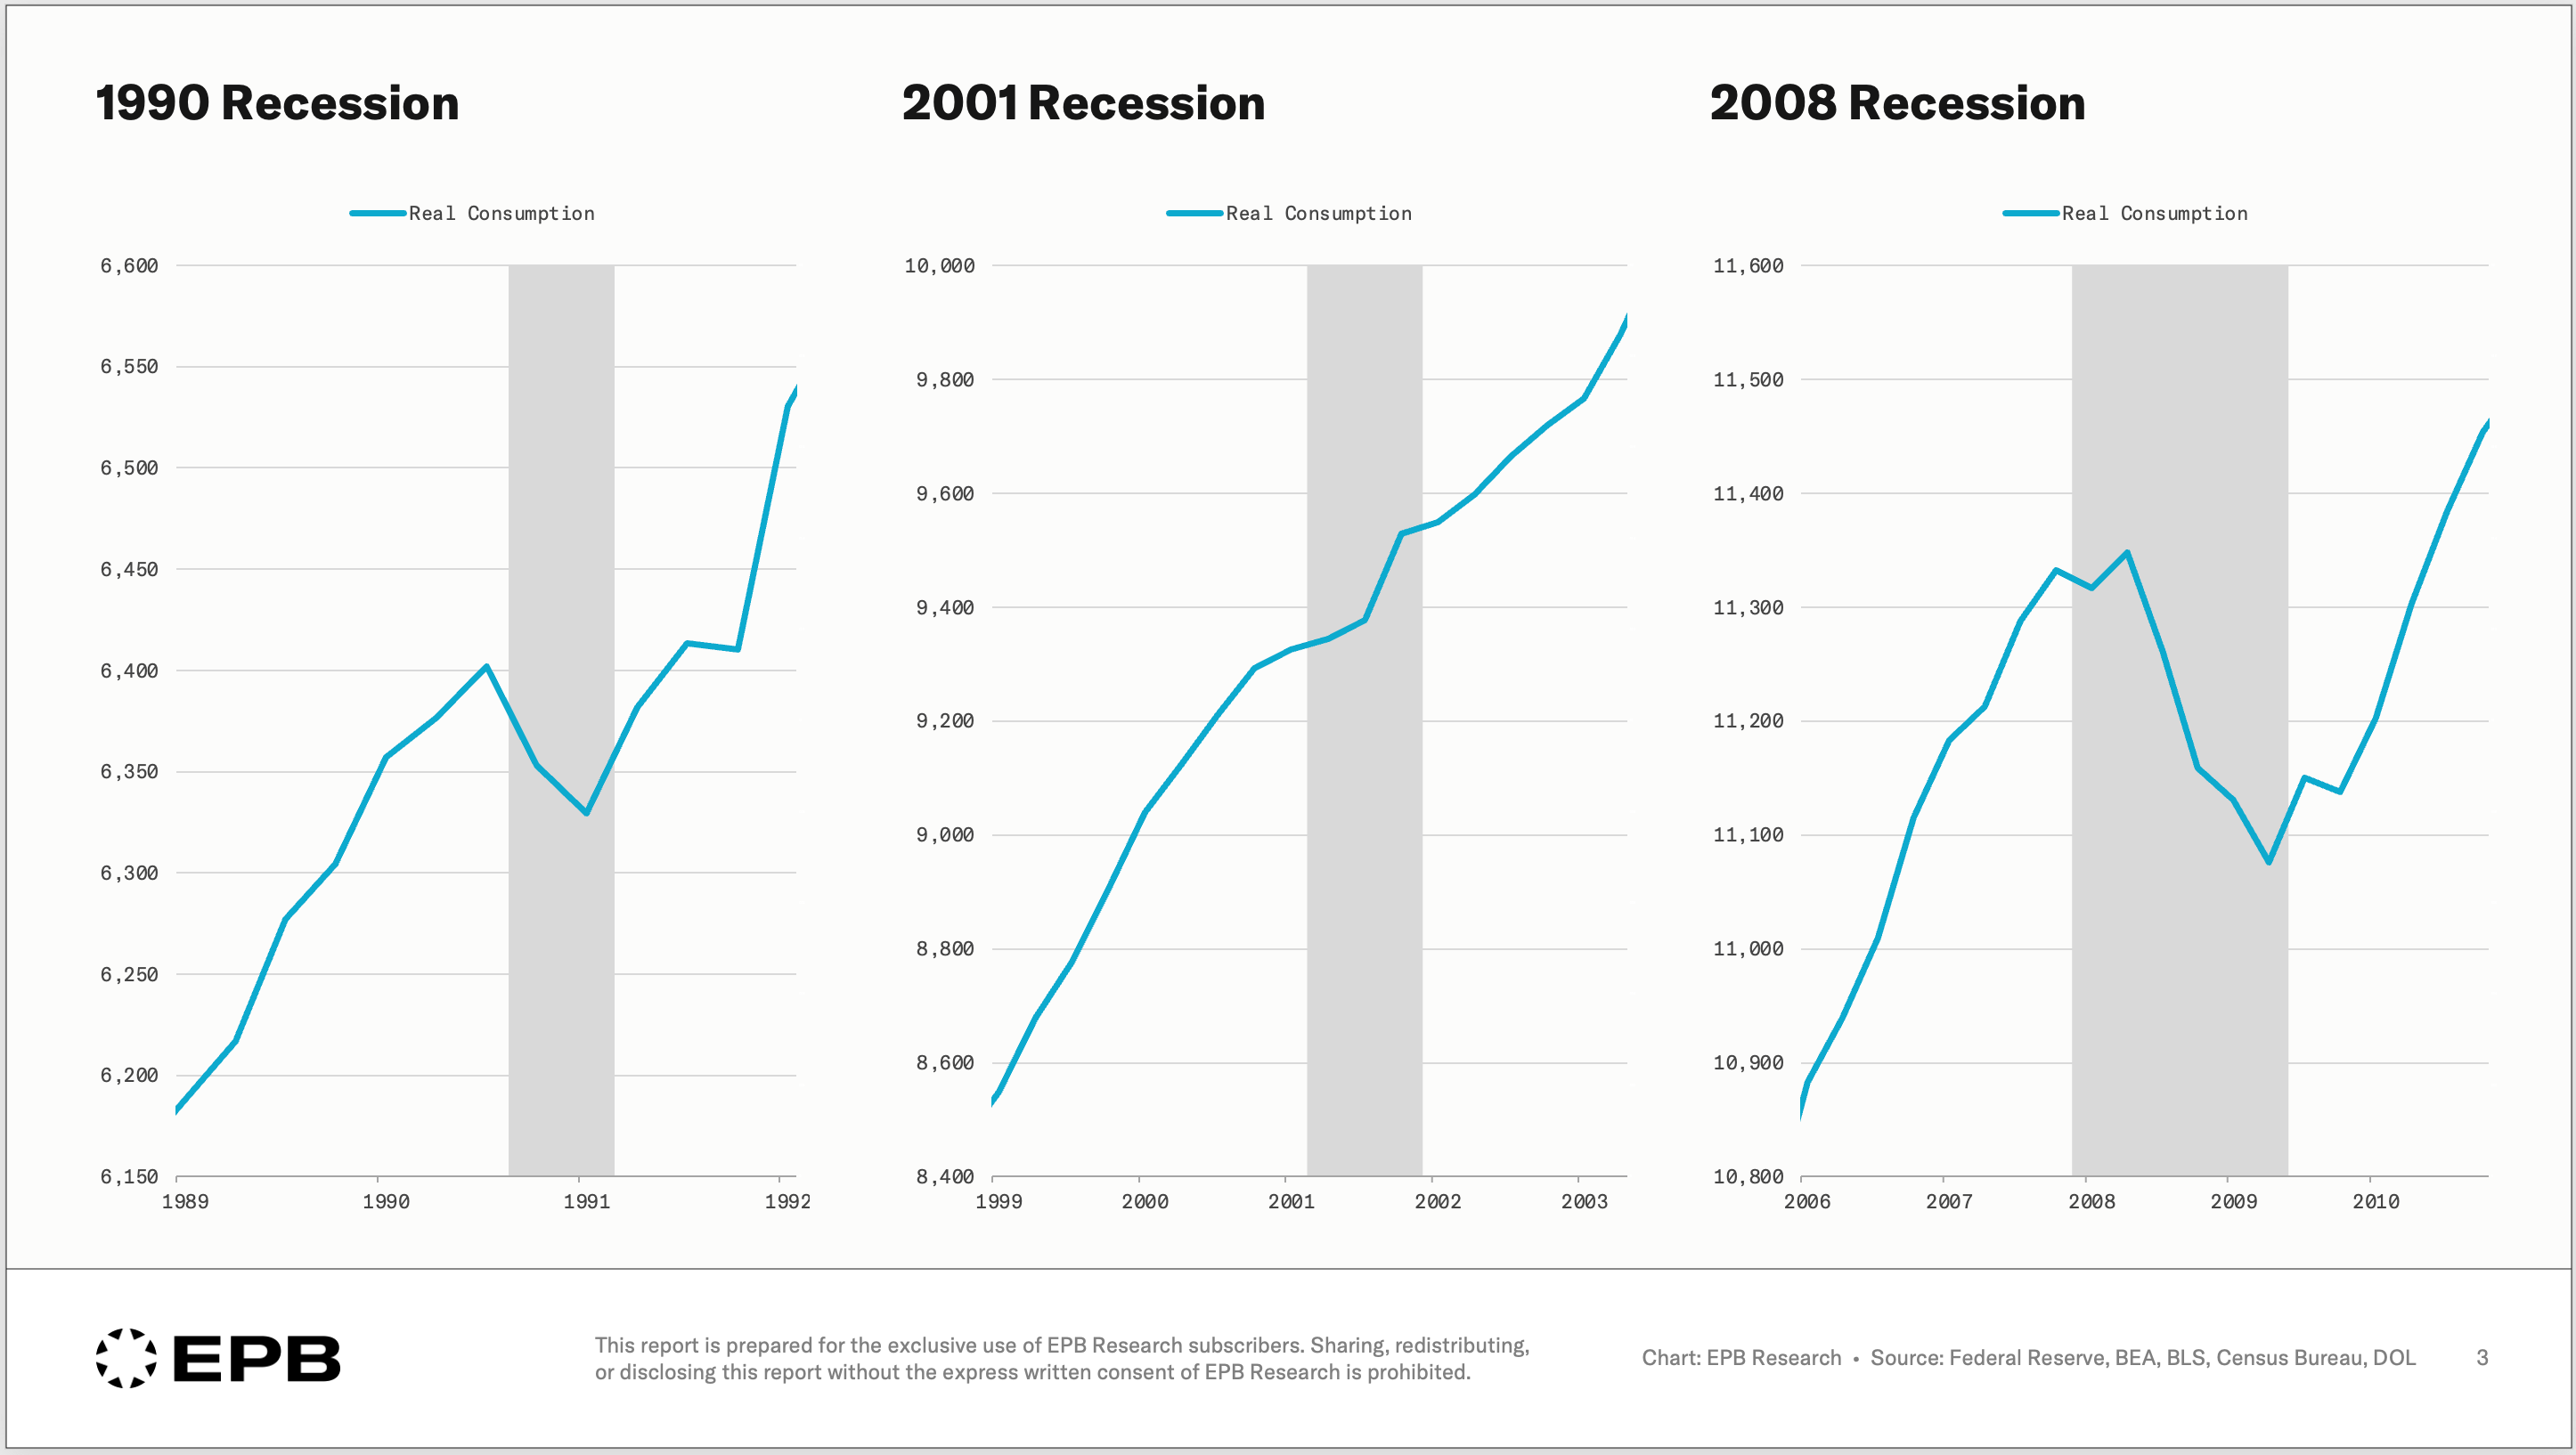
Going back over 50 years, we looked at the average growth rate for each of these 15 categories during recessionary periods and during expansionary periods.
The difference in growth rates during recessions and expansions is extremely informative and tells you exactly how “cyclical” a given bucket of consumer spending really is.
In other words, is this a category of consumer spending that really changes during recessions or not?
We can call this change in growth the expansion-recession spread.

Housing and utilities are 16% of consumer spending.
The average growth rate for this category of consumer spending during expansions is 2.9%. In recessions, the average growth rate is 2.0%. The spread is less than one percentage point. Rents get paid. Utilities get used. This category is essentially unaffected by the business cycle.
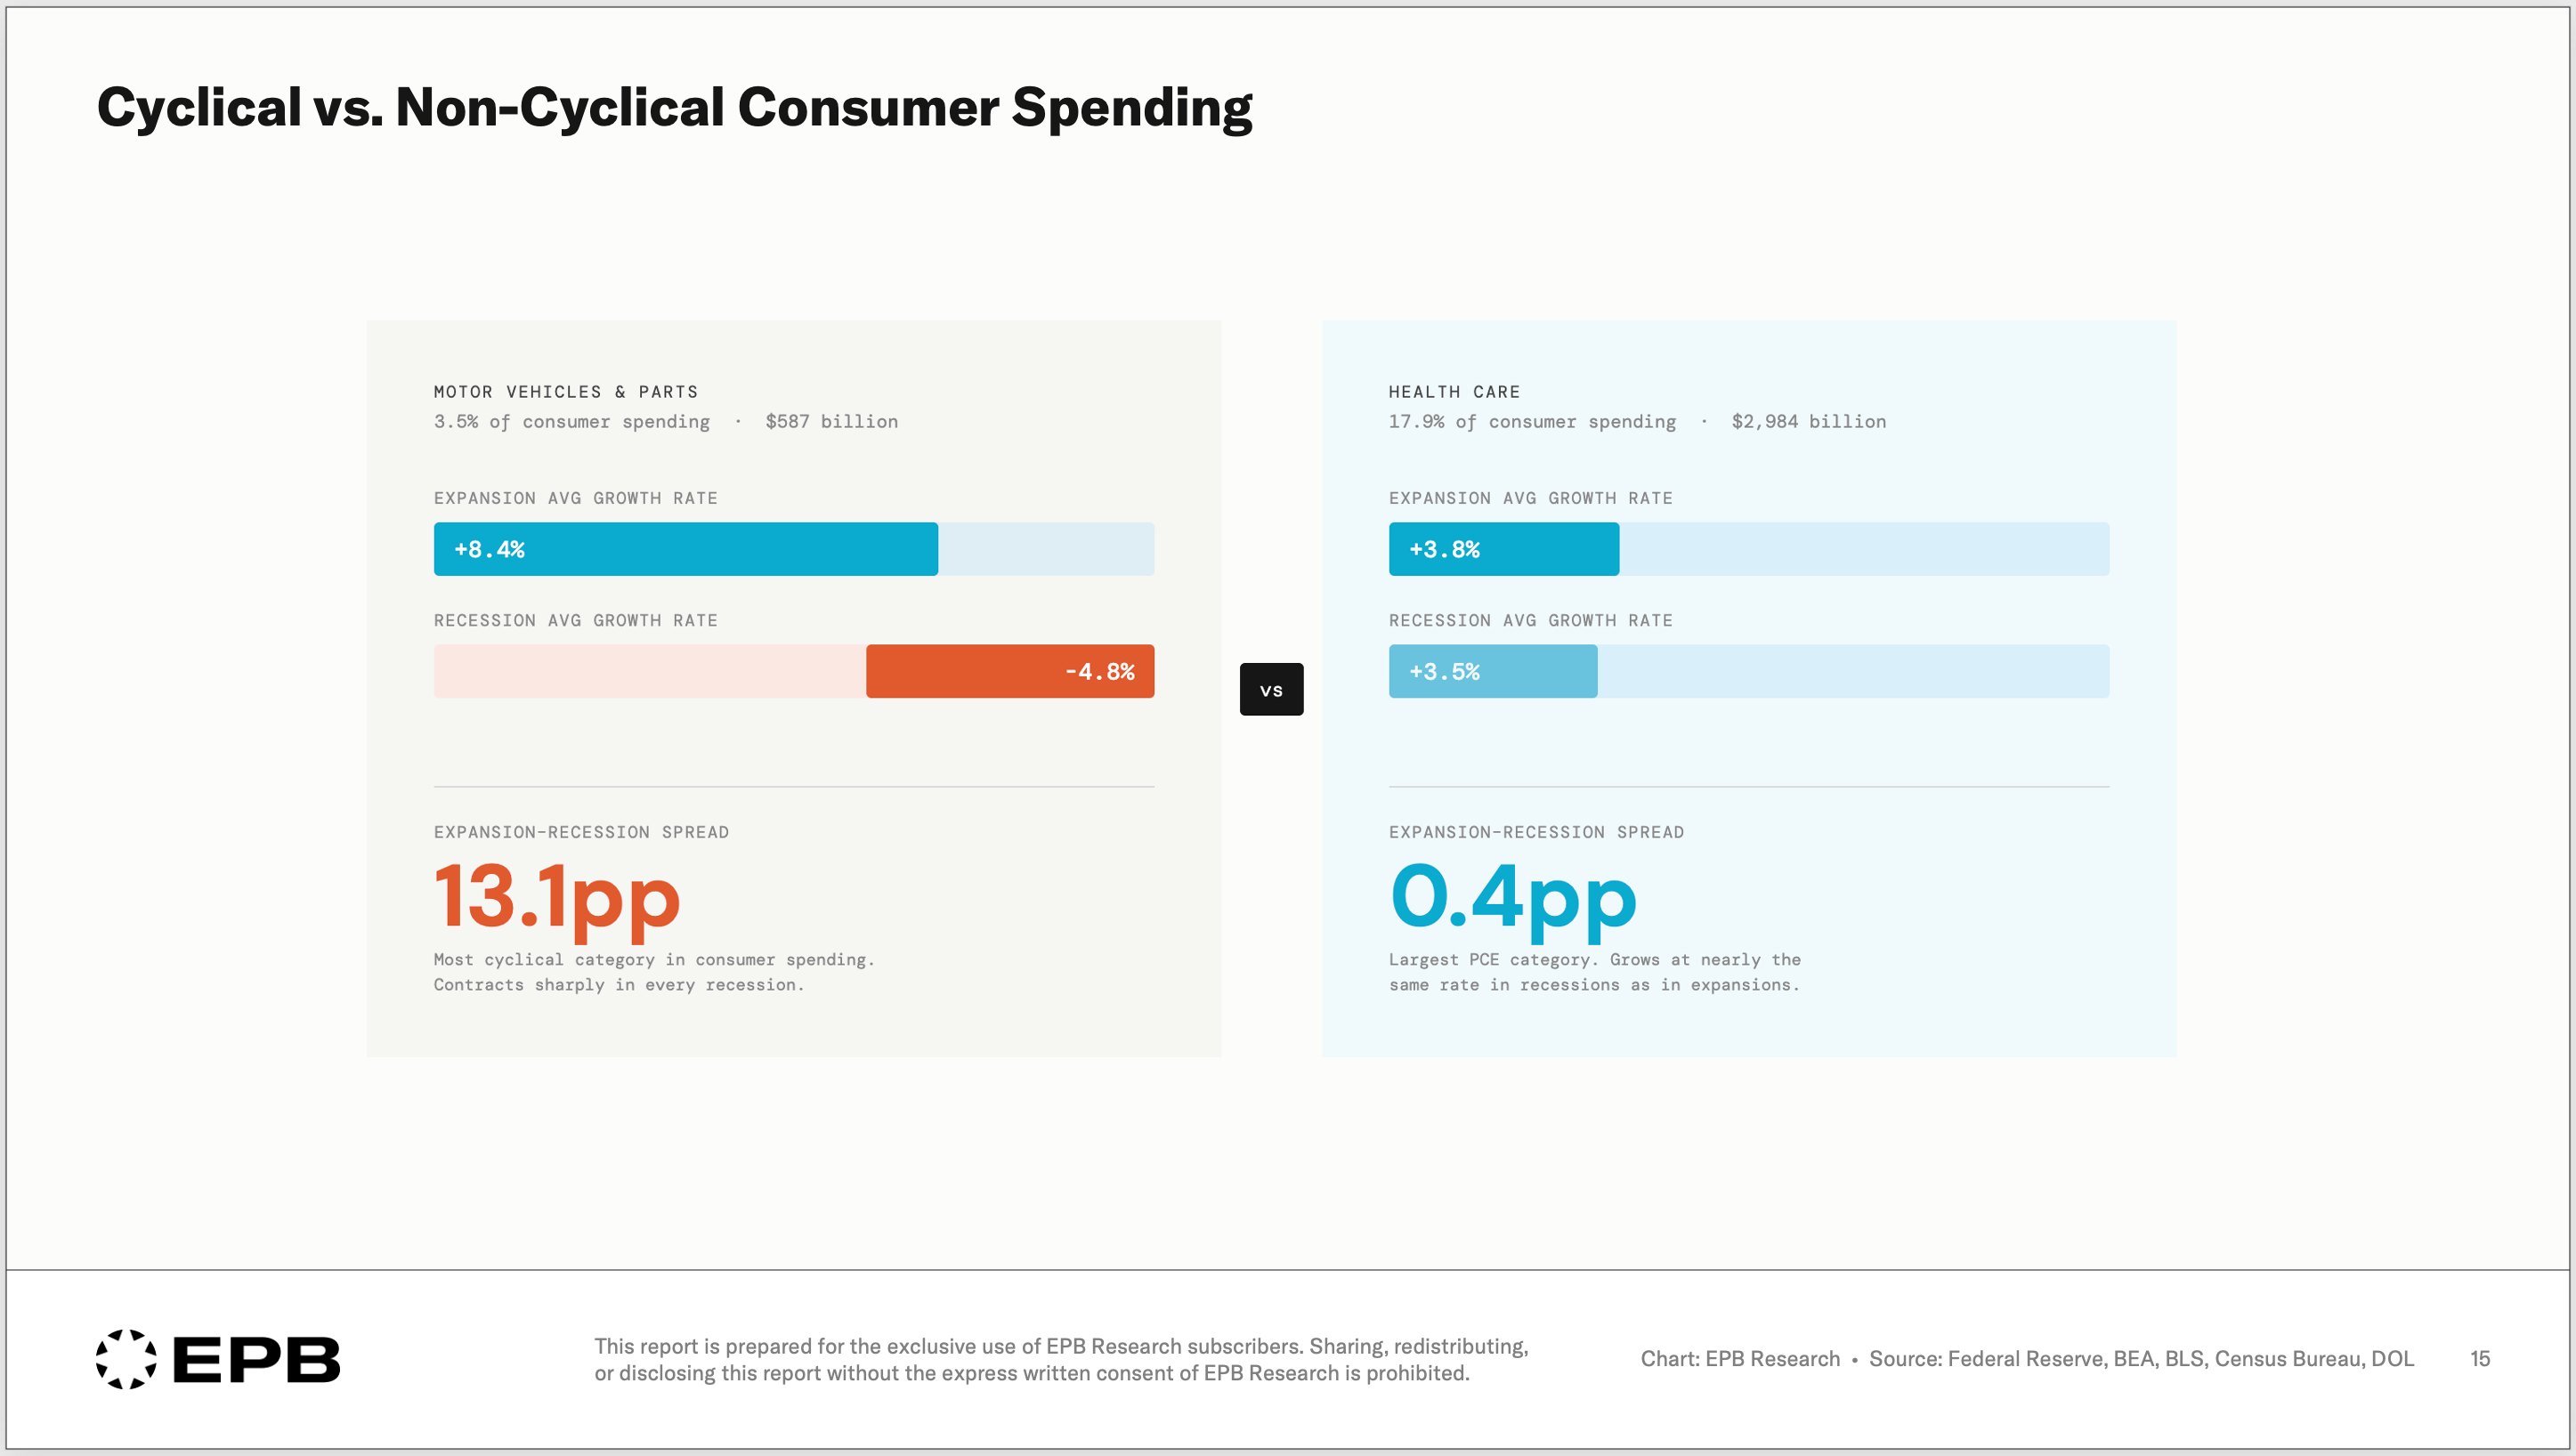
Health care is 18% of consumer spending, the single largest category in the entire basket. In expansions, average growth is 3.8%. In recession, 3.5%. The spread is 0.3 percentage points. Health care spending is as close to recession-proof as any category in the economy.
Financial services and insurance account for 7% of spending. In recessions, this category actually shows higher growth - part of this is because insurance is a very lagging indicator in terms of when prices increase. In expansions, average growth is 3.6%. In recession, 5.2%.
Food and beverages consumed at home, or groceries, are about 7% of spending. The expansion-recession spread is effectively zero.
We just listed more than 40% of the consumer spending basket that does not change at all, whether the economy is in expansion or recession. In recessions, these categories don’t even show negative growth. They are essential items that always grow.
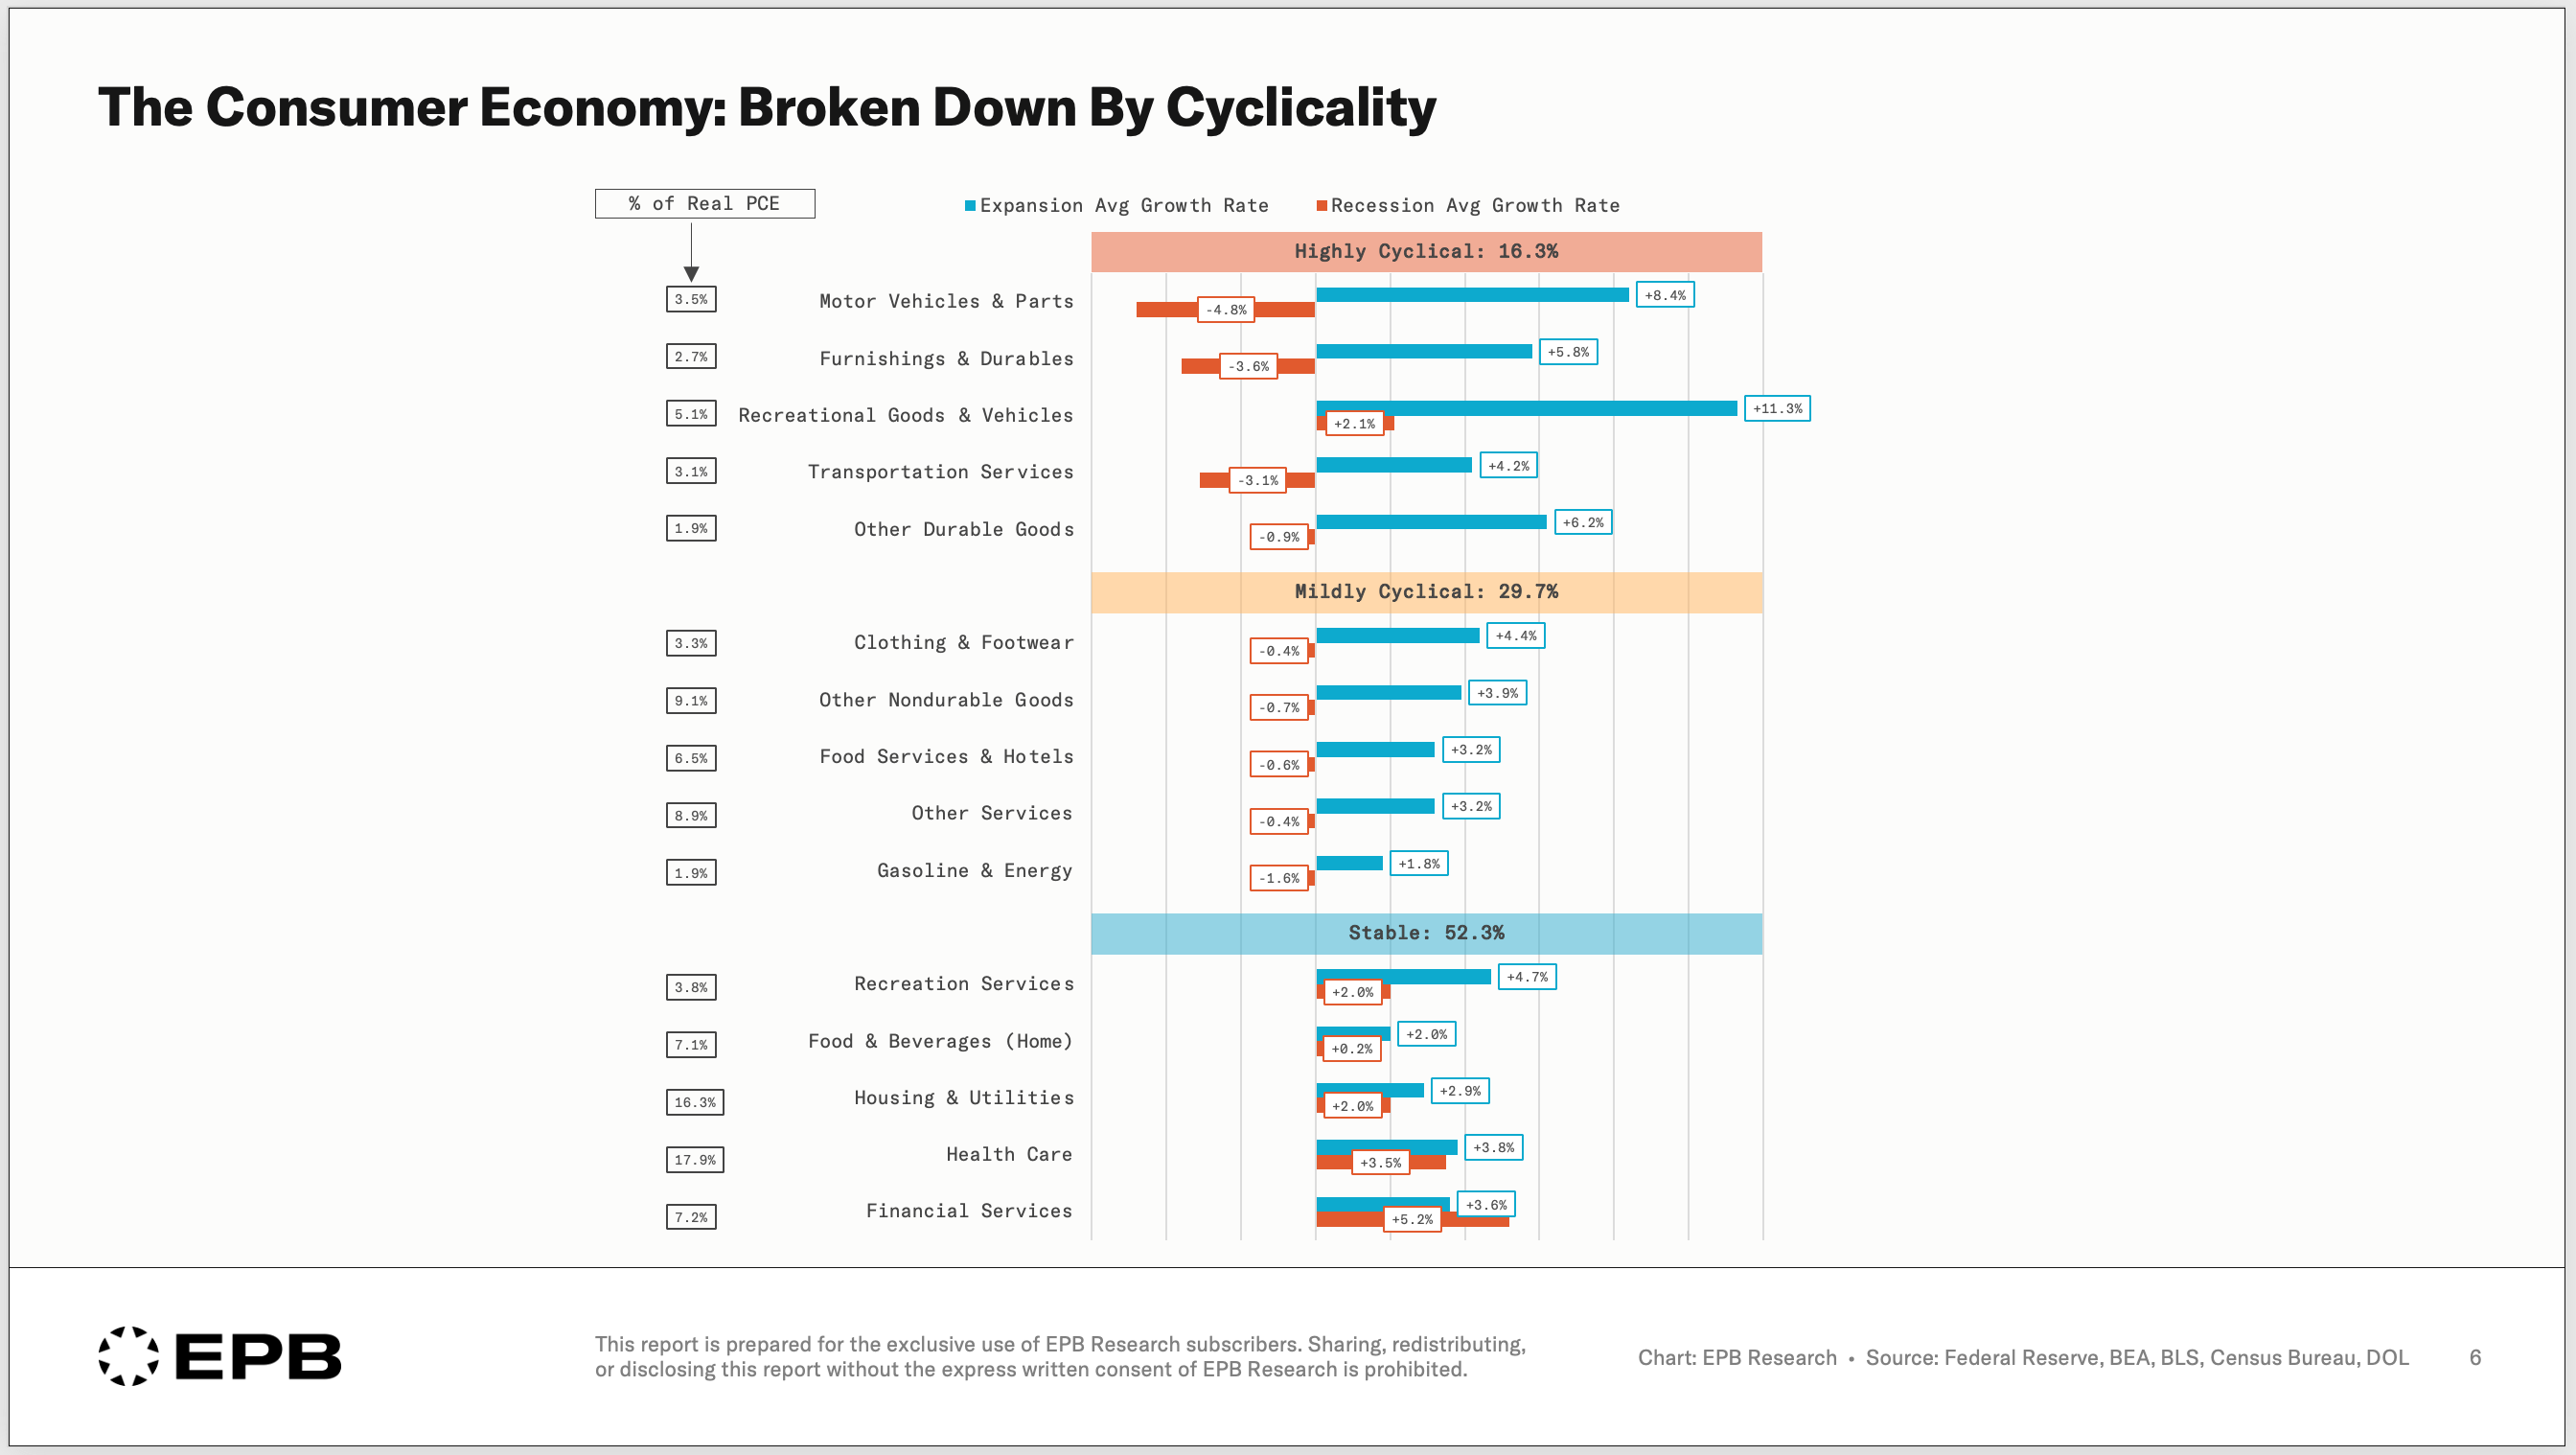
This is why, when you look at total consumer spending, you are capturing huge buckets of the economy that don’t ever contract, giving a false sense of stability and completely overshadowing the parts of the economy that are more cyclical and offer insights into the financial health of the consumer.
Another 30% of consumer spending is what we’d call “mildly” cyclical, which leaves less than 20% of the entire consumer spending basket that really swings in recessions compared to expansions - this is the only area of consumer spending worth watching.
The 16% That Matters - Focus Here
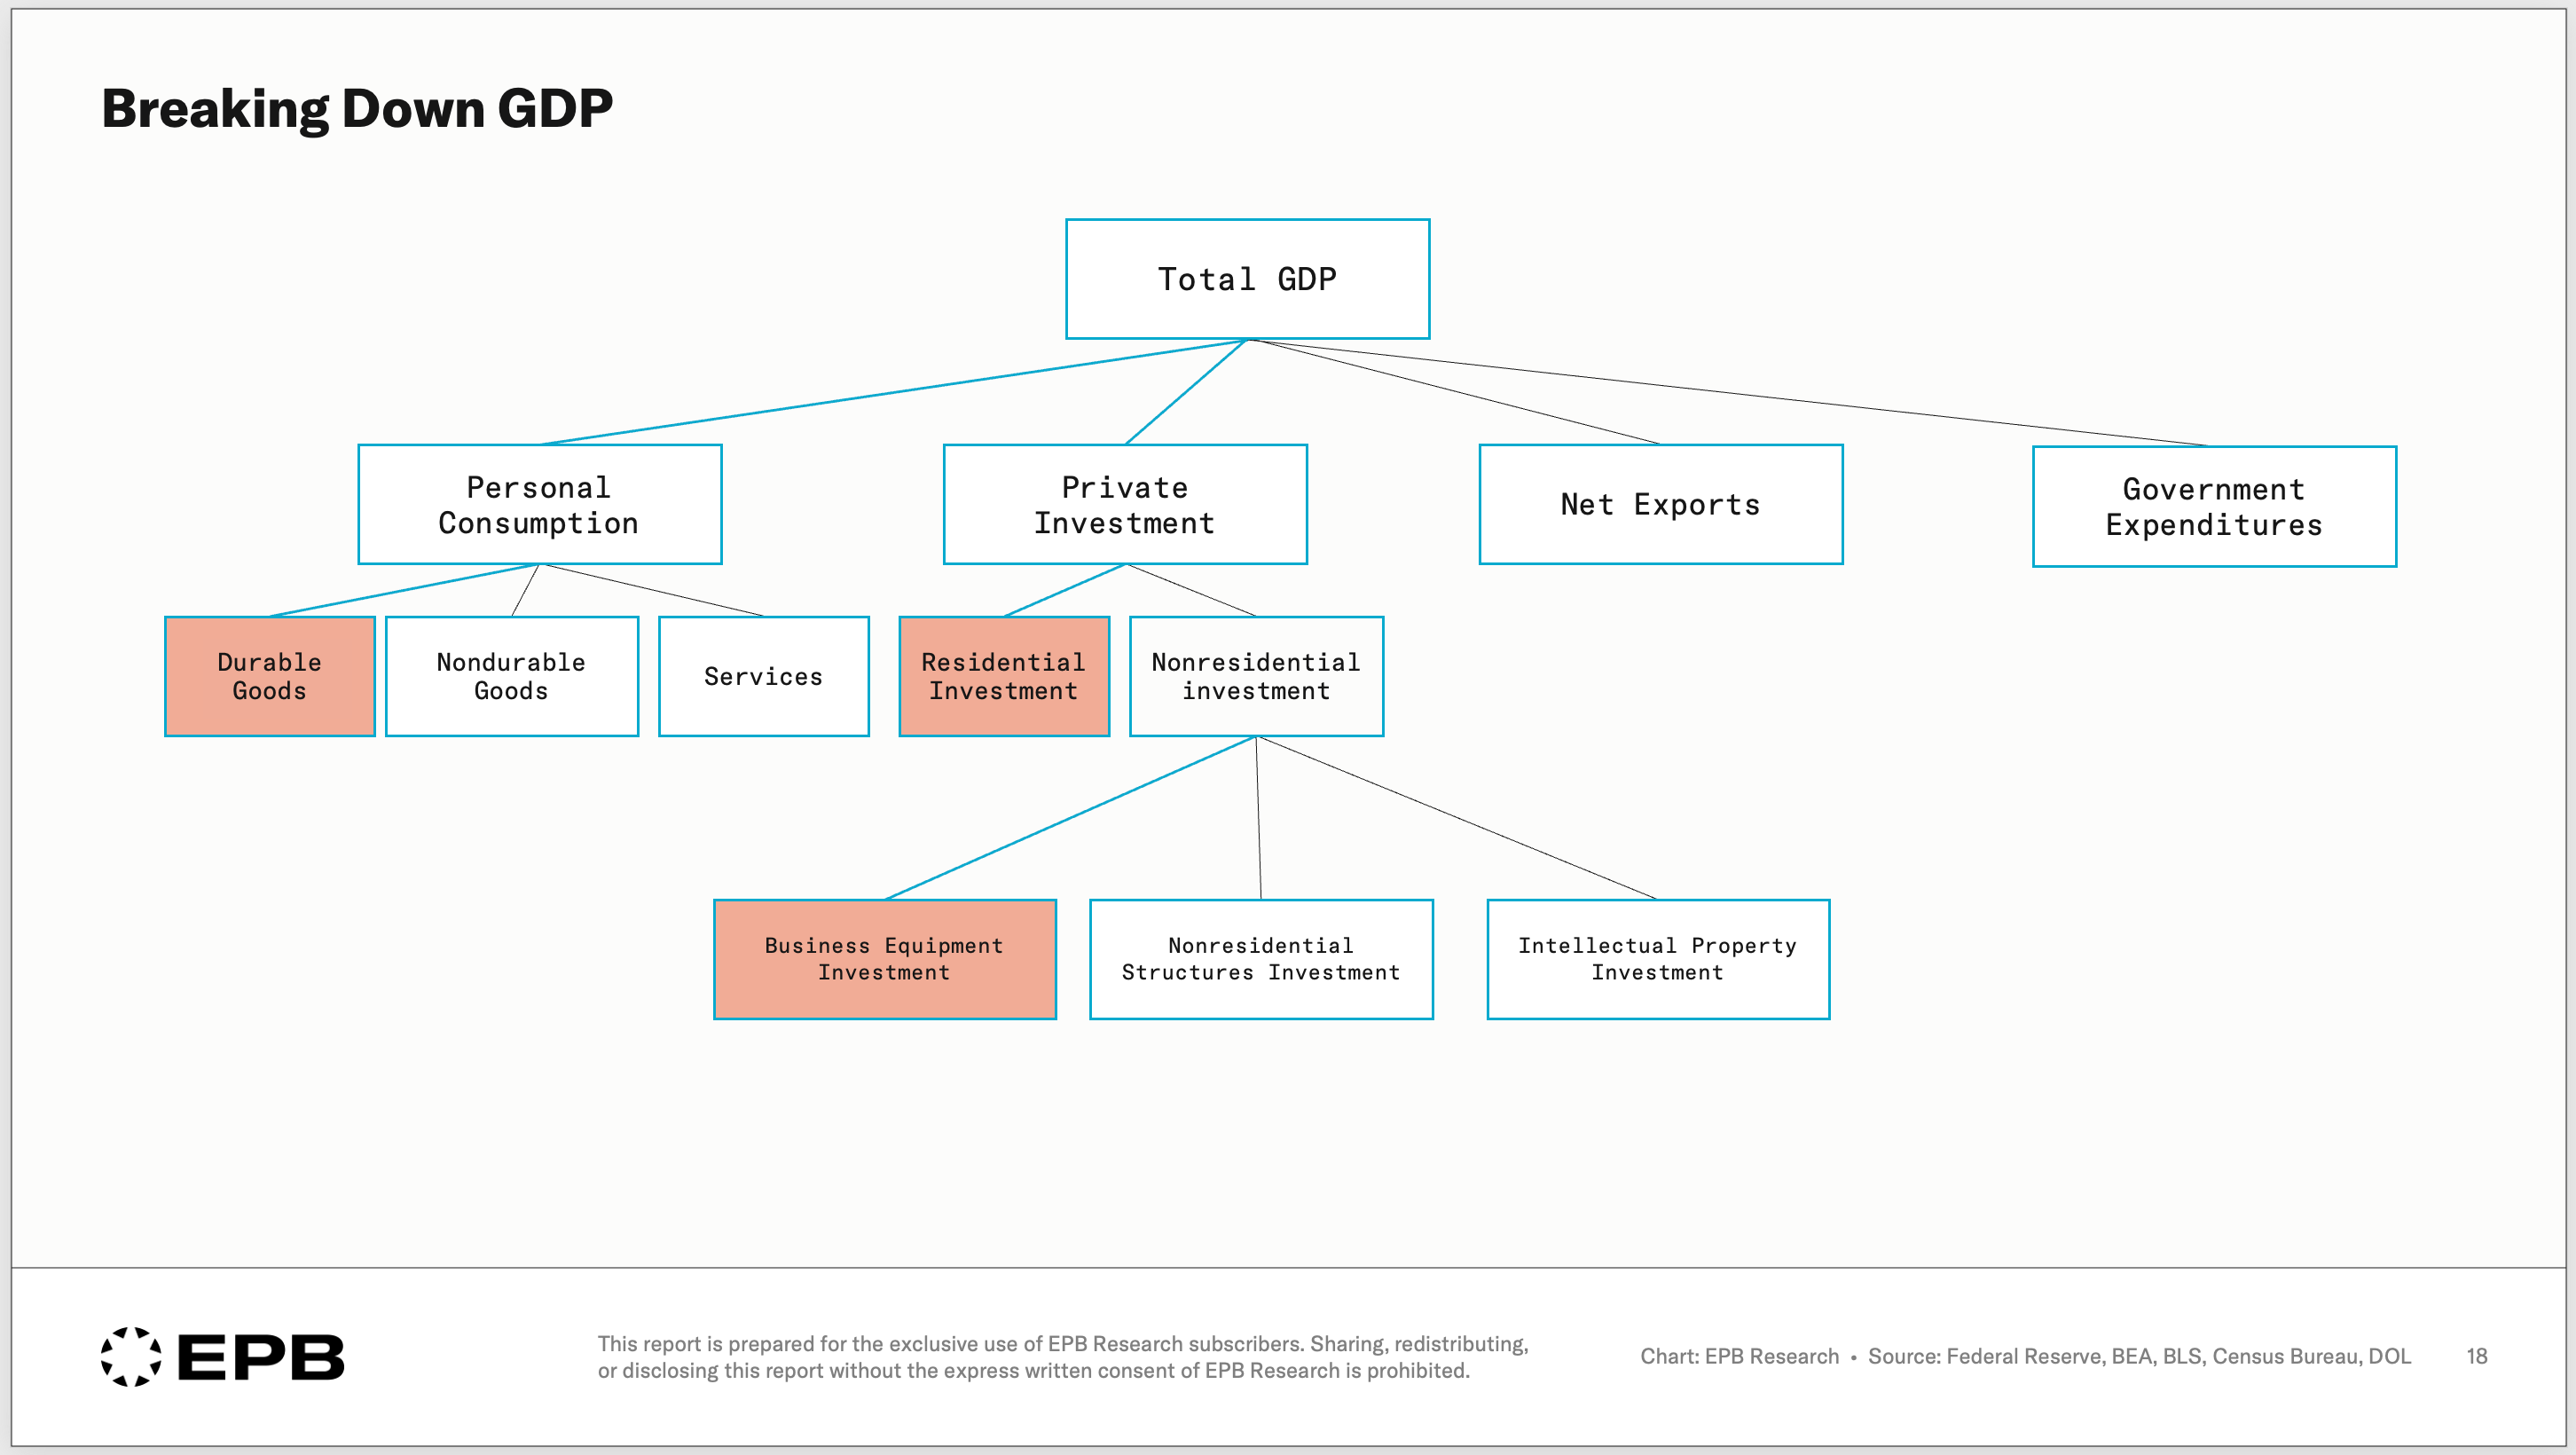
Almost all the items in the less important 80% are either services or non-durable goods. That leaves the durable goods as the important swing factor.

The highly cyclical consumer spending categories are durable goods, which are big-ticket and generally purchased with financing, so they are sensitive to interest rates.
Motor vehicles and parts is 3.5% of consumer spending. Its cycle behavior is completely different from the stable categories. Average growth in expansions is 8.4%. In recessions, -4.8%. The expansion-recession spread is over 13 percentage points. This is the single most important factor in the consumer spending basket as it relates to the business cycle, even though it accounts for only 3.5% of the total.
Compare that to health care, the largest consumer category. The expansion-recession spread is 0.4 percentage points.
We also see very large swings in growth between expansions and recessions in recreational goods, furniture, household appliances, and transportation services.
When the labor market starts to cool and consumers start to feel the pinch, these are the categories where it shows up first. They are small, and they don’t move the total right away, so if you are watching the consumer as one big bucket, you’ll never see the early signs.
Putting It All Together
The consumer is 70% of GDP. This is true. But more than half of consumer spending belongs to categories that have essentially the same growth rate in expansions and recessions. They do not signal where the cycle is heading, and they can even mask the trends that are really developing beneath the surface.
A very narrow slice of consumer spending is actually volatile and provides a true signal of the underlying economy's momentum. Broadly speaking, these are durable goods.
The business cycle is not driven by the 70% of GDP. It is driven by a narrow slice within that 70% that most commentary never isolates.
At EPB Research, we focus on the three primary pressure points of the economy that drive all the booms and busts, and durable goods consumption is the only slice of consumer spending worth watching, along with residential housing investment and business equipment investment.
If you want this kind of analysis in your inbox every week, sign up for this free blog.
Also, check out our free videos on YouTube.

Wow, how profound: "The business cycle is not driven by the 70% of GDP. It is driven by a narrow slice within that 70% that most commentary never isolates." The Austrian Business Cycle has been eloquently refined.
Austrian Business Cycle - Why are there constant “booms & busts”?
“When the government and its central bank encourages the expansion of bank credit, it not only causes price inflation, but it also causes increasing malinvestments, specifically unsound investments in capital goods and underproduction of consumer goods. Hence, the government-induced inflationary boom not only injures consumers by raising prices and the cost of living, but also distorts production, and creates unsound investments. The government is then faced repeatedly with two basic choices: either stop its monetary and bank credit inflation, which then will necessarily be followed by a recession which serves to liquidate the unsound investments and return to a genuinely free-market structure of investment and production; or: continue inflating until a runaway inflation totally destroys the currency and brings about social and economic chaos.” Murray N. Rothbard