

How to Read the GDP Report in 4 Steps
Most of GDP can't tell you where the cycle is going. Here's the part that can.

Before diving into the post, I wanted to let you know that EPB Research has a free Sunday newsletter.
One email per week with ongoing business cycle education plus live examples of the framework in action. Click the button below to join for free.
Now, let’s talk GDP and how to use it.
GDP is the most widely reported statistic in economic data, but the headline number contains very little information about the direction or momentum of the economy.
When the GDP numbers are released, and everyone starts quoting the growth rate, what you really want to know is if the economy is in danger or if it’s all clear ahead.
The single GDP number the financial media reports will not do that.
The economy moves in a sequence, with some sectors always moving before the average and some sectors always moving after the average.
The commonly cited headline GDP number blends leading and lagging sectors, masking the true signal of the underlying economy and any warning signs that may exist.
In this post, we’ll review a quick four-step process for getting the most out of the quarterly GDP numbers and extracting the information needed to determine if the economy is in danger or if it’s all clear ahead.
First, Nominal vs. Real
The first thing you have to do is decide if you want to measure nominal growth or real growth.
Nominal growth is real growth plus inflation, so you are measuring the combination of growth and price.
Recessions are “real” concepts, but there’s value and information in both the nominal numbers and the real numbers.
In this post, we’ll use nominal growth as the measure.
Second, Strip The Noise
Some parts of the economy or GDP are extremely noisy.
GDP is made up of personal consumption, private sector investment, government spending, and net exports (trade).
Private investment measures investment in residential and nonresidential structures and equipment, plus changes in private inventories.
Swings in trade and changes in private inventories can swing randomly quarter to quarter and often do nothing but cloud the reading of the core, underlying economy.
For almost all purposes, you should strip them out.
The chart below shows a GDP map, with net exports and inventories highlighted. Everything else is “core GDP.”
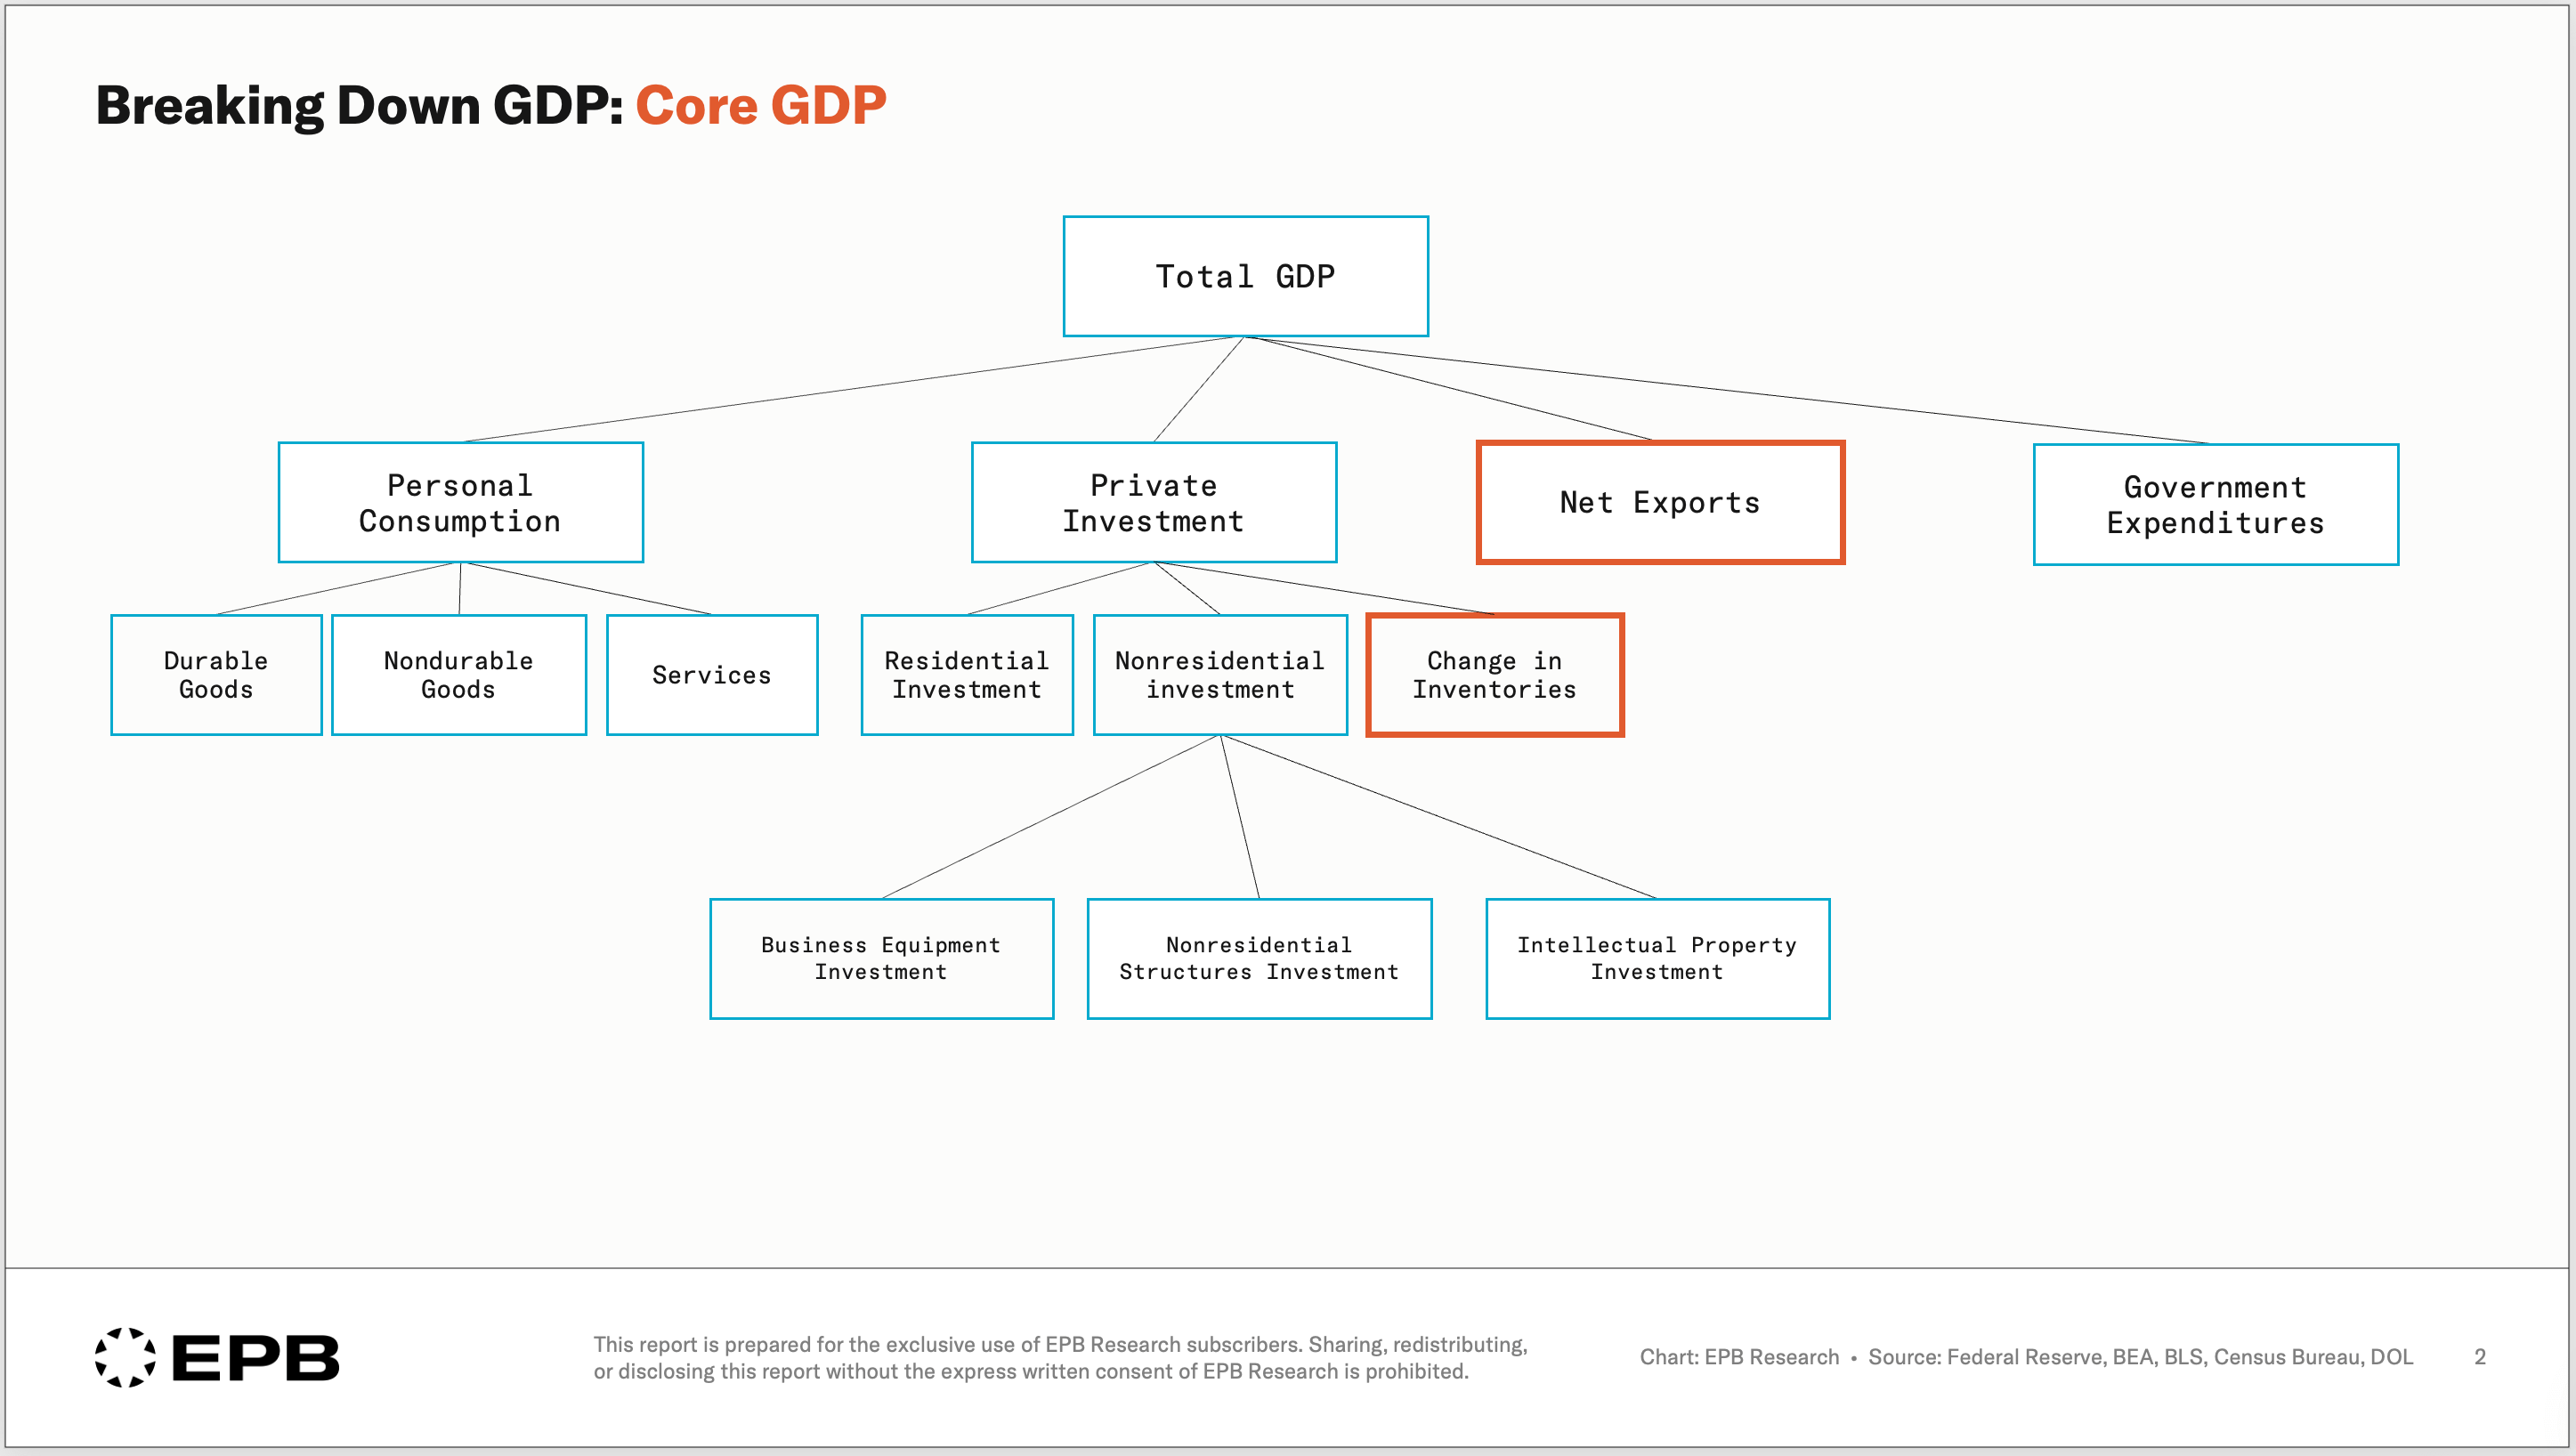
Inventories can add to growth one quarter as businesses restock and subtract from it the next as they de-stock.
Trade can swing based on the timing of imports and exports and has been even more volatile recently due to tariffs.
Remove them, and you are left with core GDP, a far better measure of the demand actually flowing through the domestic economy.
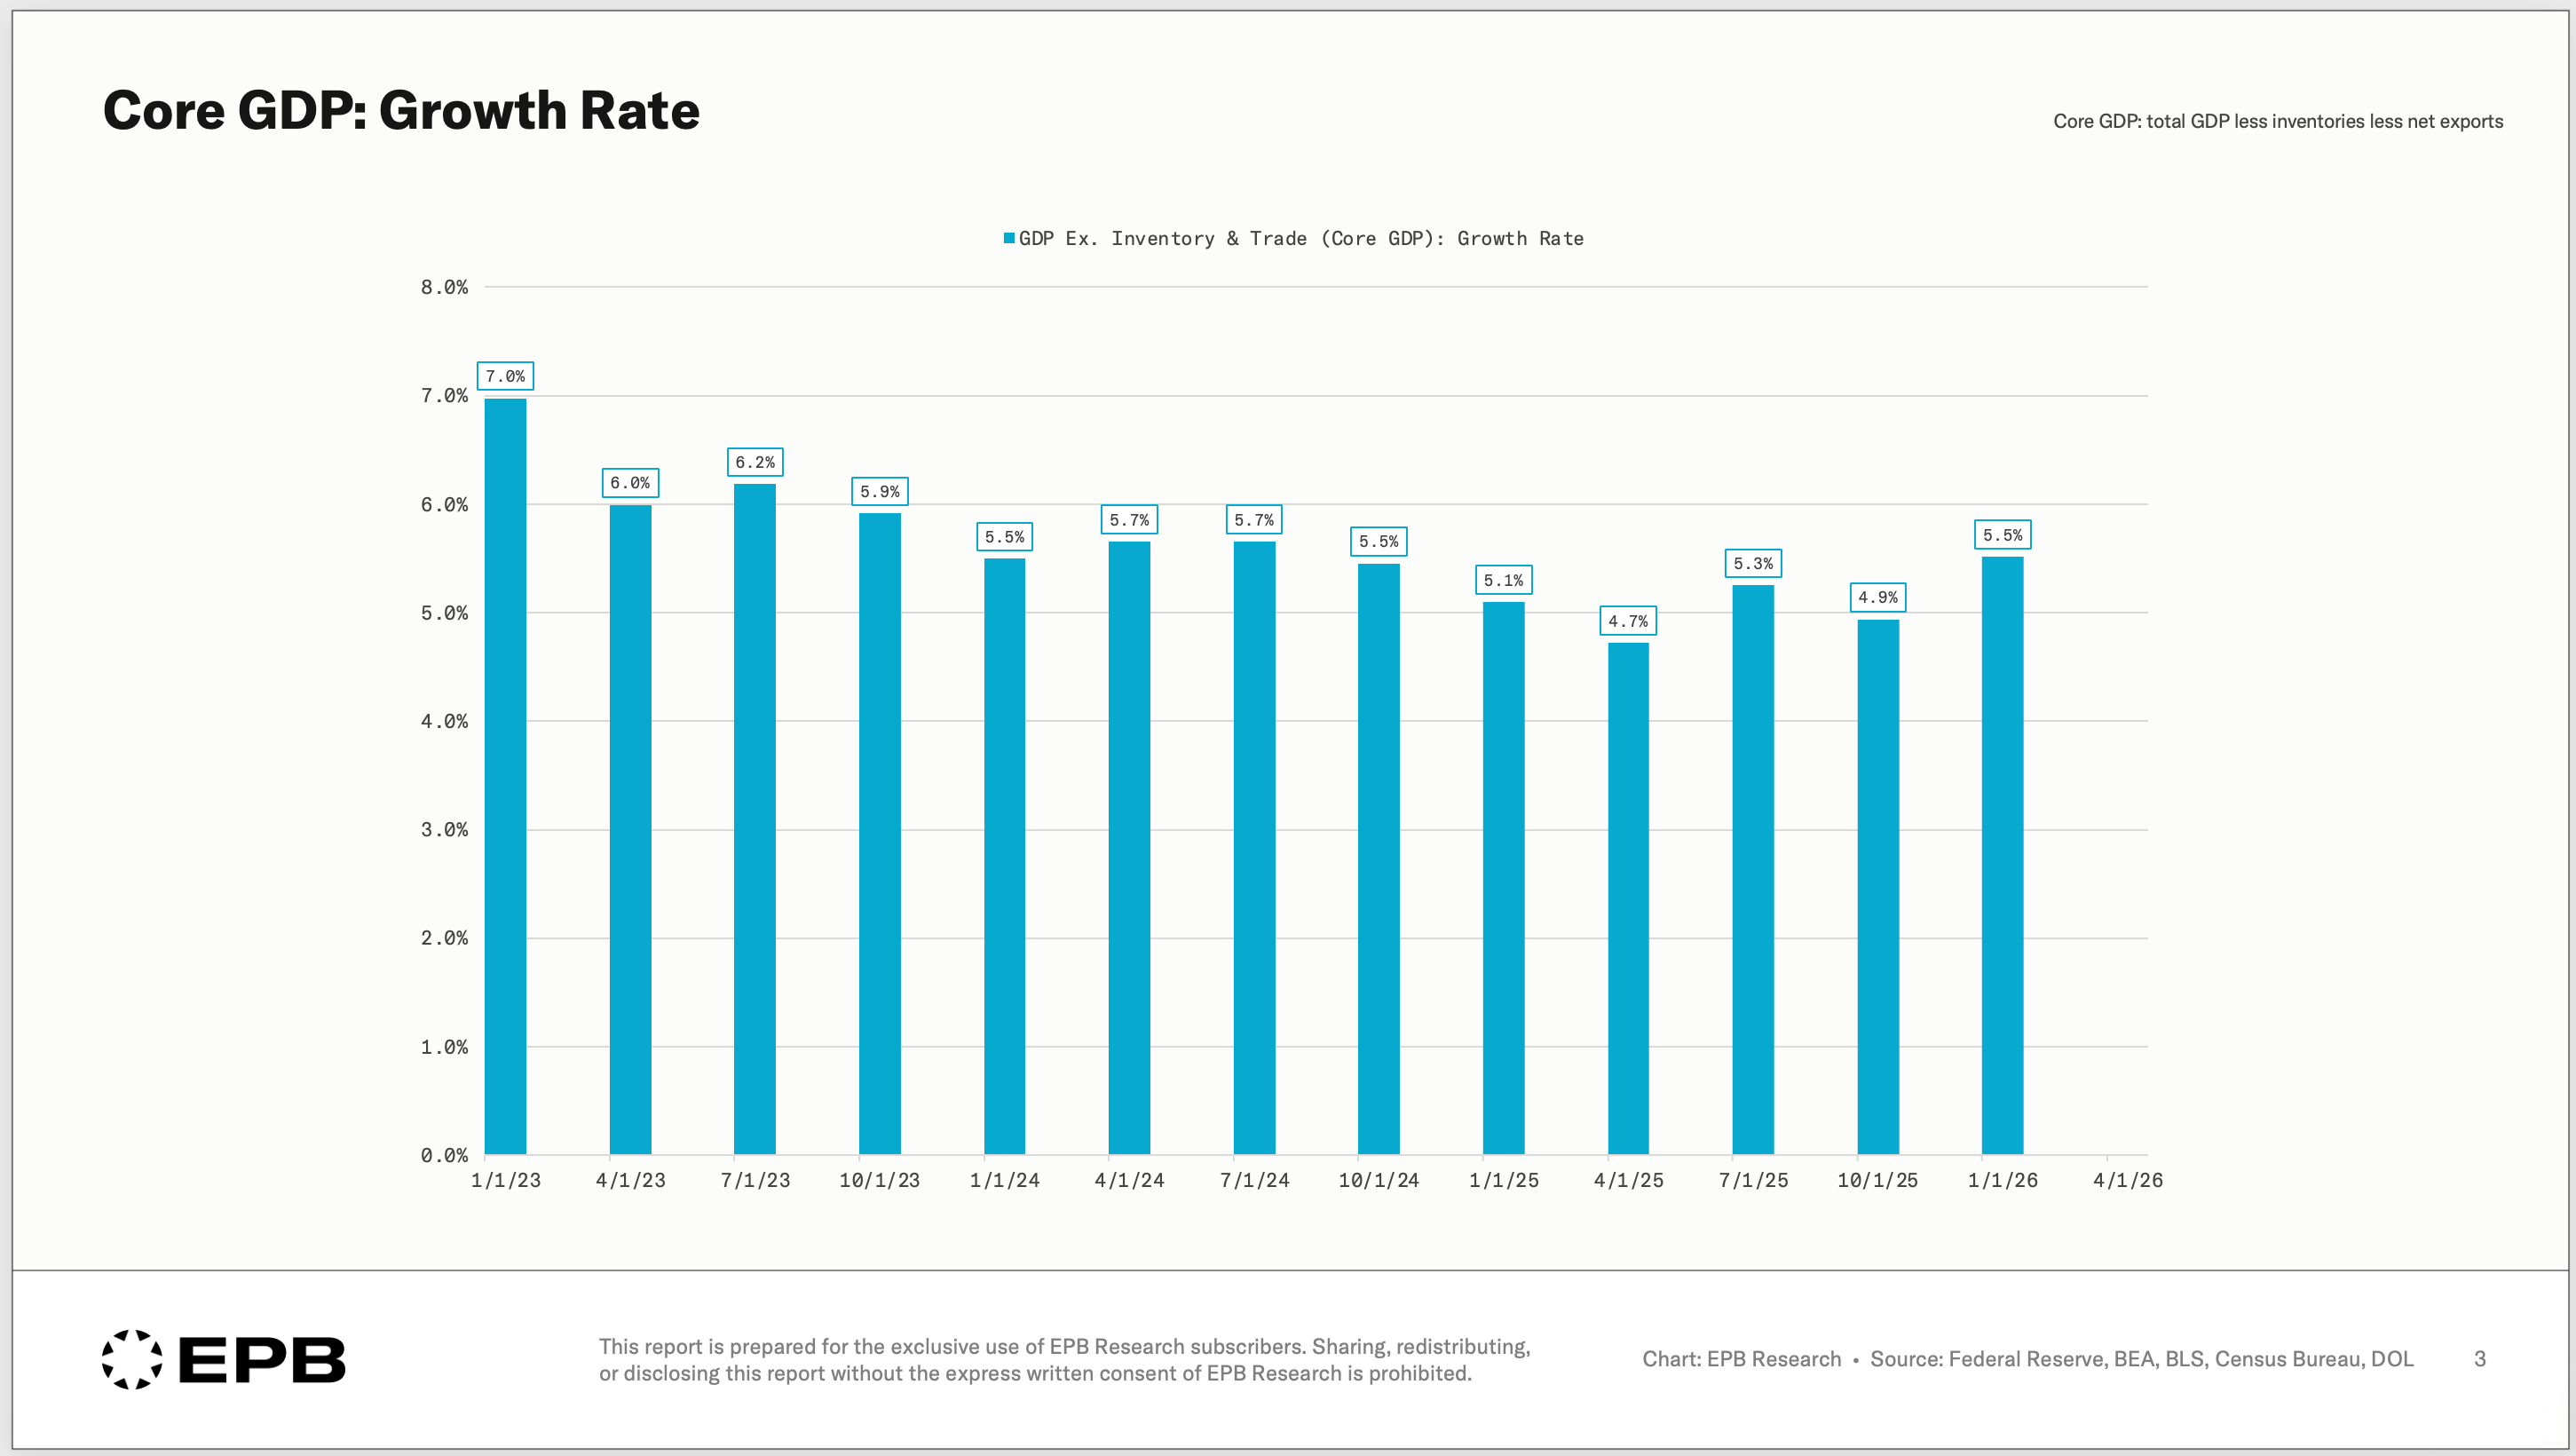
In nominal terms, core GDP has been remarkably stable over the last 2-3 years. But remember, this picture blends the leading and lagging sectors.
Yes, it is the truest measure of how the economy is doing today, but it provides no signal of underlying momentum or warning signs beneath the surface.
Third, Read The 20%, Not The 80%
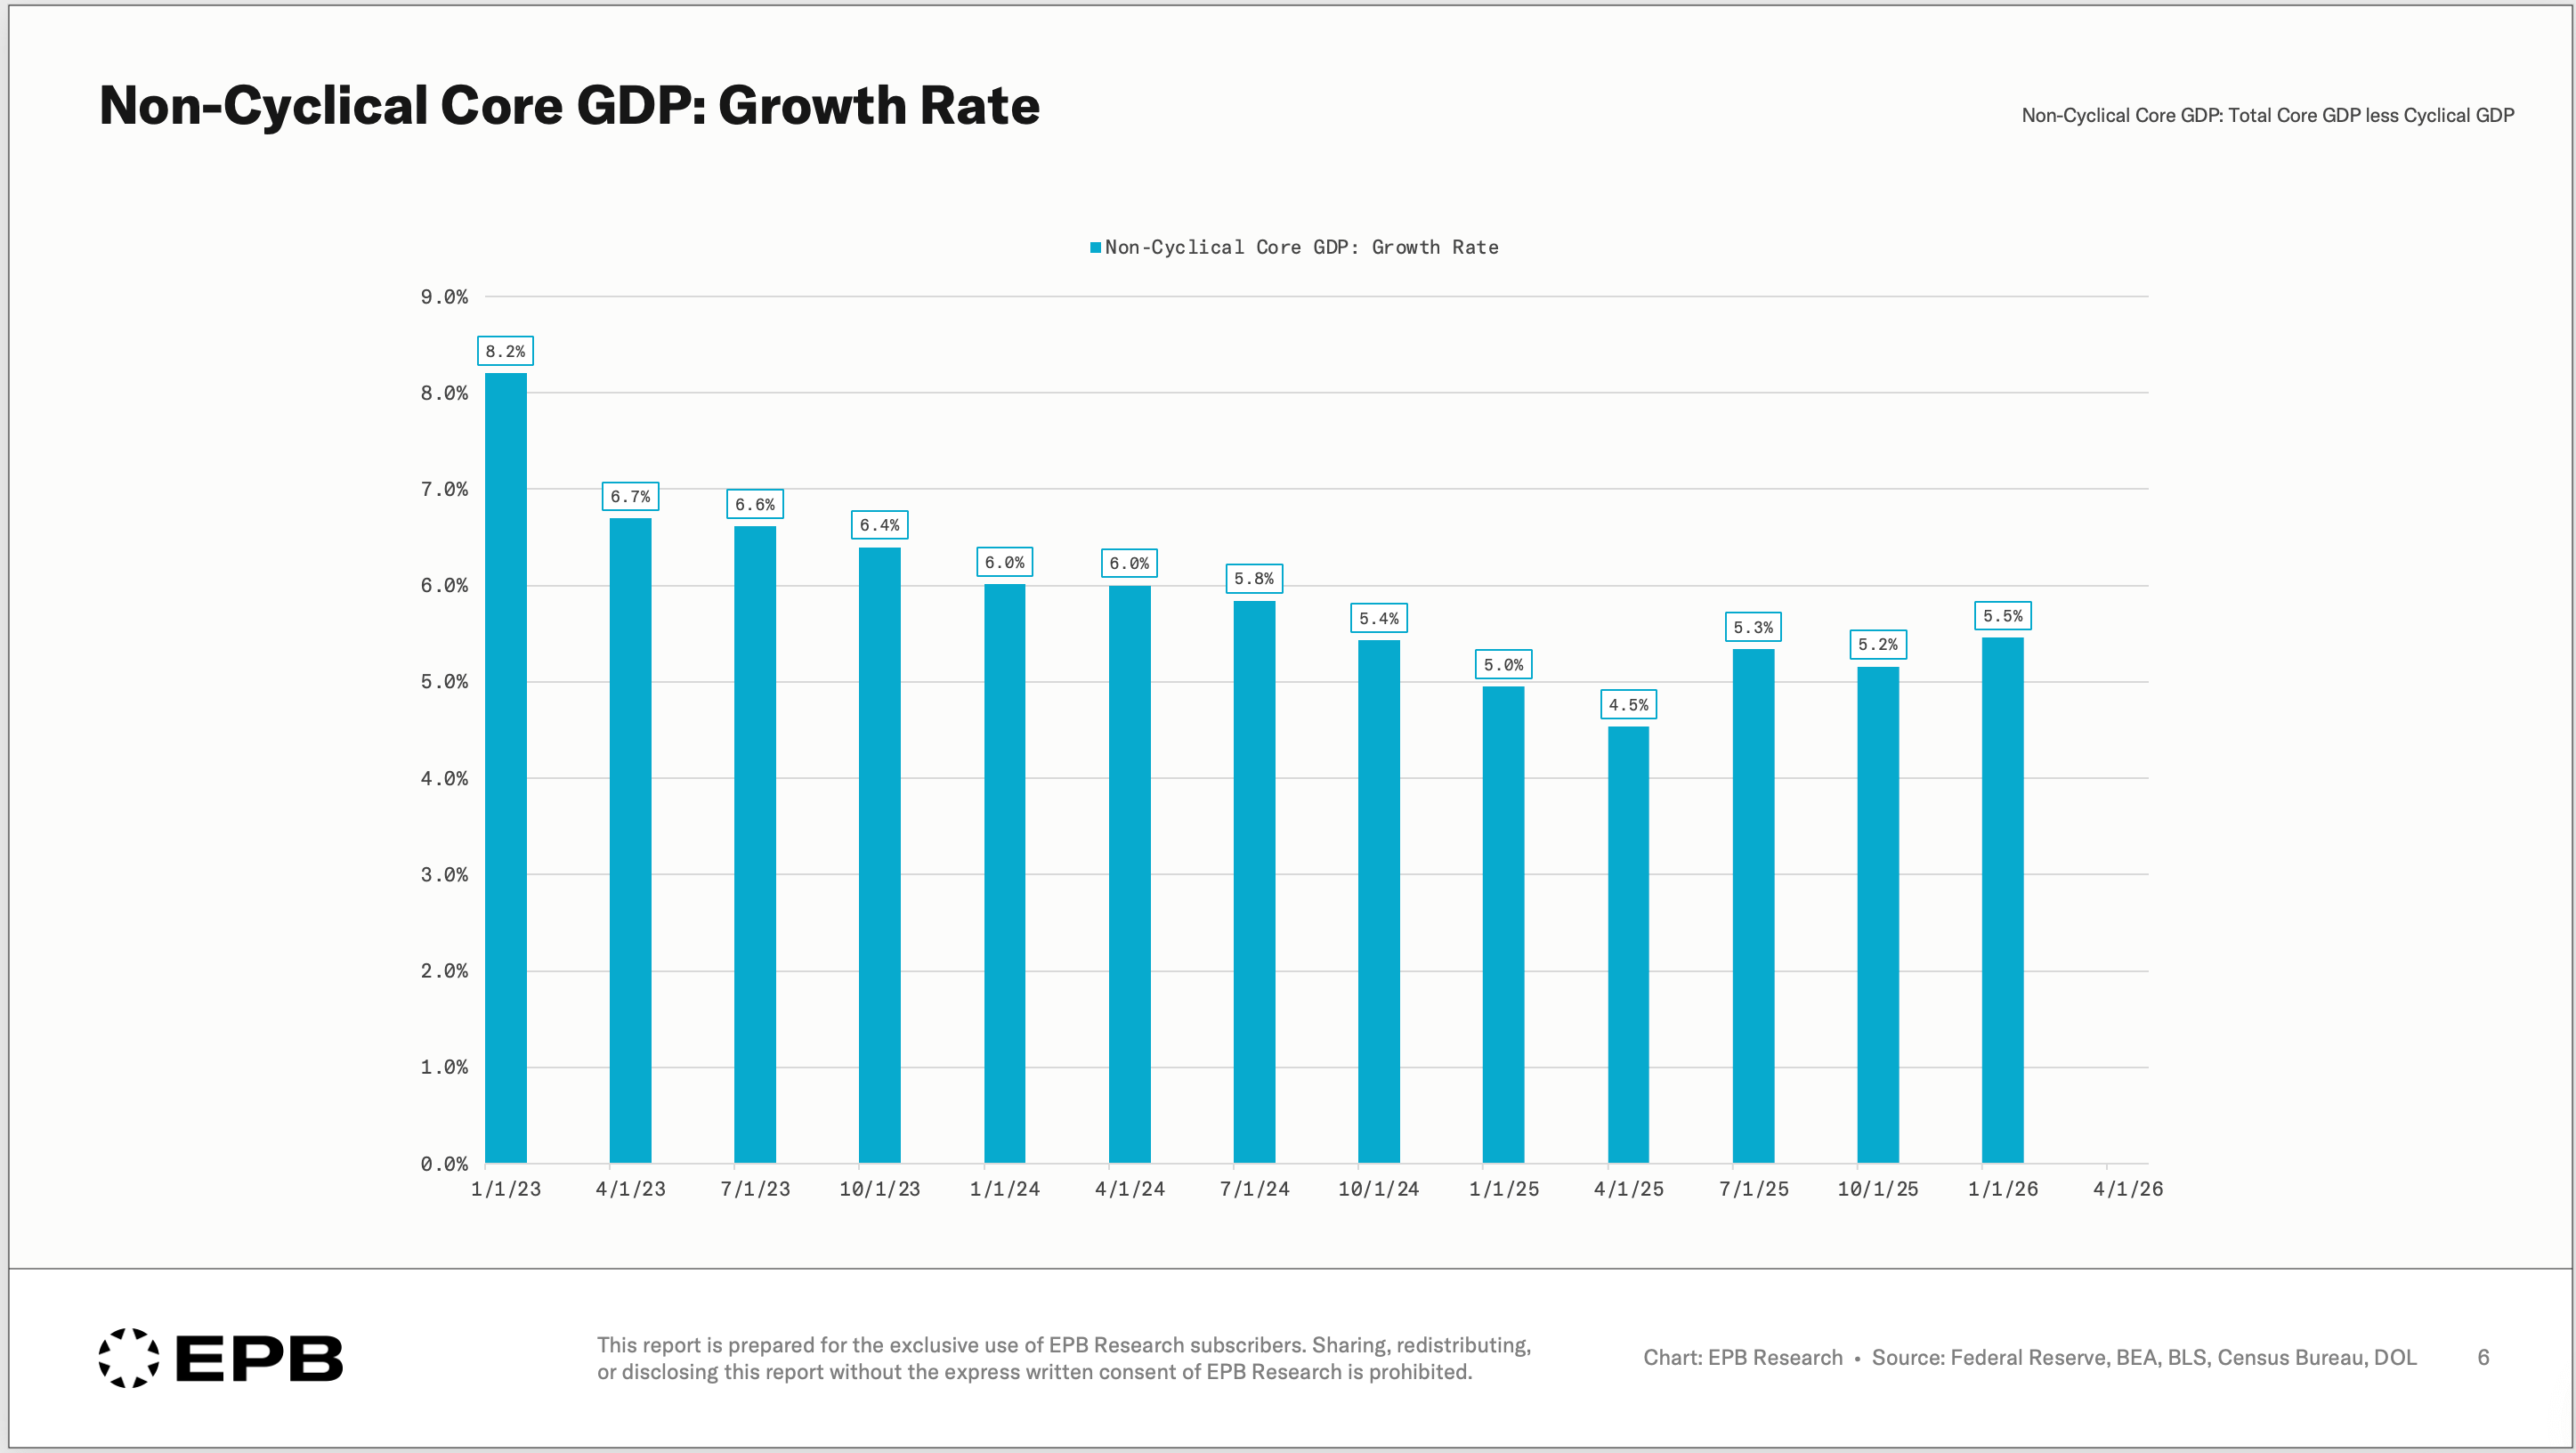
80% of the economy is the lagging or stable part. These sectors, which include most of personal consumption, nonresidential investment, and government spending, are extremely stable and often don’t even decline during recessionary periods, let alone provide any warning signal.
Through booms and busts, this non-cyclical part of the economy, this massive 80% piece of the pie, hardly changes.
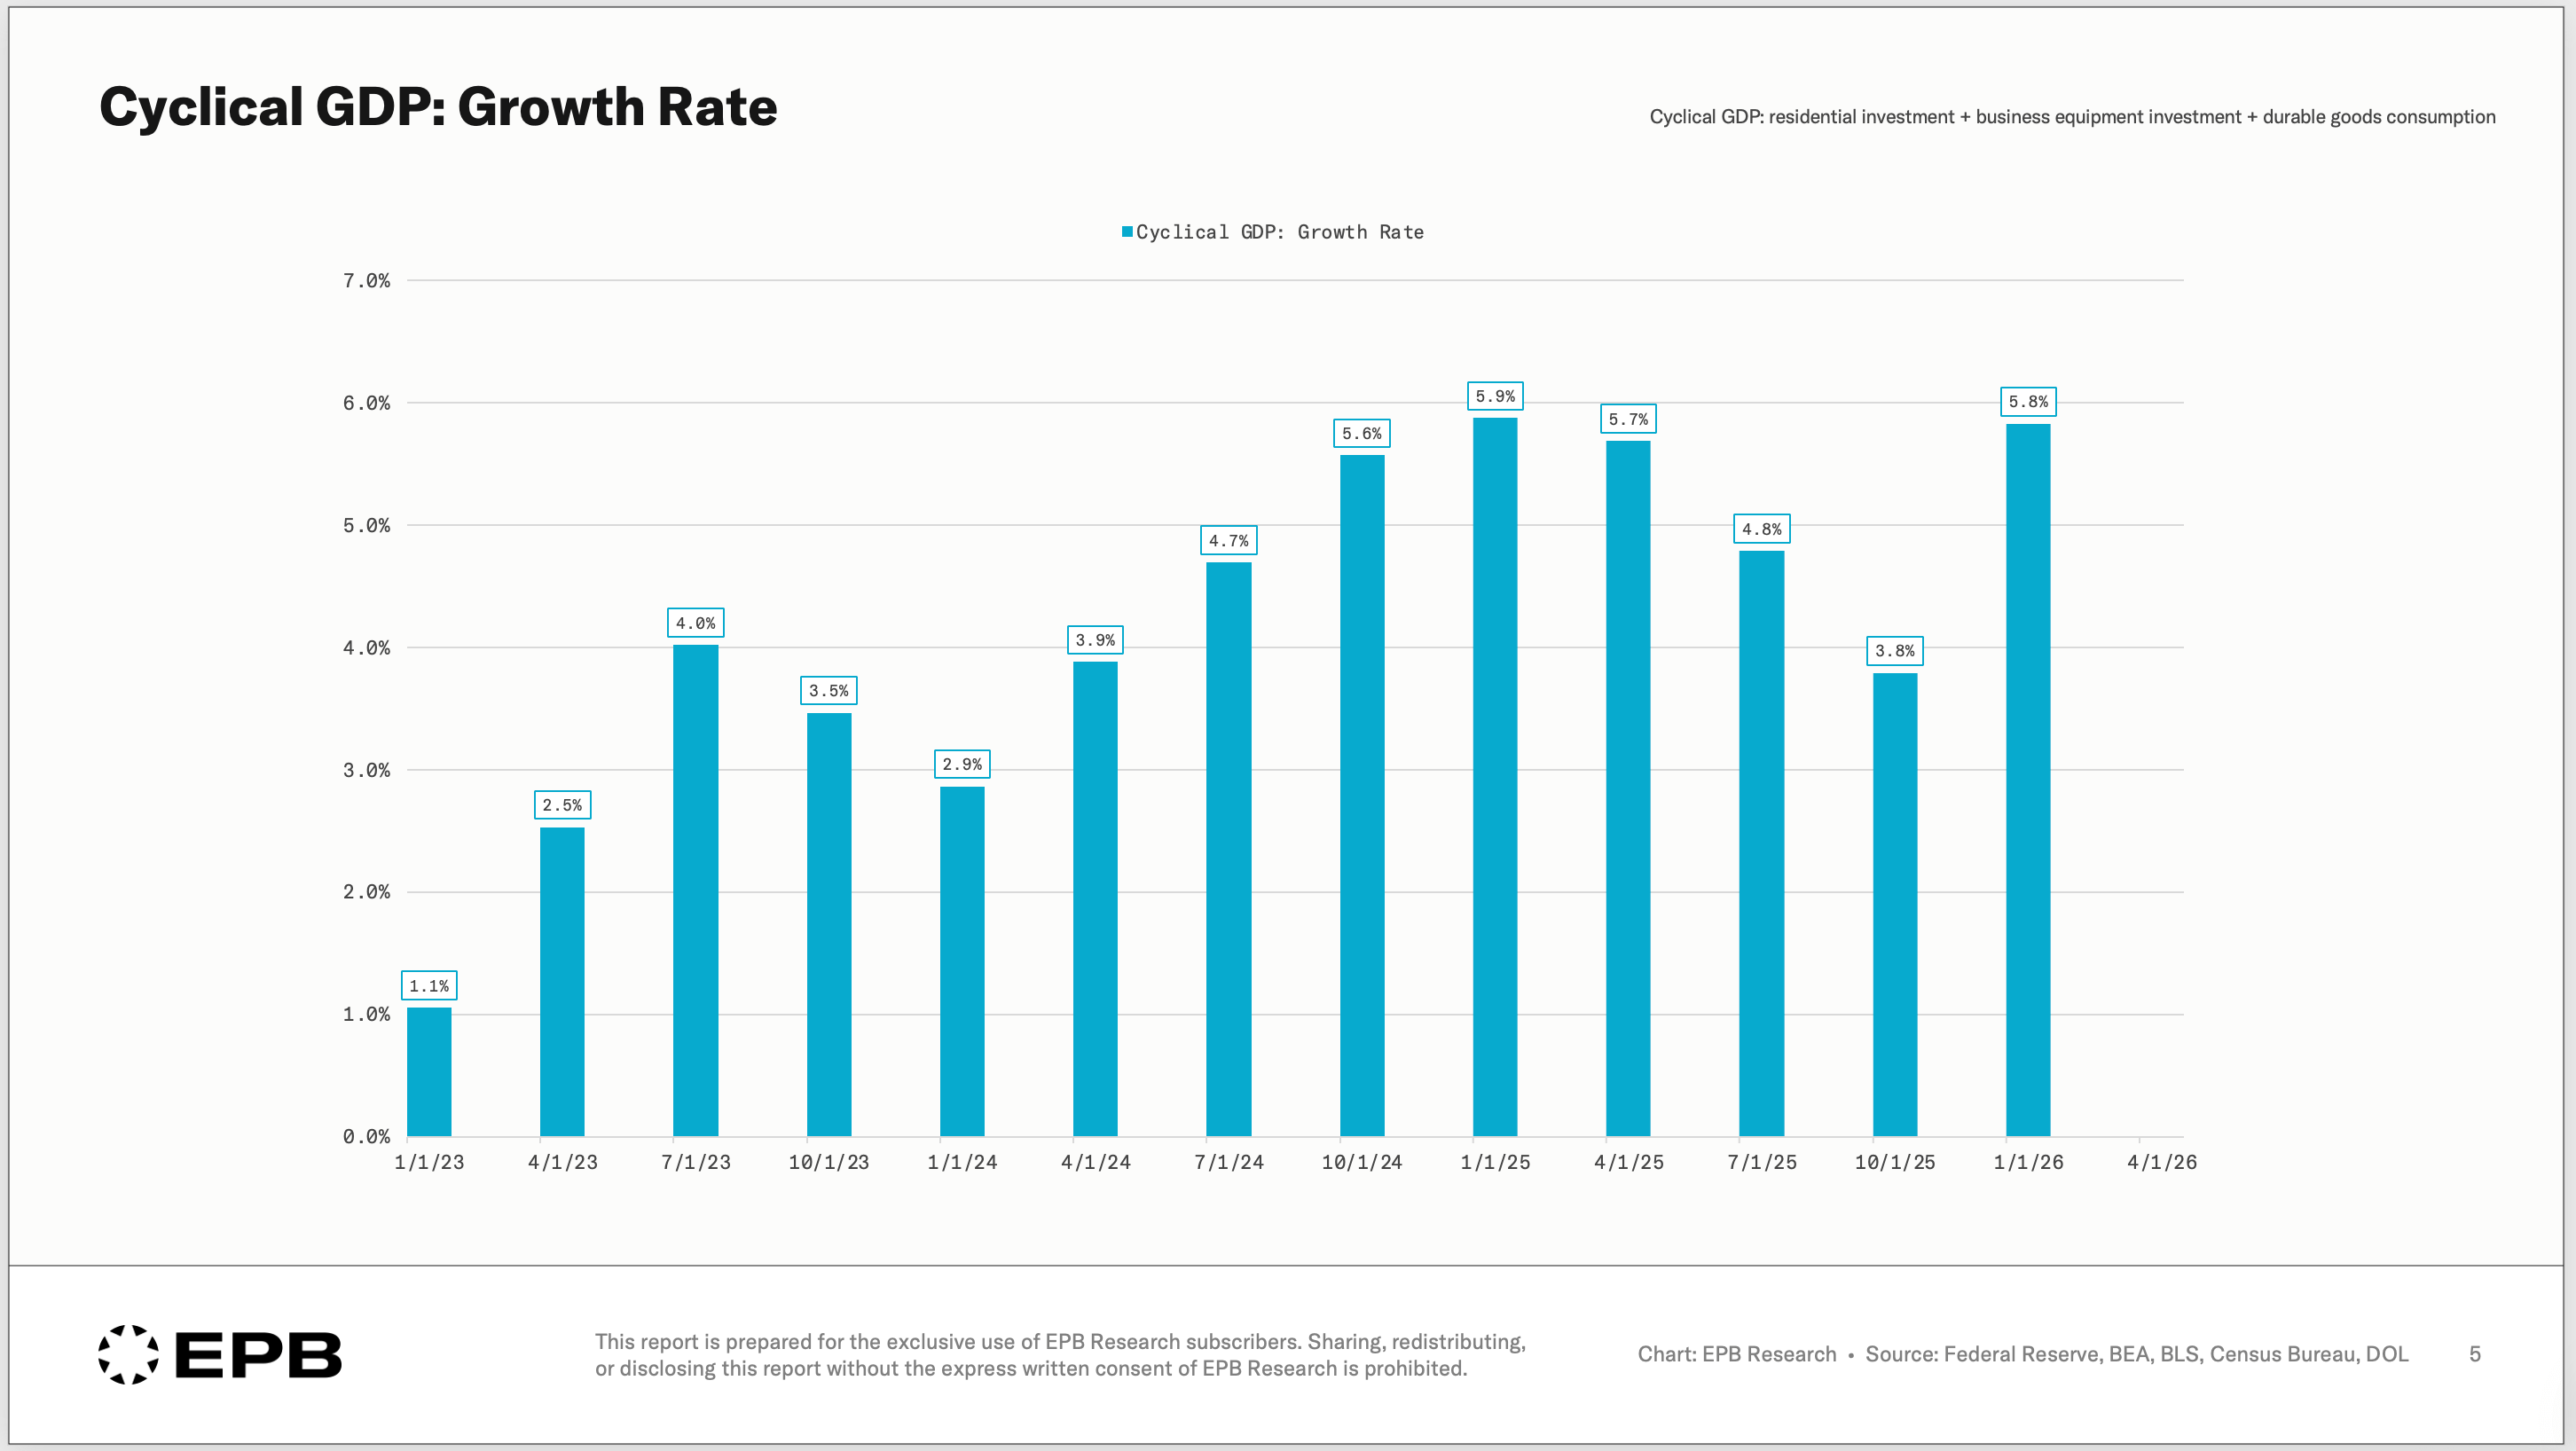
The cyclical signal lives in the slice that is left, about 20% of the economy, built from just three components: durable-goods consumption, business-equipment investment, and residential investment.
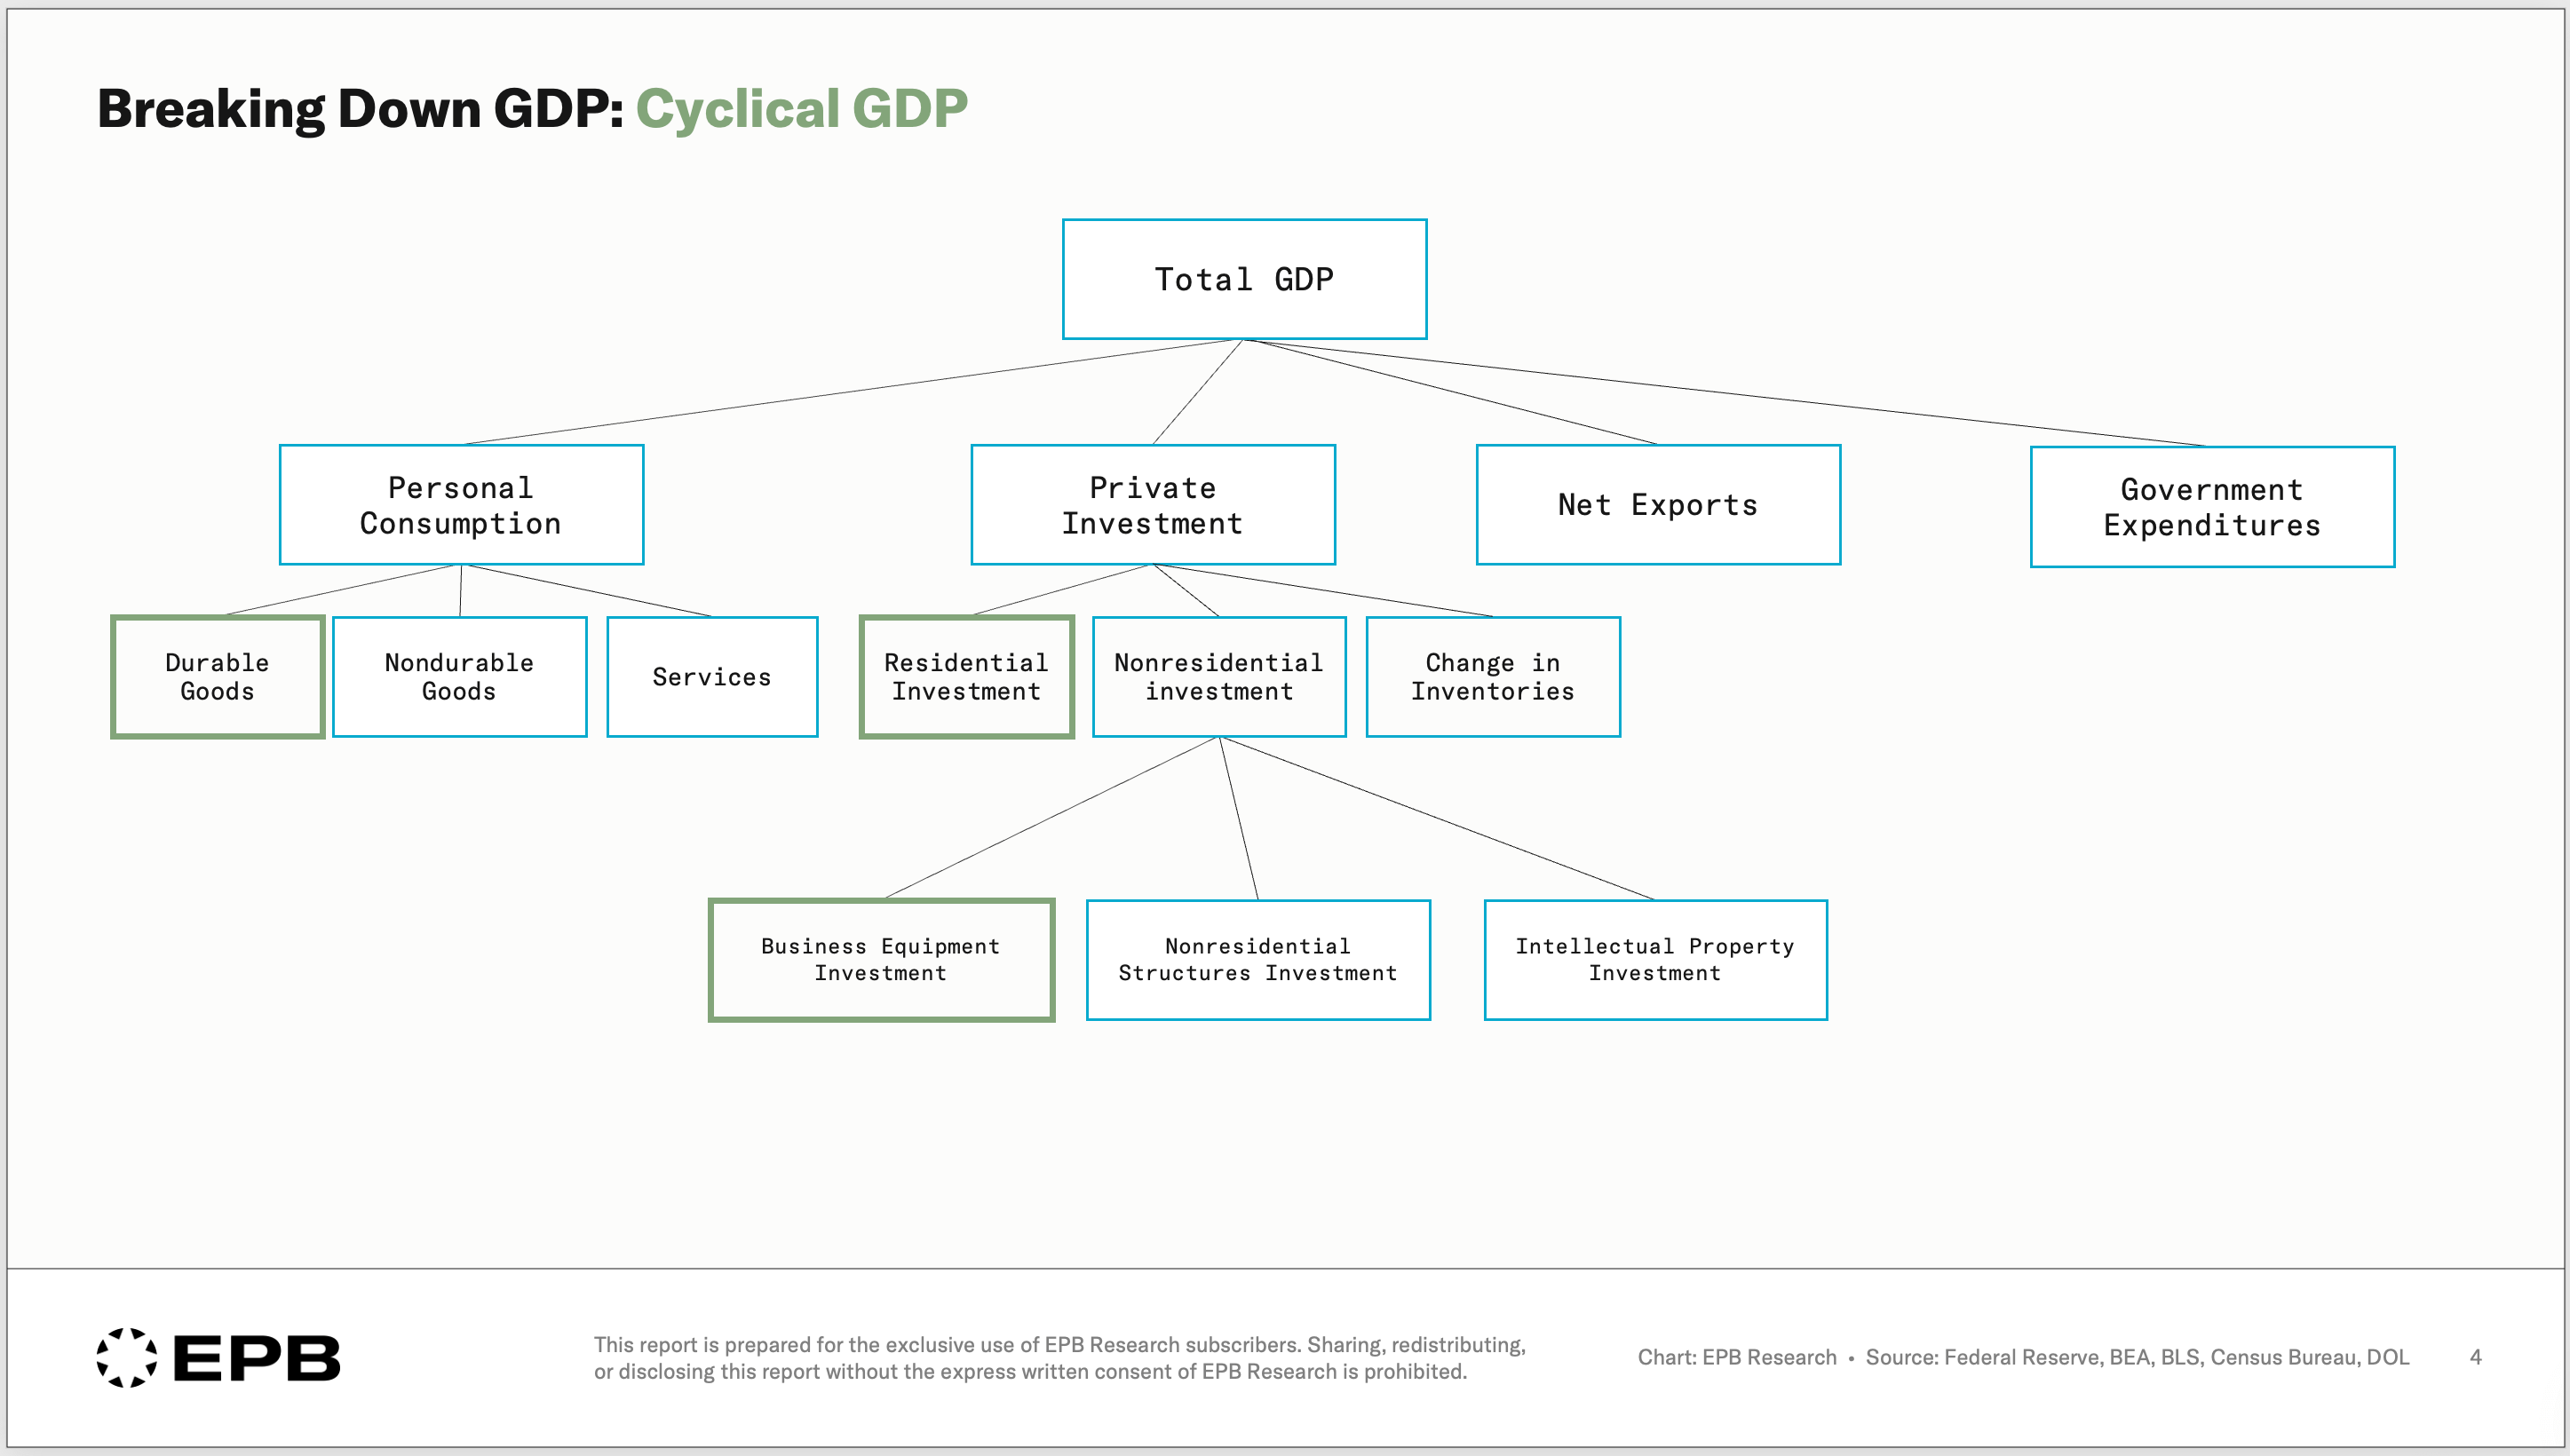
These three components are sensitive to changes in interest rates and are more discretionary.
You can delay the purchase of a new car more easily than you can skip a trip to the grocery store for a week of dinners.
You can delay the remodel of your kitchen more easily than you can skip a doctor's appointment or a prescription refill.
These small examples illustrate the difference between cyclical and non-cyclical economies.
The smaller, more cyclical slice is where expansions and recessions actually show up.
Size is not what’s important. 80%, in this case, does not beat 20%.
The part that actually determines the fate of the business cycle is the one the headline easily drowns out.
Fourth, Compare To History
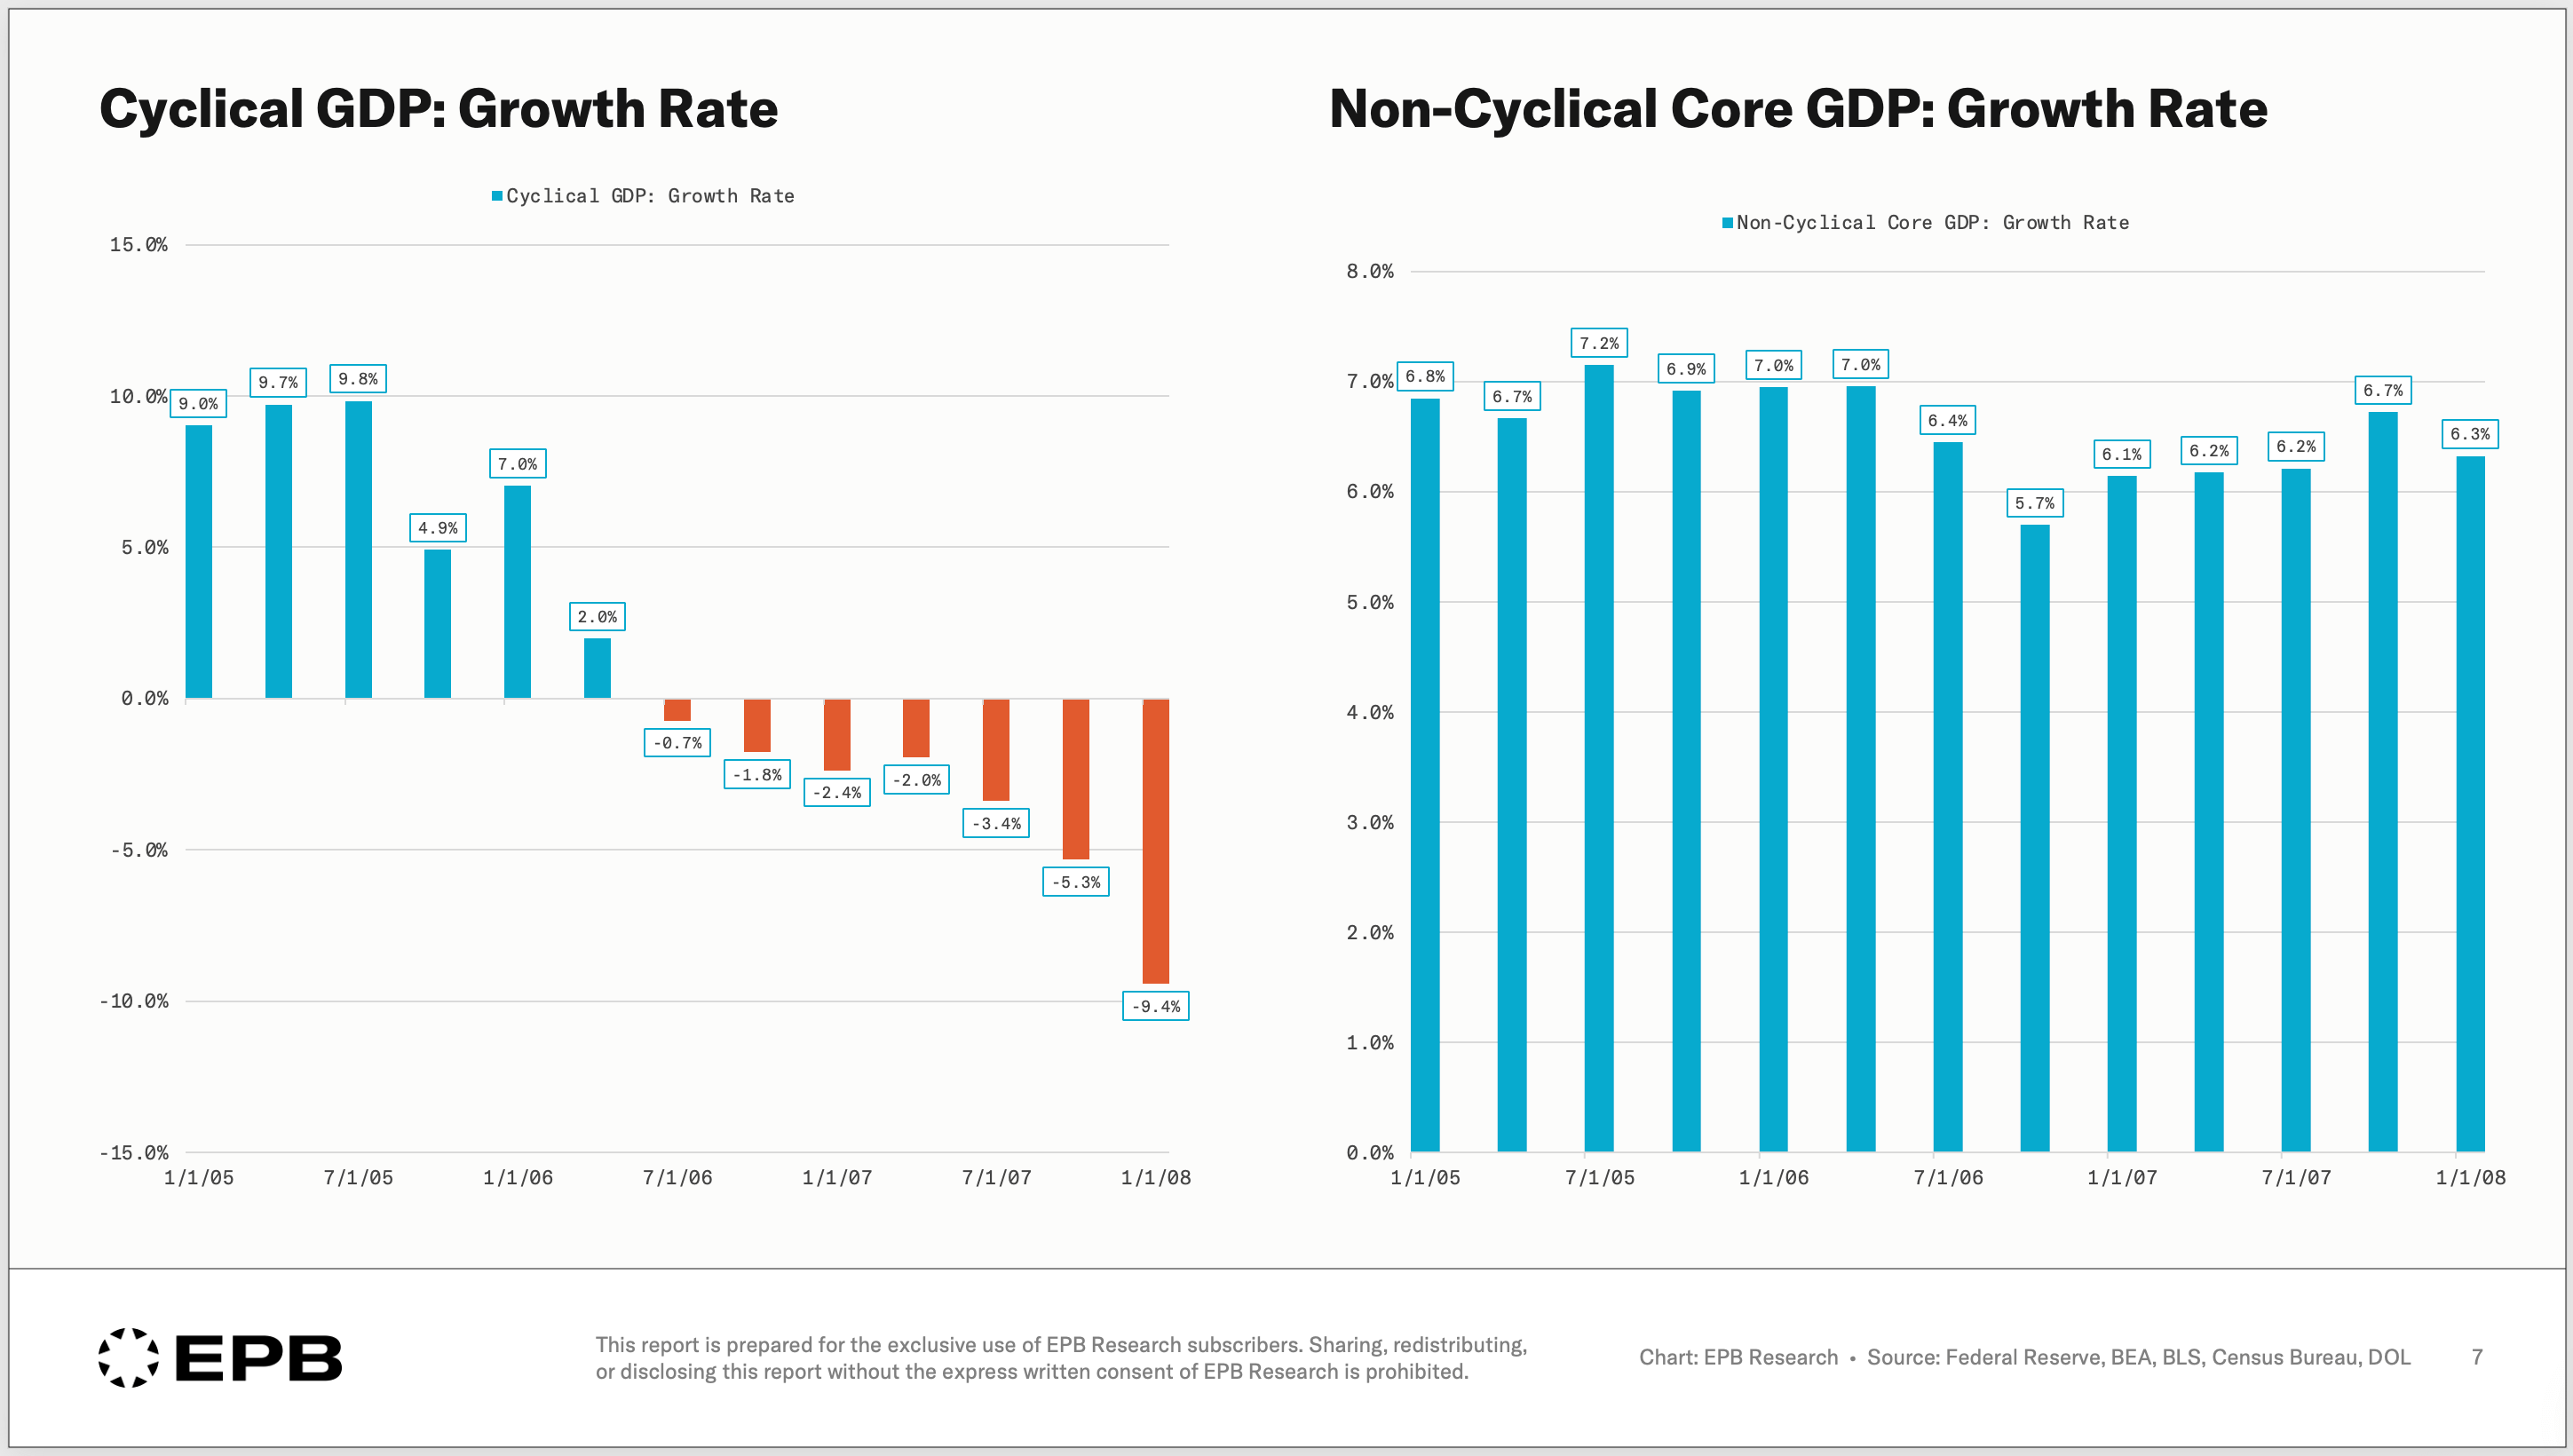
Run the split across past recessions, and the pattern is consistent. Cyclical leads and non-cyclical lags.
But more importantly, comparing today's cyclical growth rate and trend to past expansions and recessions gives the analysis depth and puts today’s numbers in context.
The cyclical slice began contracting in 2006 (in nominal dollars) and was declining at a 9% rate by the time the 2008 recession began.
That compares to non-cyclical GDP, which was flat for the three years leading up to the recession, and growing at 6% nominal in Q1 2008.
80% of the economy told you absolutely nothing about what was brewing under the hood.
The cycle is not in the big number. It is in the small one.
The key takeaway is that the headline GDP number masks the true signal.
It mixes volatile data and lagging data with the cyclical parts of the economy that provide the signal, drowning out the real tell and the warning signs.
When the GDP data is released, decide whether to analyze real or nominal growth, strip out the volatile noise, and then compare the 20% cyclical slice vs. the 80% non-cyclical slice.
Ignore the “larger” parts of the economy and sayings like “we are a services economy.” That does nothing but get you into trouble or mislead you as to what’s really going on.
GDP is rich in information and some of the best data available.
Read it correctly, and it can inform the direction of the economy and the forward distribution of asset price returns.
Read it wrong, and it becomes another misused piece of information that makes you feel like the economy is not predictable.
But it is...
The economy moves in a repeatable sequence. You just need a framework and the sequence we outlined here.
For more on the business cycle and to see this framework applied to data every week, join the free EPB newsletter.
When you sign up, you also get our free “Breaking Down GDP” PDF guide.
Join the free EPB Newsletter by clicking here.
