

Half of US Home Prices Are at All-Time Highs. Half Are Underwater Since 2022
Half of the country had a real housing recession that the national index hid. One variable explains why.

Half of the major US cities are at all-time highs in home prices right now. The other half just went through a true correction.
The same Federal Reserve, same mortgage rates, and same monetary policy, but two completely different housing markets.
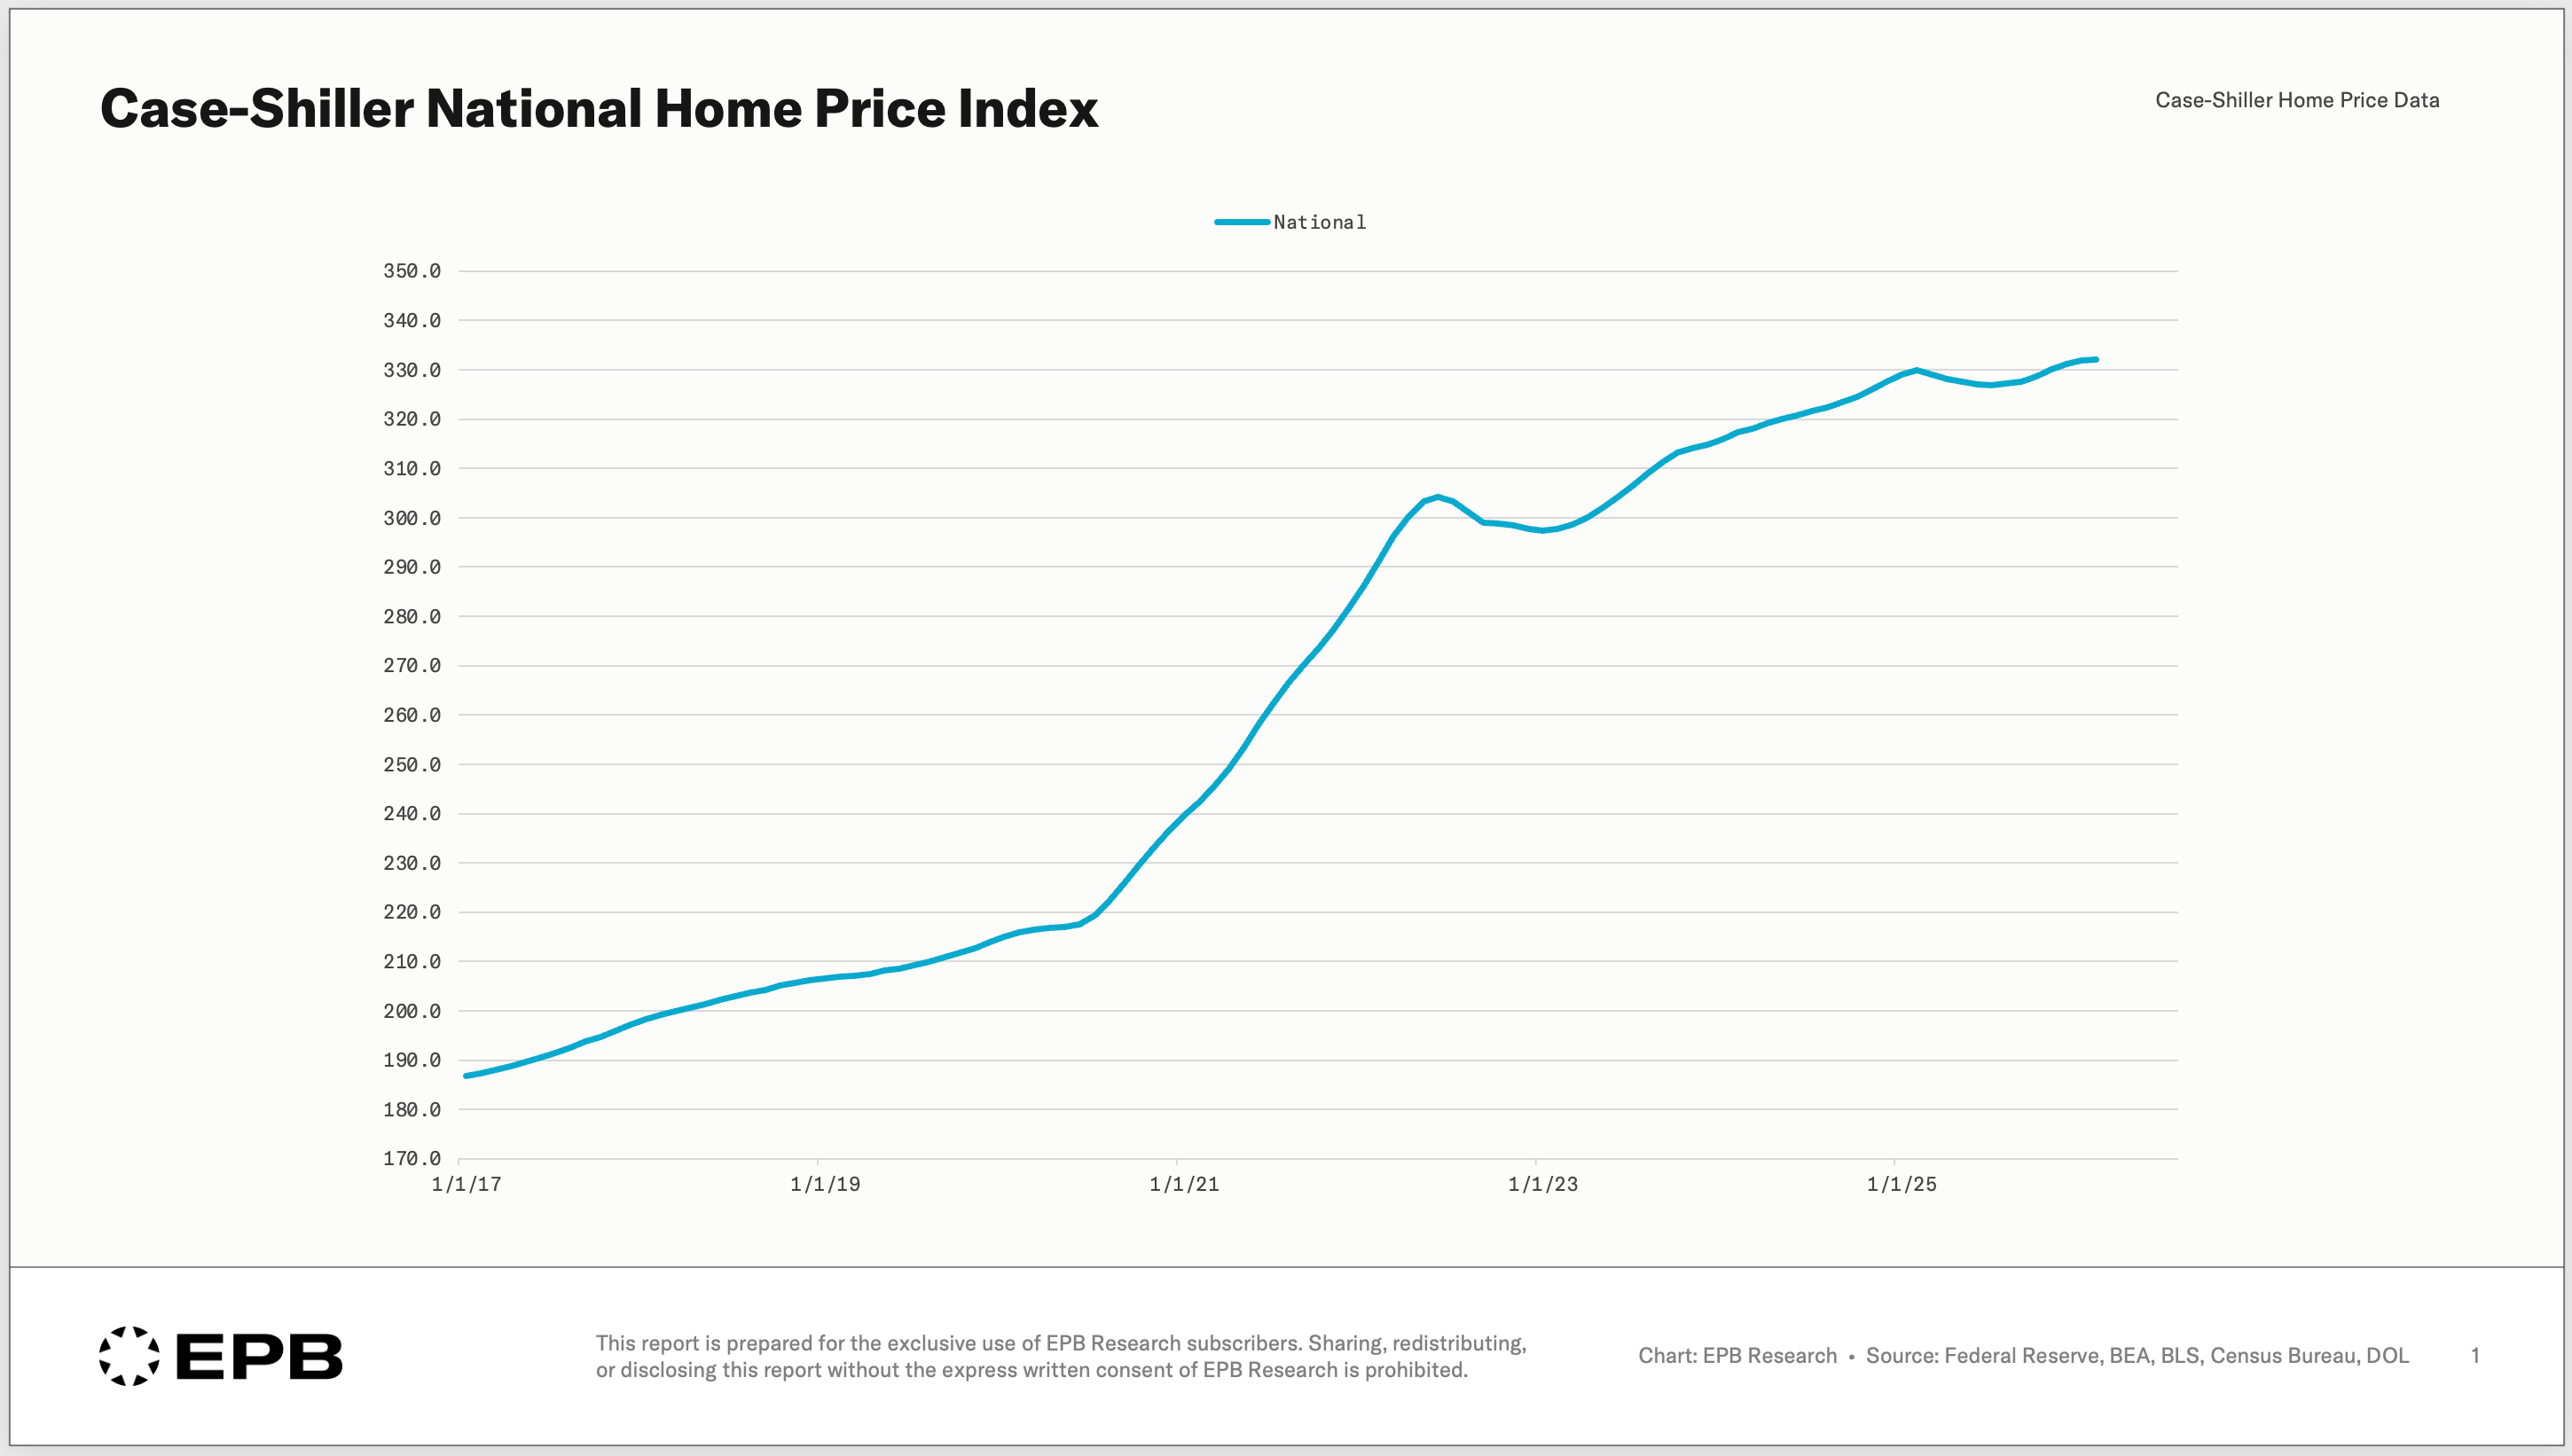
The national home price index averages everything into one number, showing 0.7% price gains in the last twelve months, but that figure doesn’t describe any specific market.
Eight major US cities are making fresh all-time highs in home prices. Seven have been stuck below their 2022 peaks for almost four years. And in the middle of that, half the country had a real housing correction with declines up to 13%.
A 5%-10% nominal decline in a period of high inflation is a meaningful reset of values, and that happened in roughly half of the major US metros.
In this article, you’ll see the major split in how housing markets performed since 2022, and the one variable that determined the path each city took.
Different Housing Markets, All Running at Once
If we rank the 20 major US cities by the number of months since each one hit an all-time high in home prices, three distinct groups emerge.
Chicago, New York, Cleveland, Detroit, Boston, Charlotte, Minneapolis, and San Diego are at all-time highs in home prices right now, or within one to two months of an all-time high.
Phoenix, Tampa, Dallas, Denver, Seattle, Portland, and San Francisco have been stuck below their 2022 home price peak for 25 to 46 months. Almost four years in some cases.
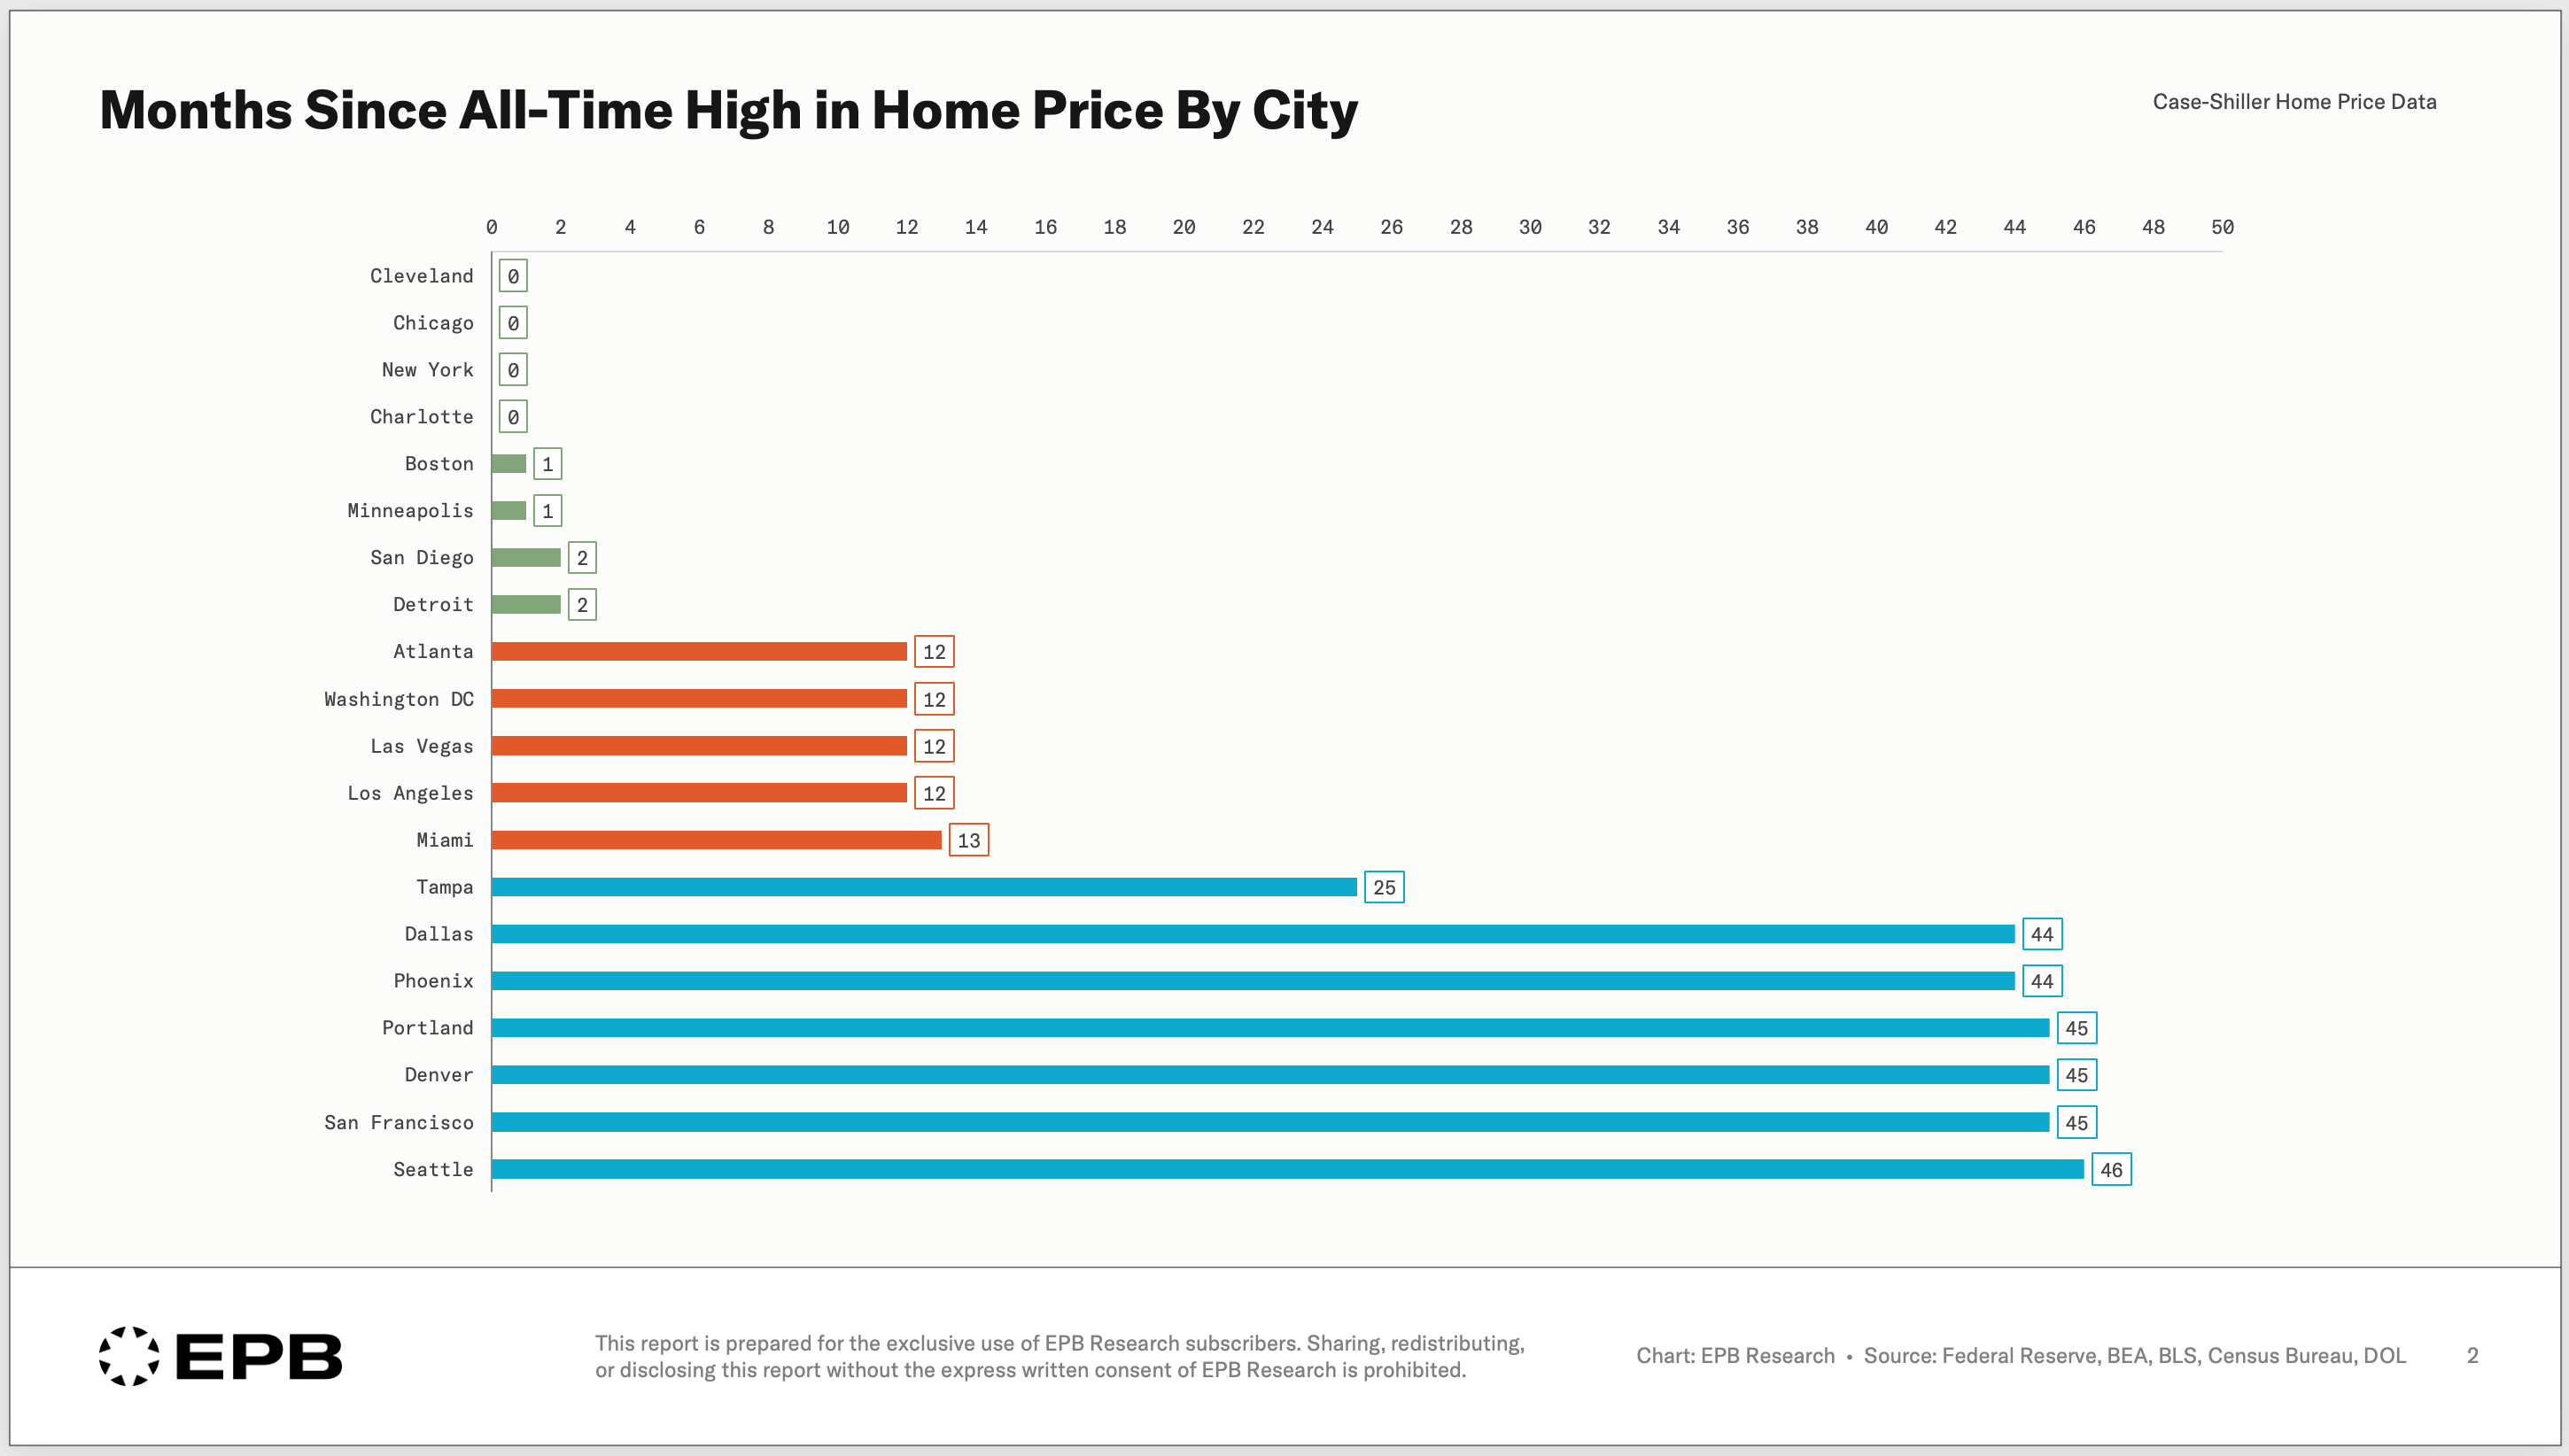
In the middle sit five cities. Atlanta, Miami, Washington DC, Las Vegas, and Los Angeles. These have been drifting sideways for about a year.
That’s three completely different housing markets running at the same time, blended at the national level into one story that doesn’t fit any single market.
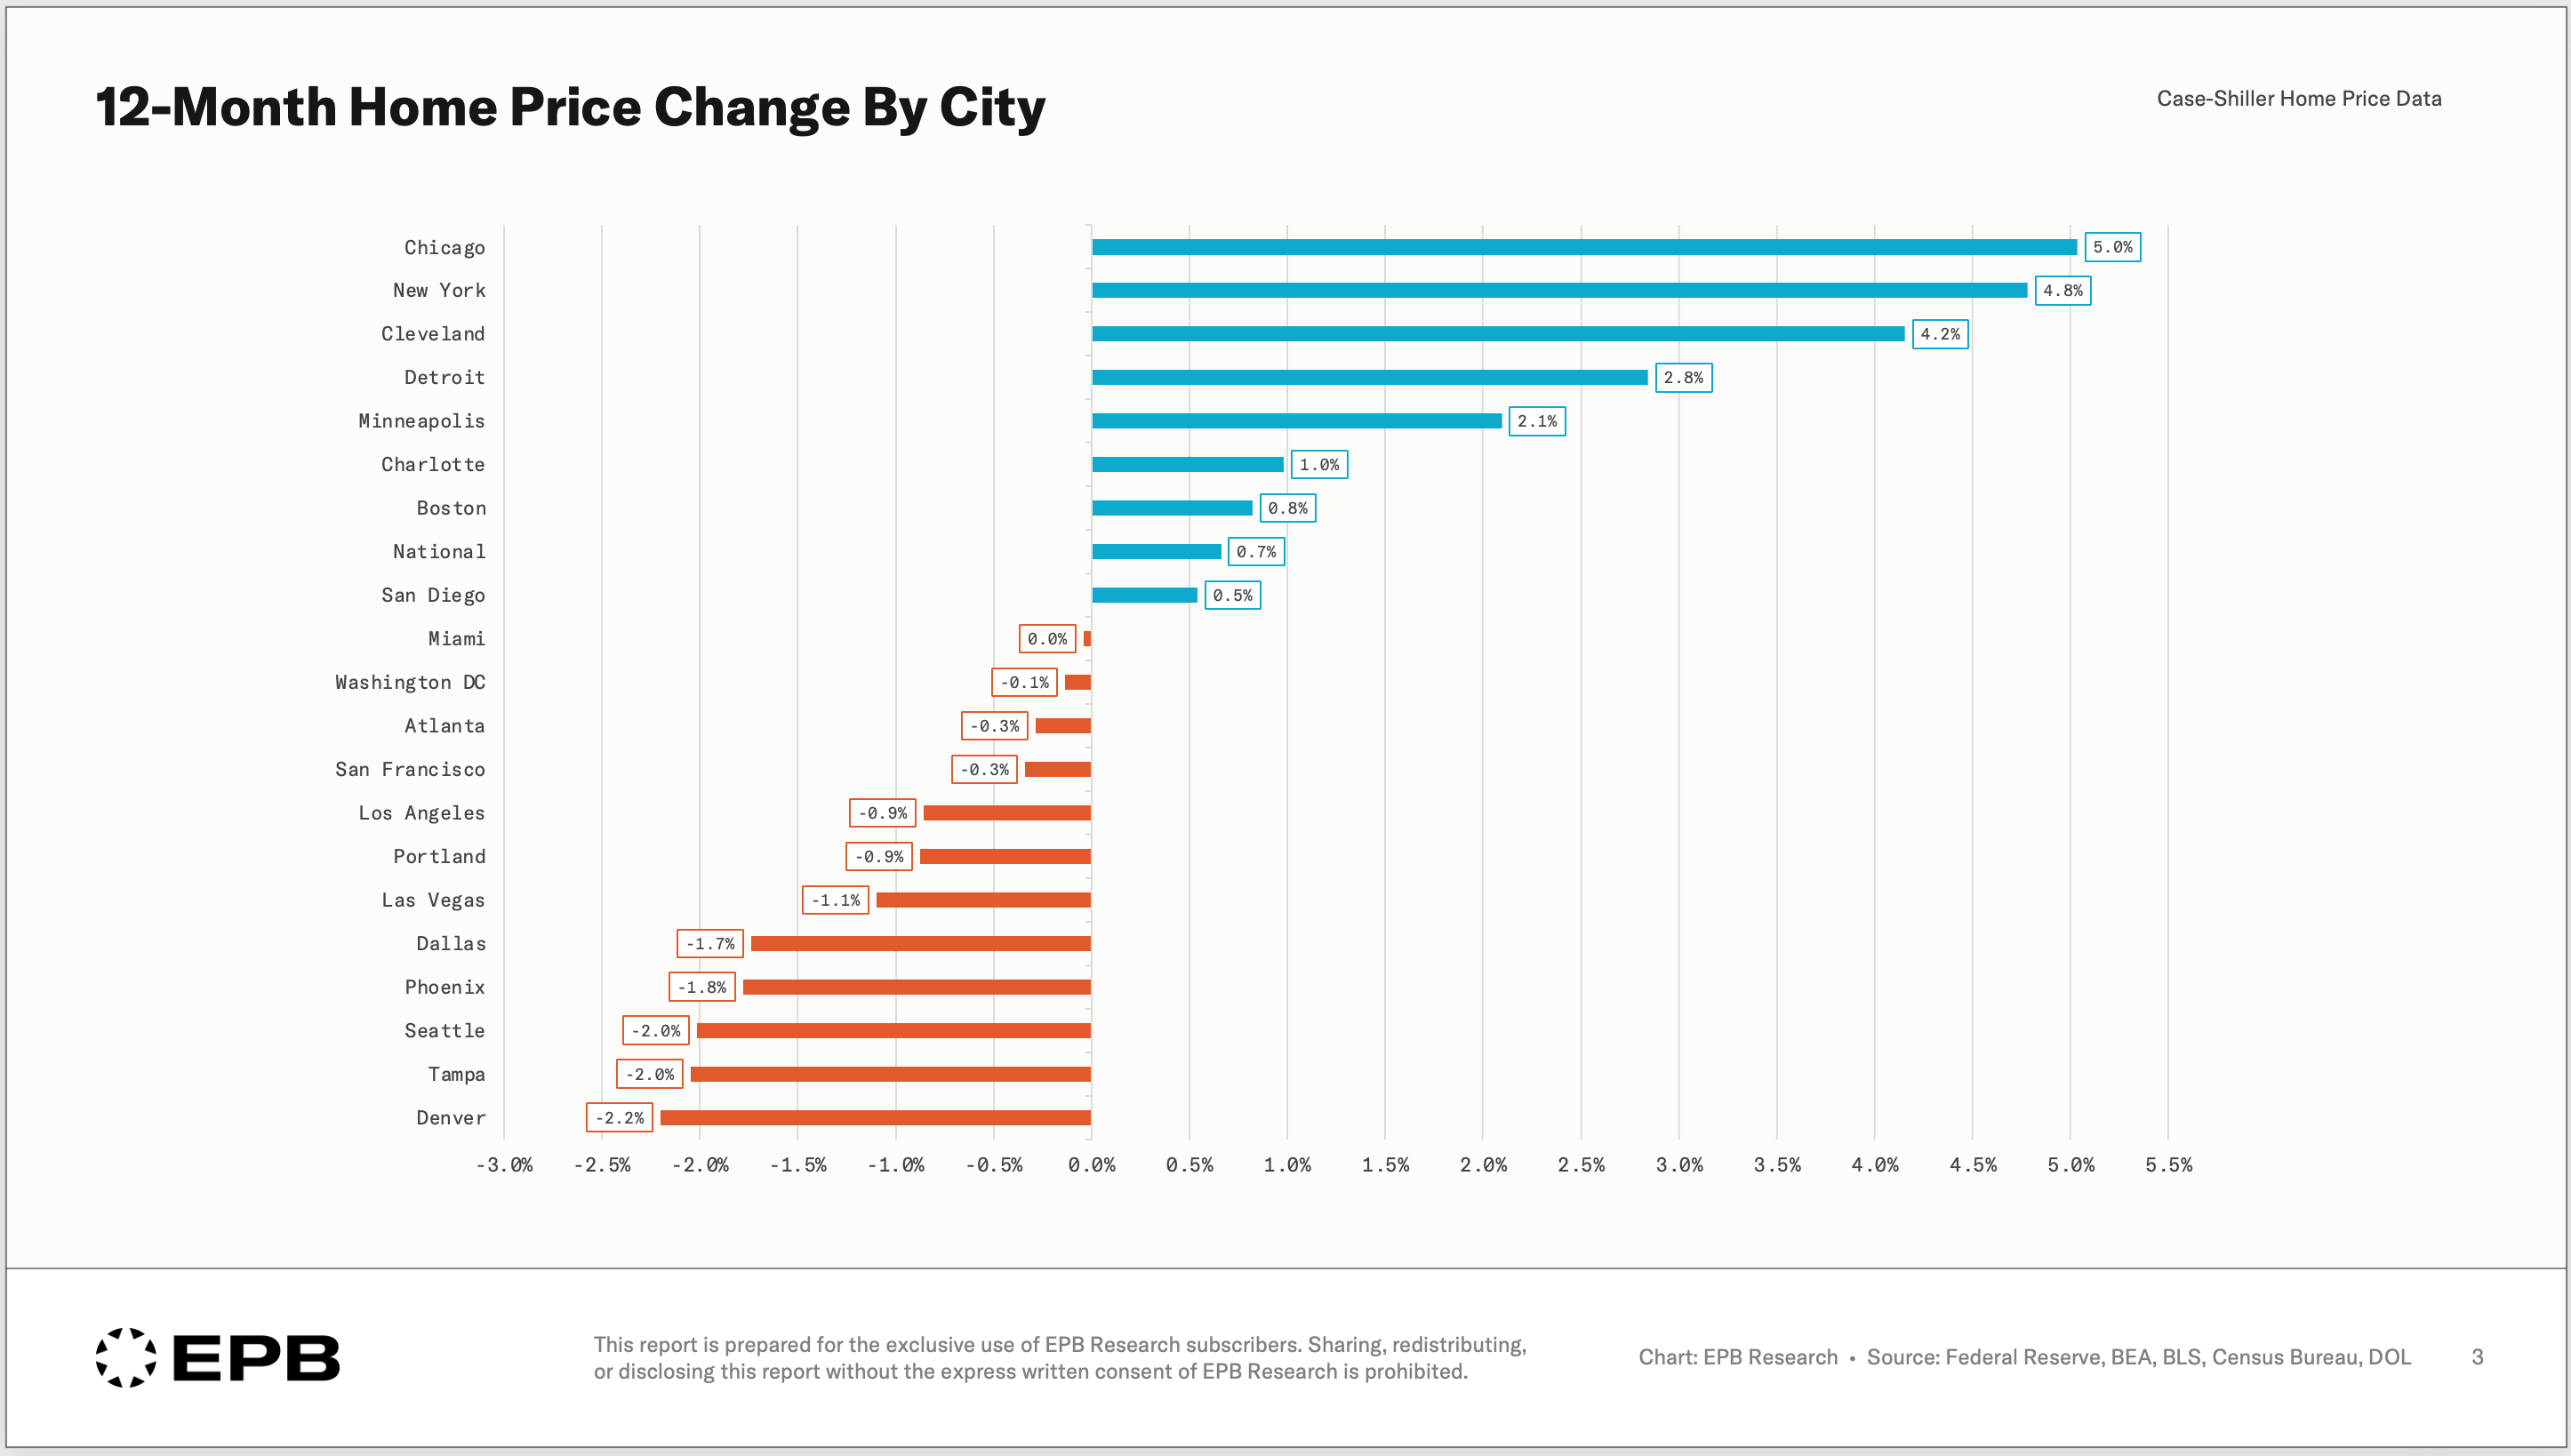
And the regimes are still moving apart.
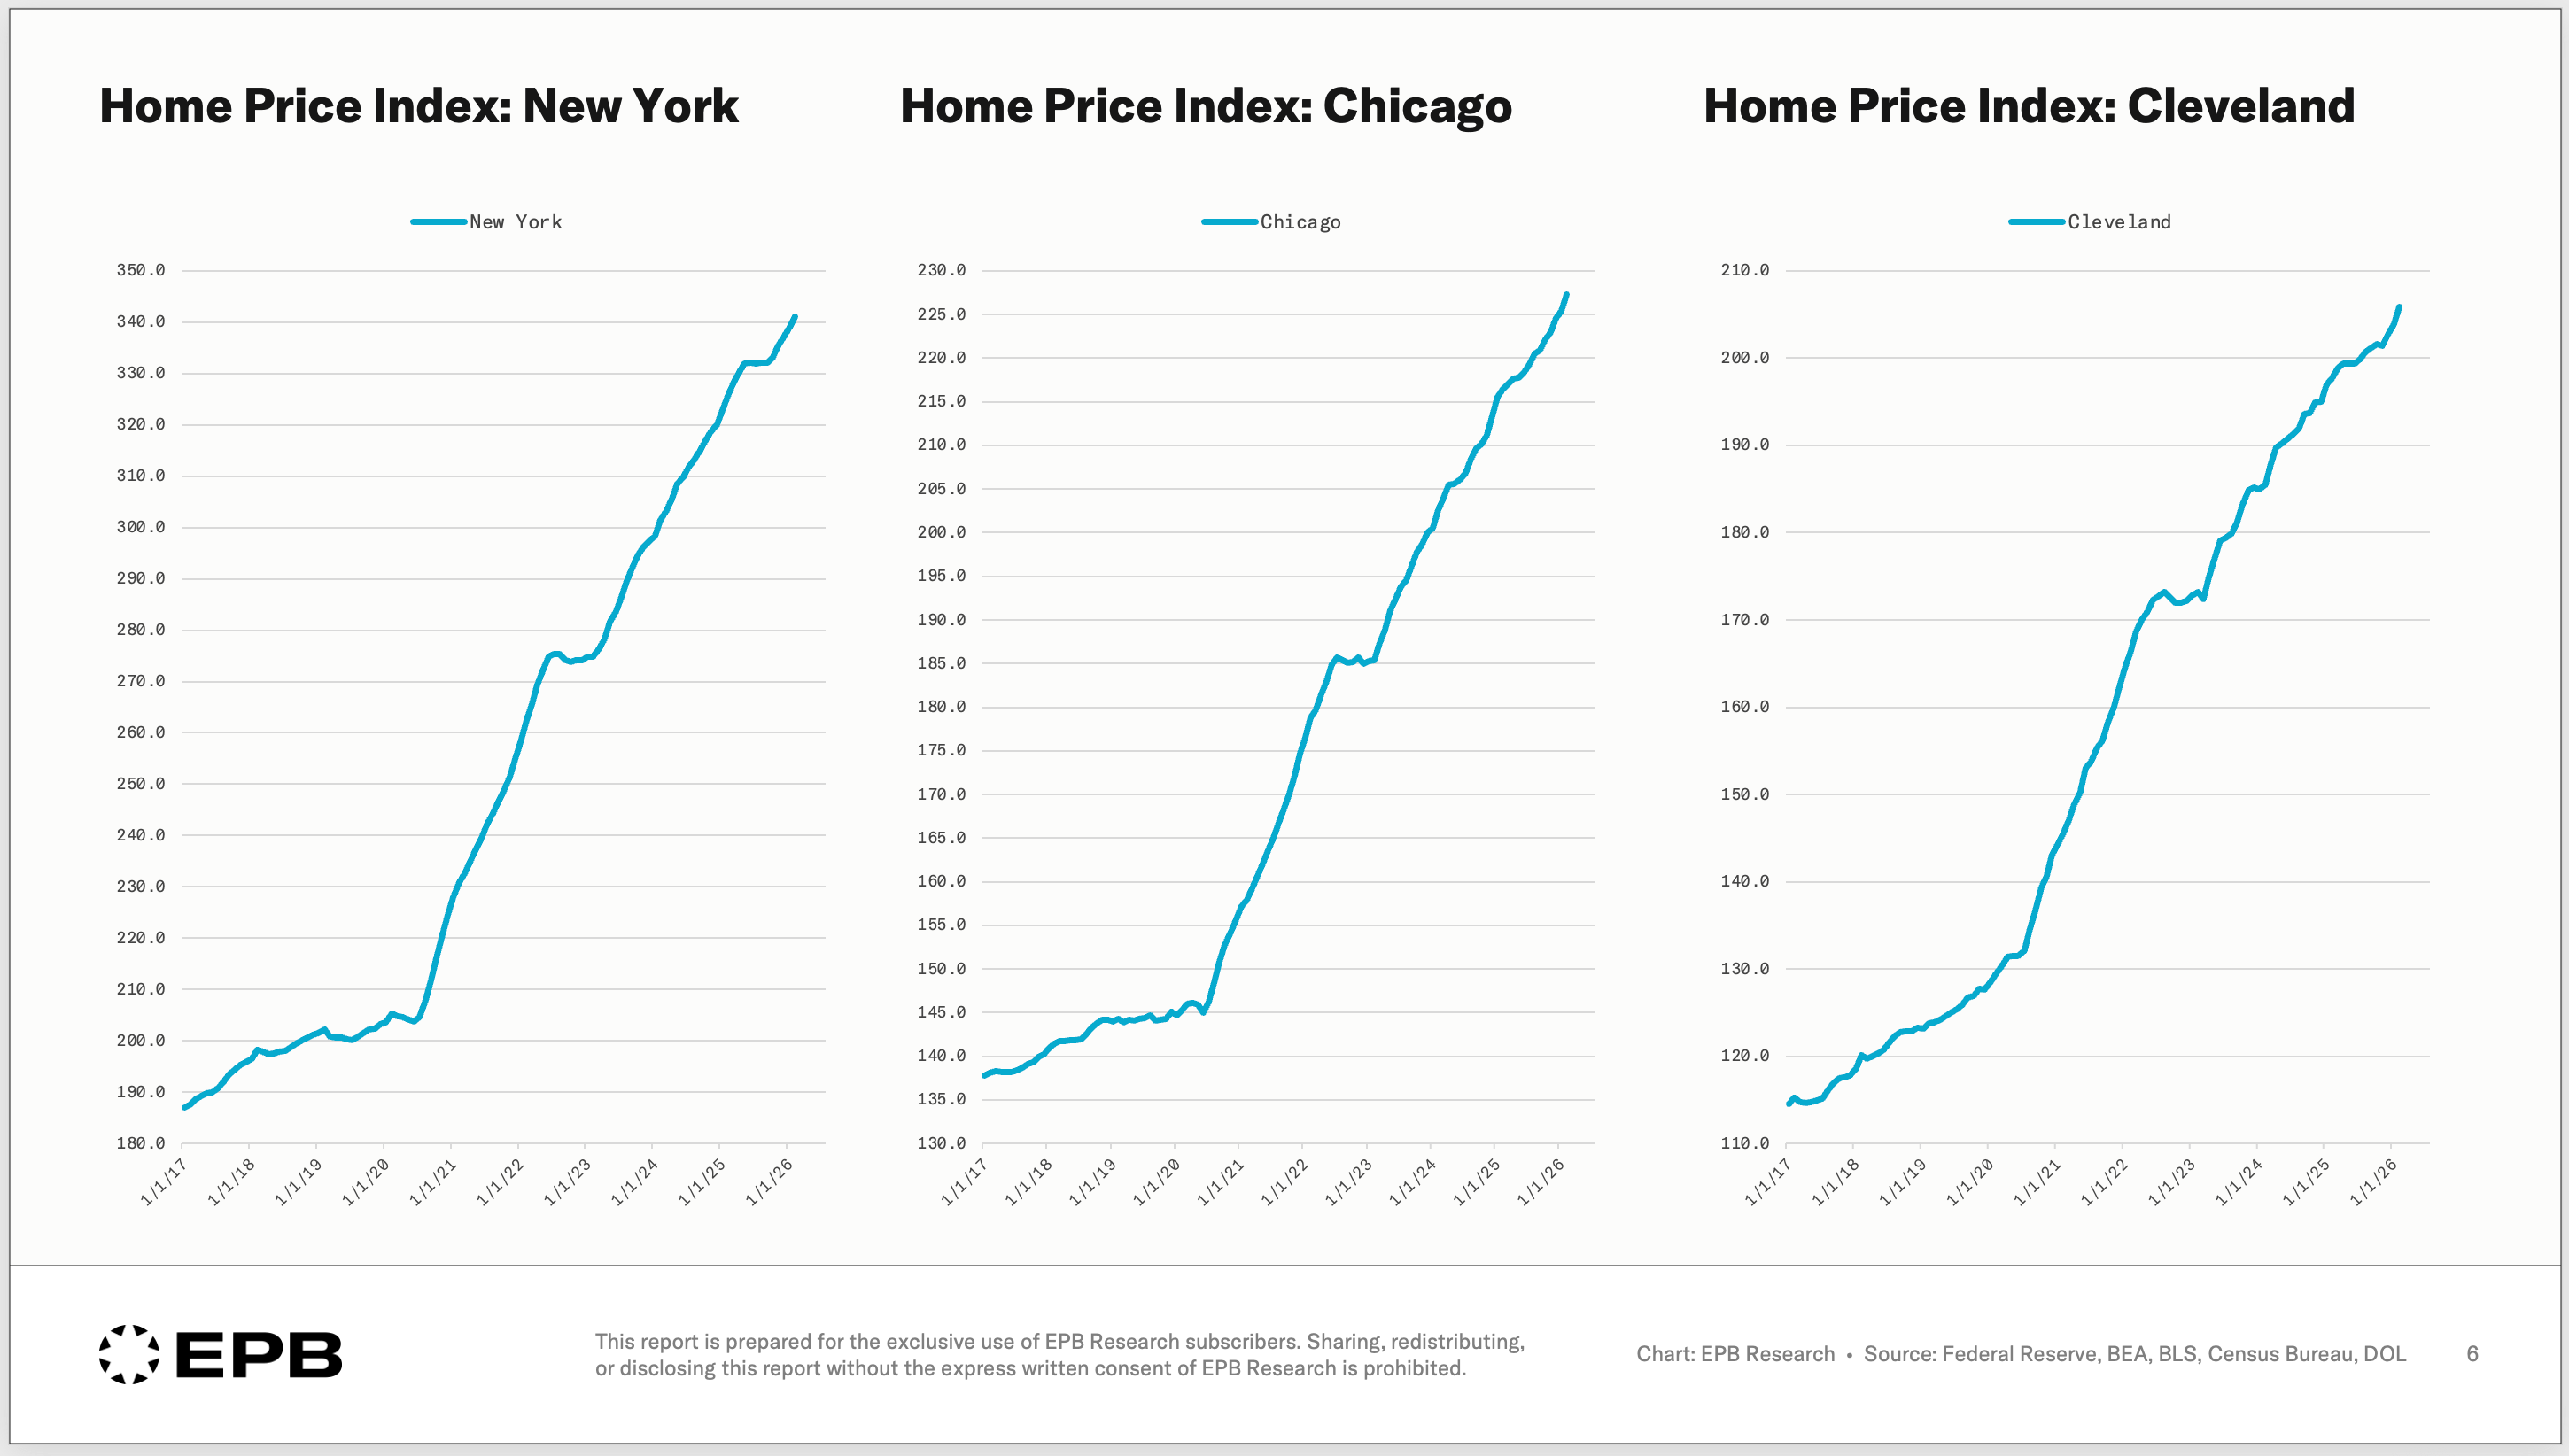
Chicago, New York, and Cleveland are all up more than 4% in the last twelve months.
Cities below their 2022 peaks are still declining 1% to 2%. Tampa, Seattle, and Denver are all down on the year.
When you hear someone say “the housing market” is up 0.7% in the past year, that number is averaging Chicago at +5%, with Denver at -2%.
National housing data is important, and we use it often in our research at EPB.
But home price changes are notoriously regional. Half the country had a legitimate housing correction after the summer of 2022, while the other half experienced a straight-line increase since 2020.
The Recession That Never Made the Headlines
The peak-to-trough drawdown numbers from the 2022 peak make the regional split even clearer.
The 2022 peak marked the end of the stimulus-fueled pandemic boom, and what happened after looked very different depending on where you lived.
San Francisco fell 12.7%, Seattle fell 12.2%, Las Vegas fell 8.7%, and Phoenix fell 8.4%.
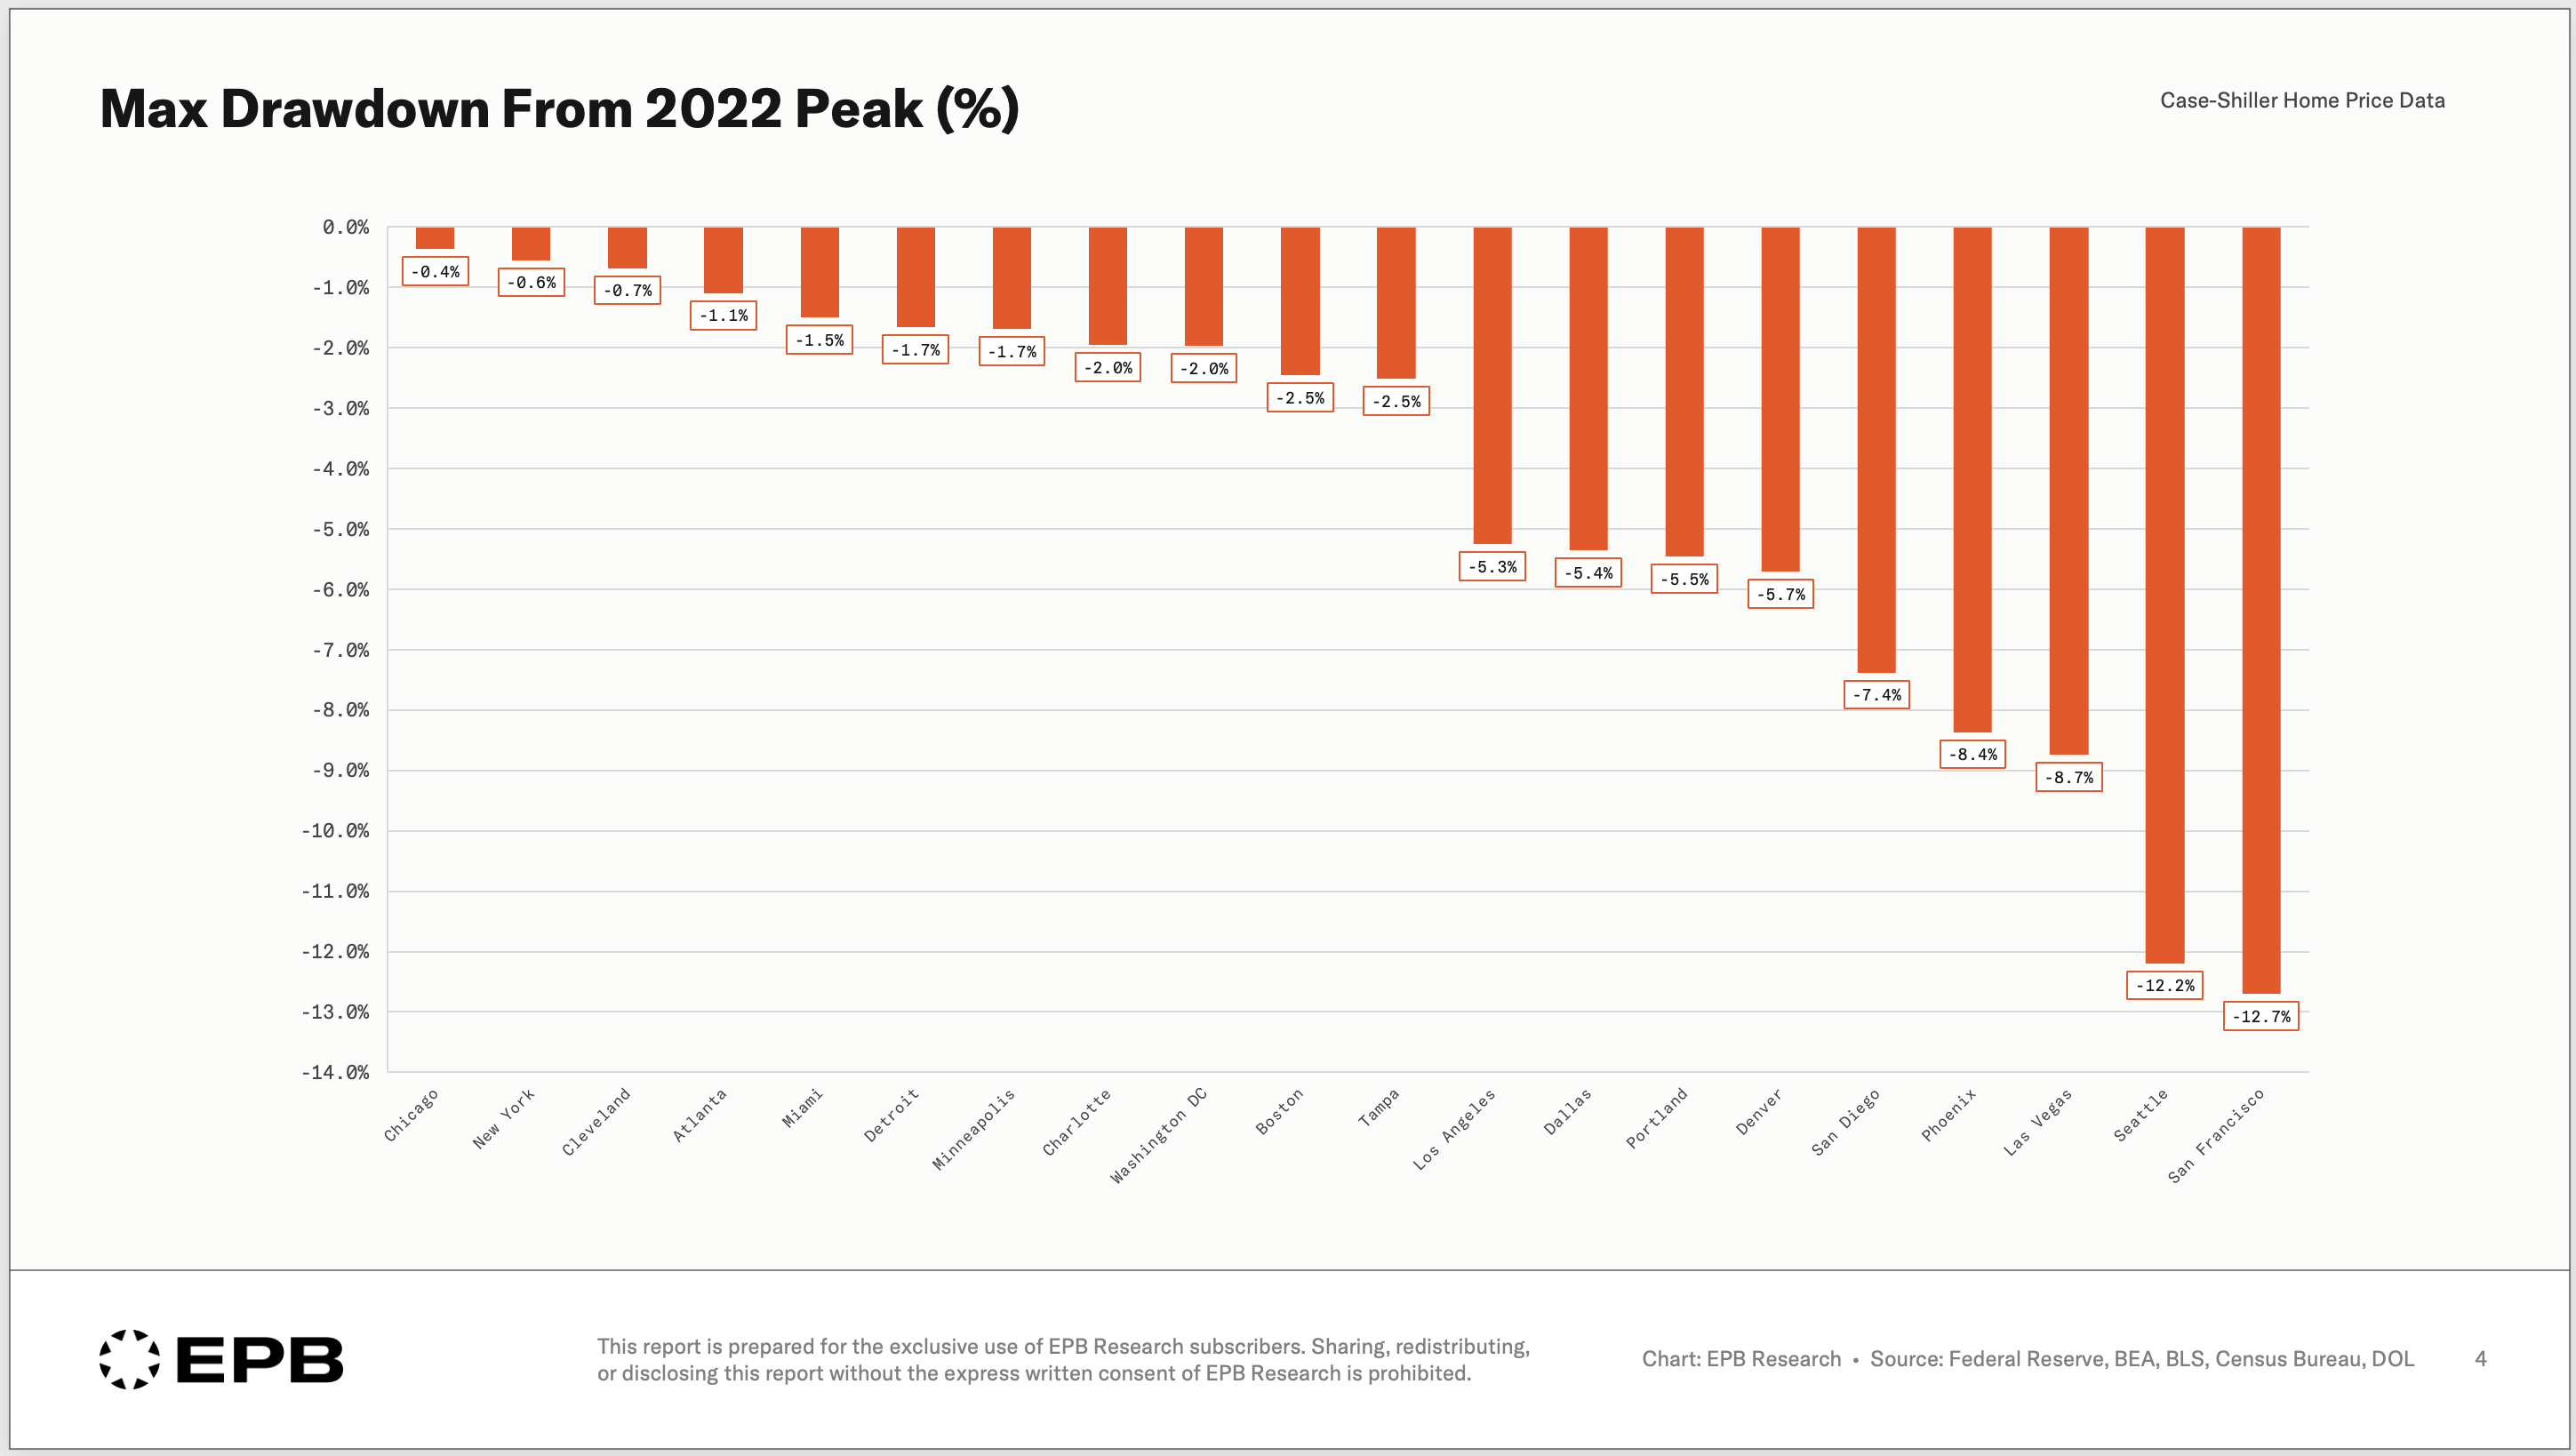
These are not small numbers. A 12% drawdown in a major US housing market is a real housing recession, particularly in an environment of high inflation. A 10% nominal price correction during a period of high inflation is a significant reset of values.
The national price index had a minor correction but more or less continued to rise through the 2022 regional reset, which is why this housing downturn never turned into a national story.
In 2022 and 2023, half the cities fell and the other half kept climbing.
New York barely moved, Chicago barely moved, and Cleveland barely moved. Those cities averaged into the national index alongside the cities that were dropping double digits, and the average came out virtually flat.
So, Why Did Half the Country Fall
The answer lies in construction.
In some areas of the country, a booming housing market ushers in extreme building. Building permits in Austin and Phoenix increased by over 100% from 2017.
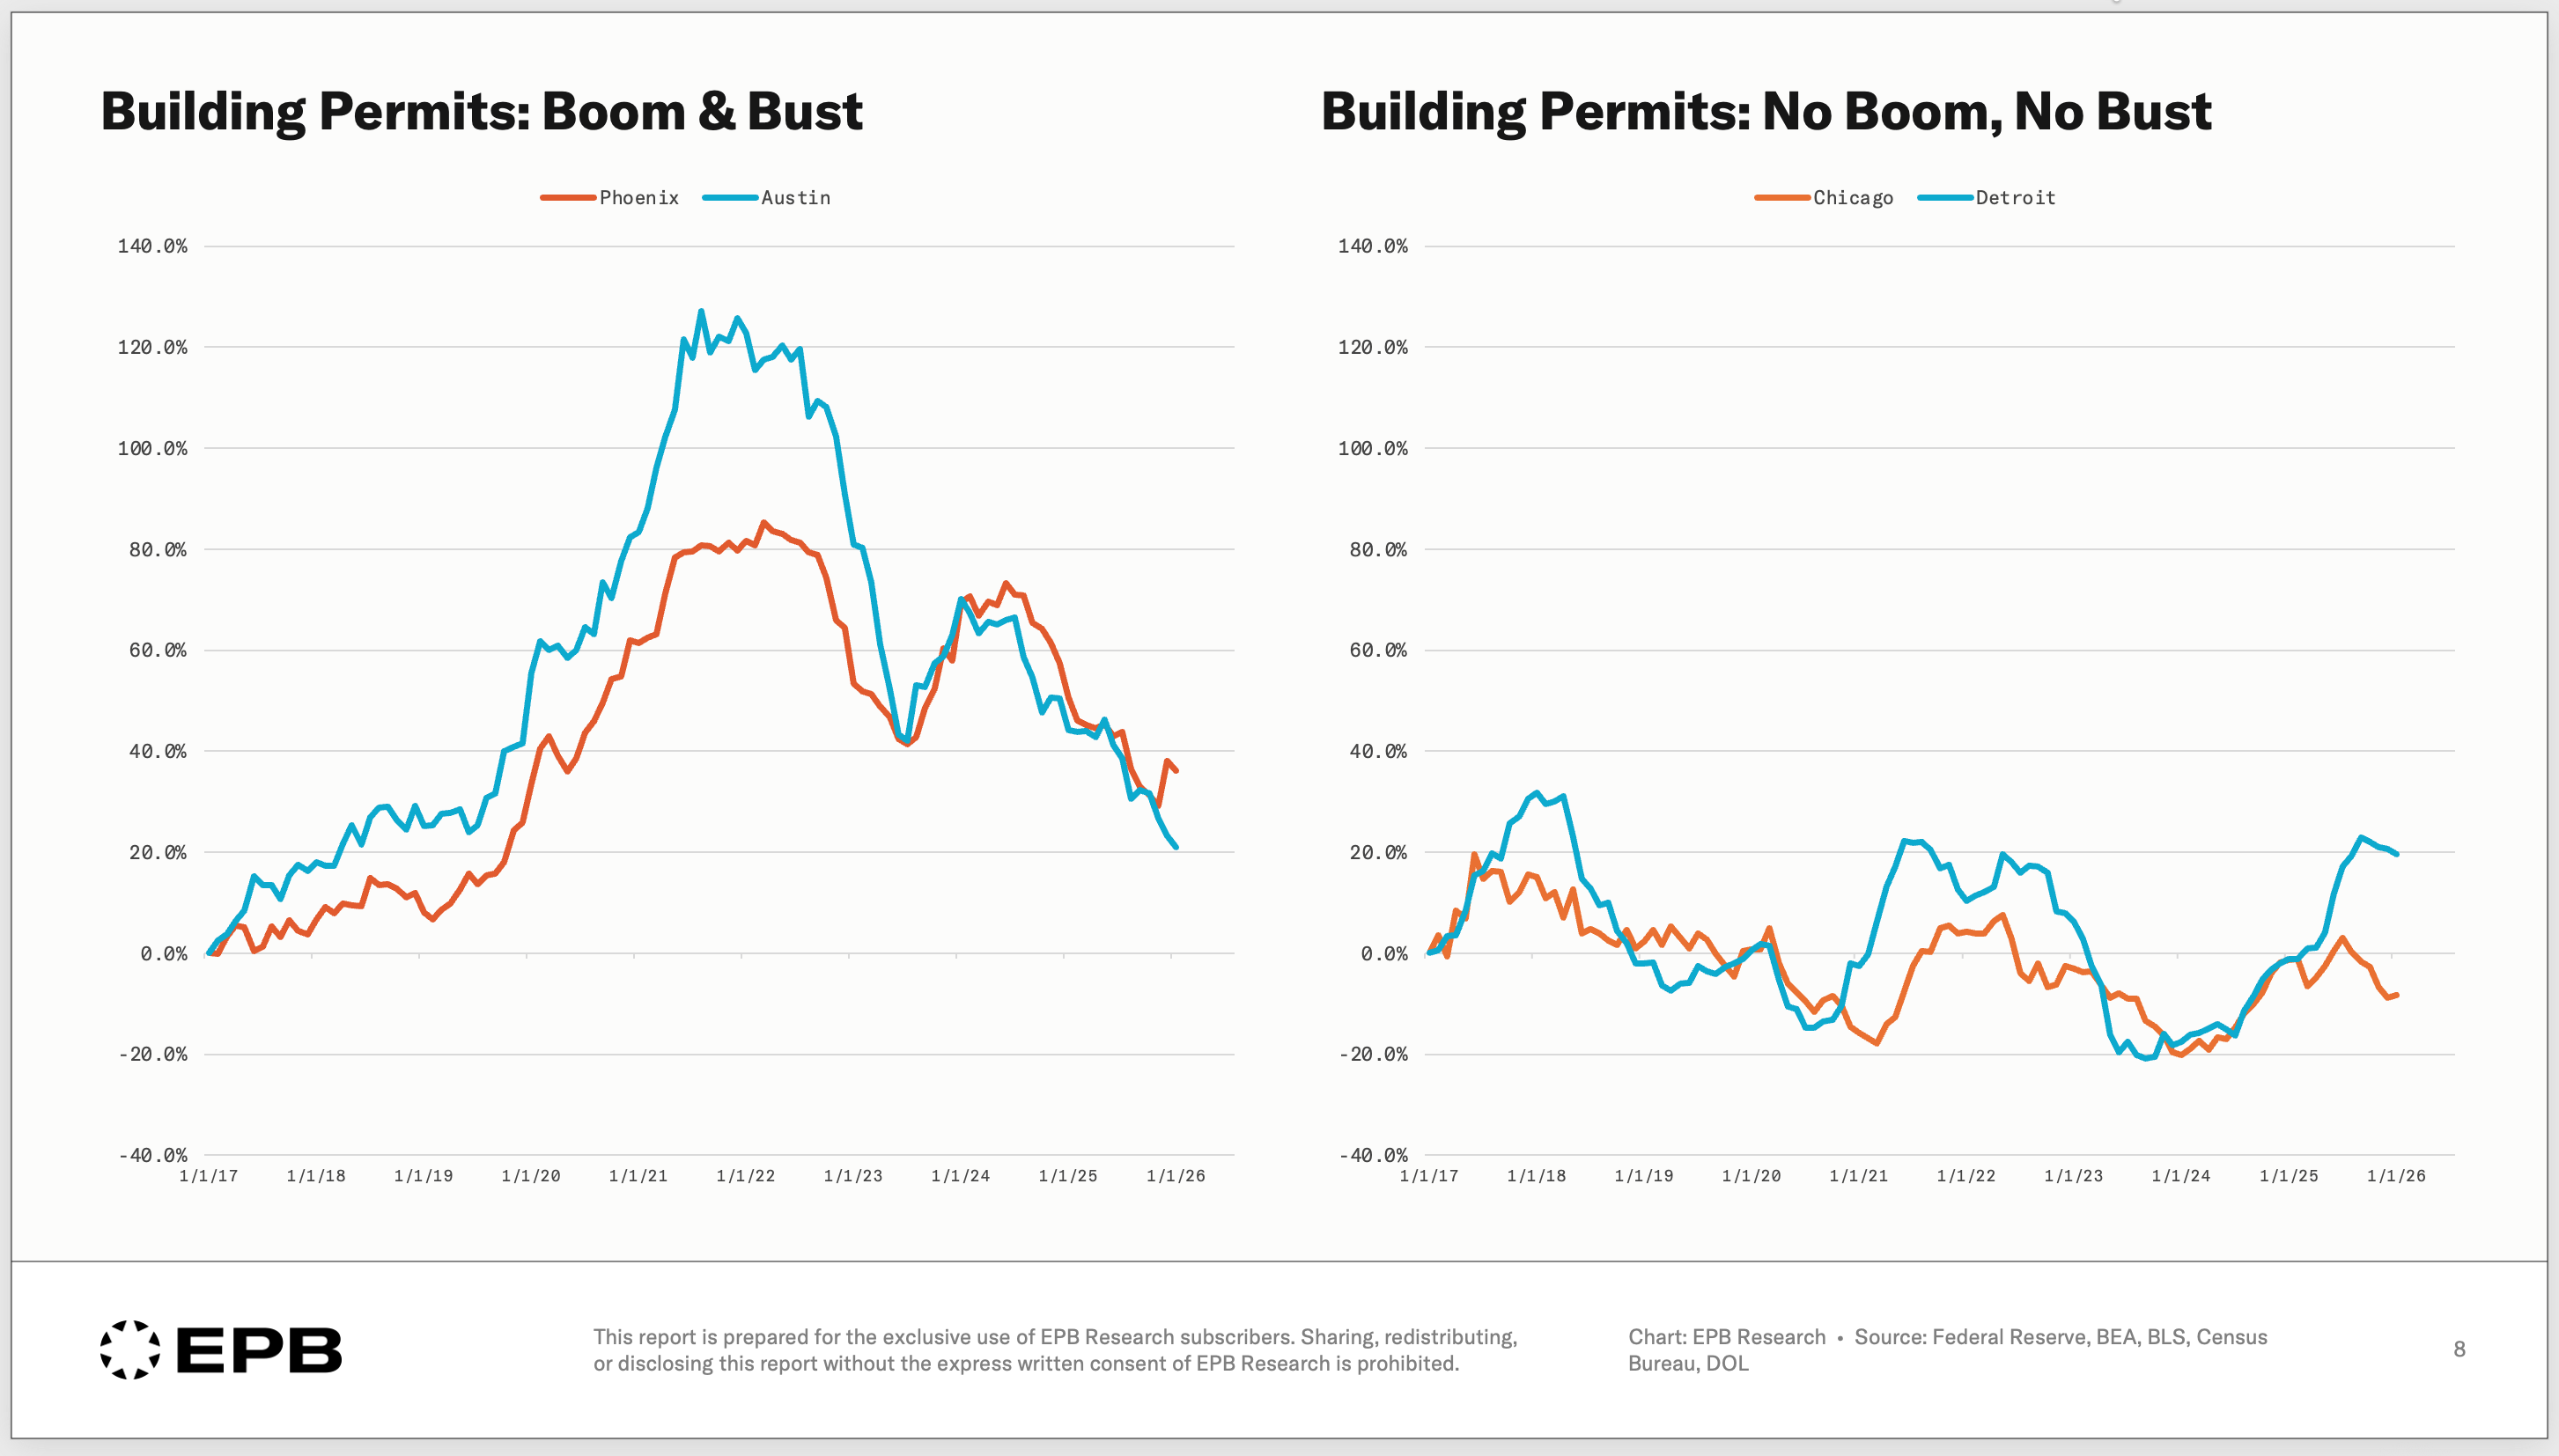
Building permits in Detroit and Chicago never increased by more than 20%. There was a 5x difference in the amount of building activity between boom cities and cities that make new construction very difficult.
So how did that contribute to differences in home price trends?
Detroit home prices increased 54% from 2017 to 2022, then another 17% from 2022 to today.
Chicago tells a similar story. A 34% increase from 2017 to 2022, and another 23% from 2022 to today.
The boom towns had much different performance. Phoenix, for example, increased 105% from 2017 to 2022, then fell 3.3% from 2022 to today.
Cities that had a lot of construction saw huge booms and then bigger price corrections. Cities with limited construction saw smaller initial gains, but the gains continued after 2022, with double digits in many cases.
The chart below plots the relationship across every major city, and the pattern is clear.
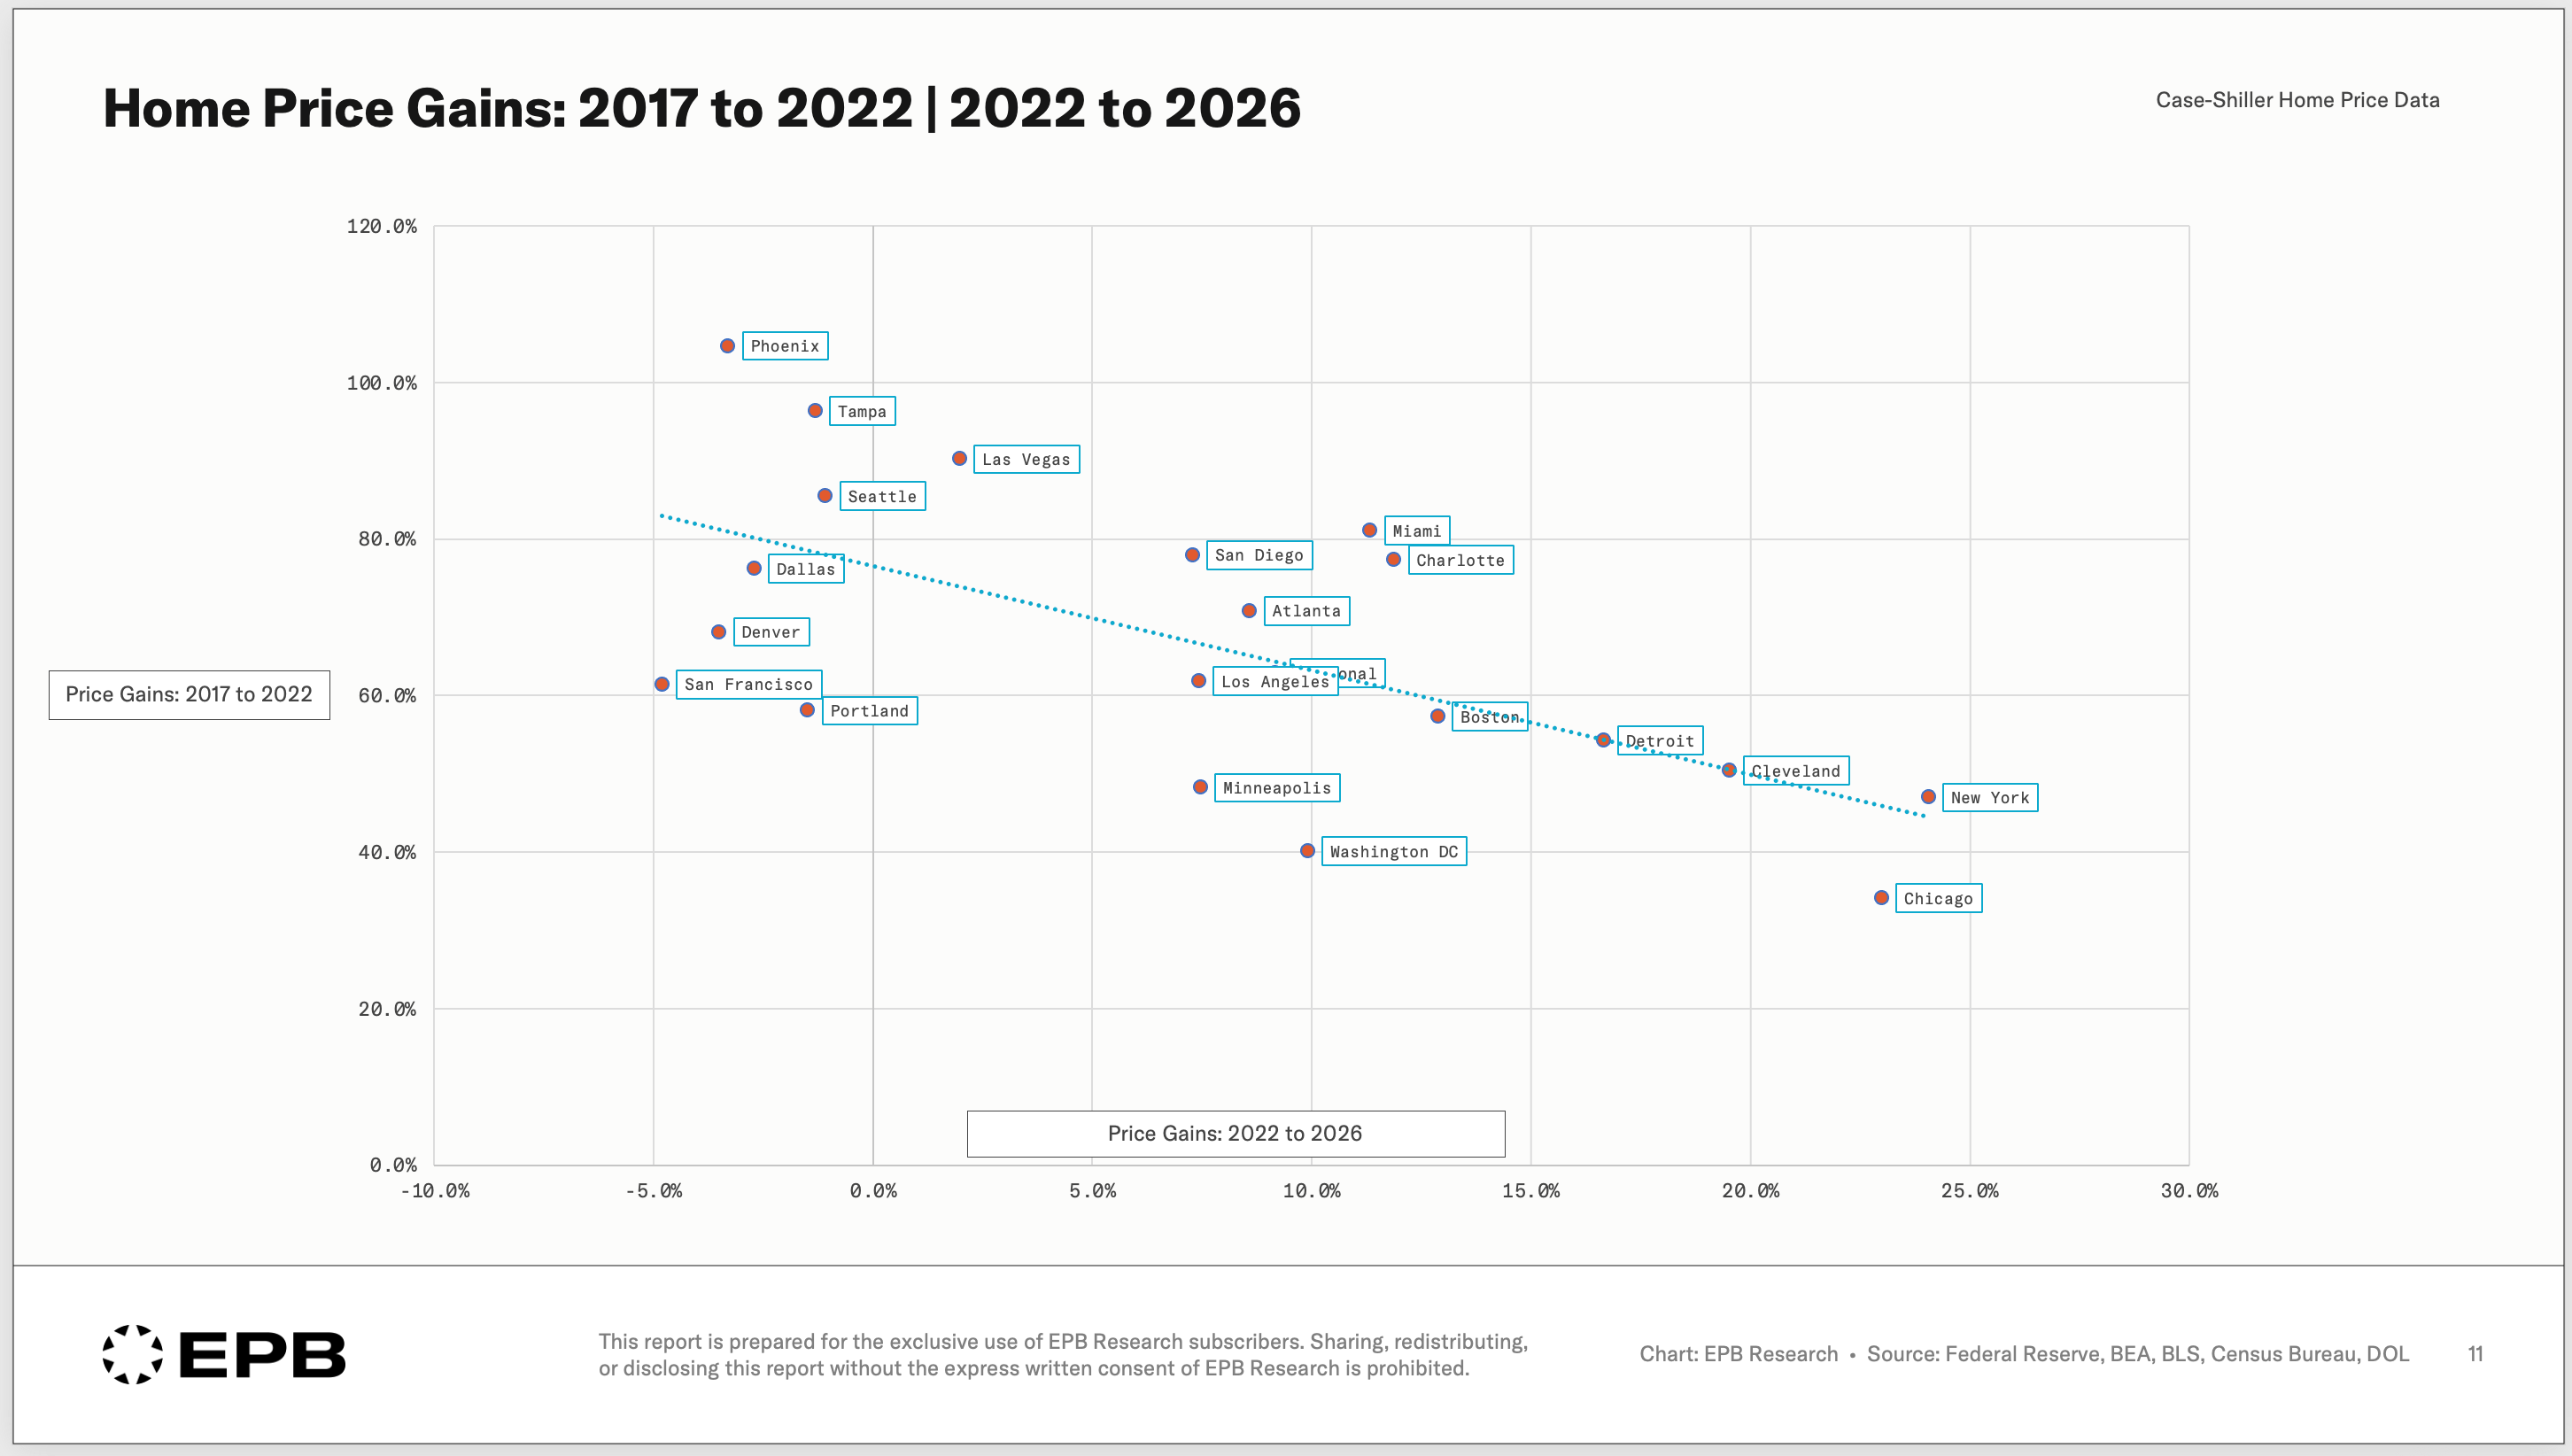
The price gain from 2017 to 2022 is on the vertical axis. On the horizontal axis, is the price gain from 2022 to today. There’s a clear relationship. The bigger the boom from 2017 to 2022, the smaller the gain from 2022 to today.
Phoenix sits in the top-left corner. Over 100% price gain from 2017 to 2022, then a decline over the last four years. If you bought in 2017, you’re still up huge. If you bought in 2022, you’re down over the last four years, and that’s before fees and costs. This is a housing recession in the most concrete sense. Someone could have bought a home and five years later be underwater before fees and transaction costs, and with interest rates so much higher than in 2022, they can’t refinance their way out of the problem either.
The other side of the spectrum is highlighted by New York, which sits in the bottom-right corner. More limited gains in the five years from 2017 to 2022, about 47%, but then another 25% gain from 2022 to today.
Two Paths to the Same Destination
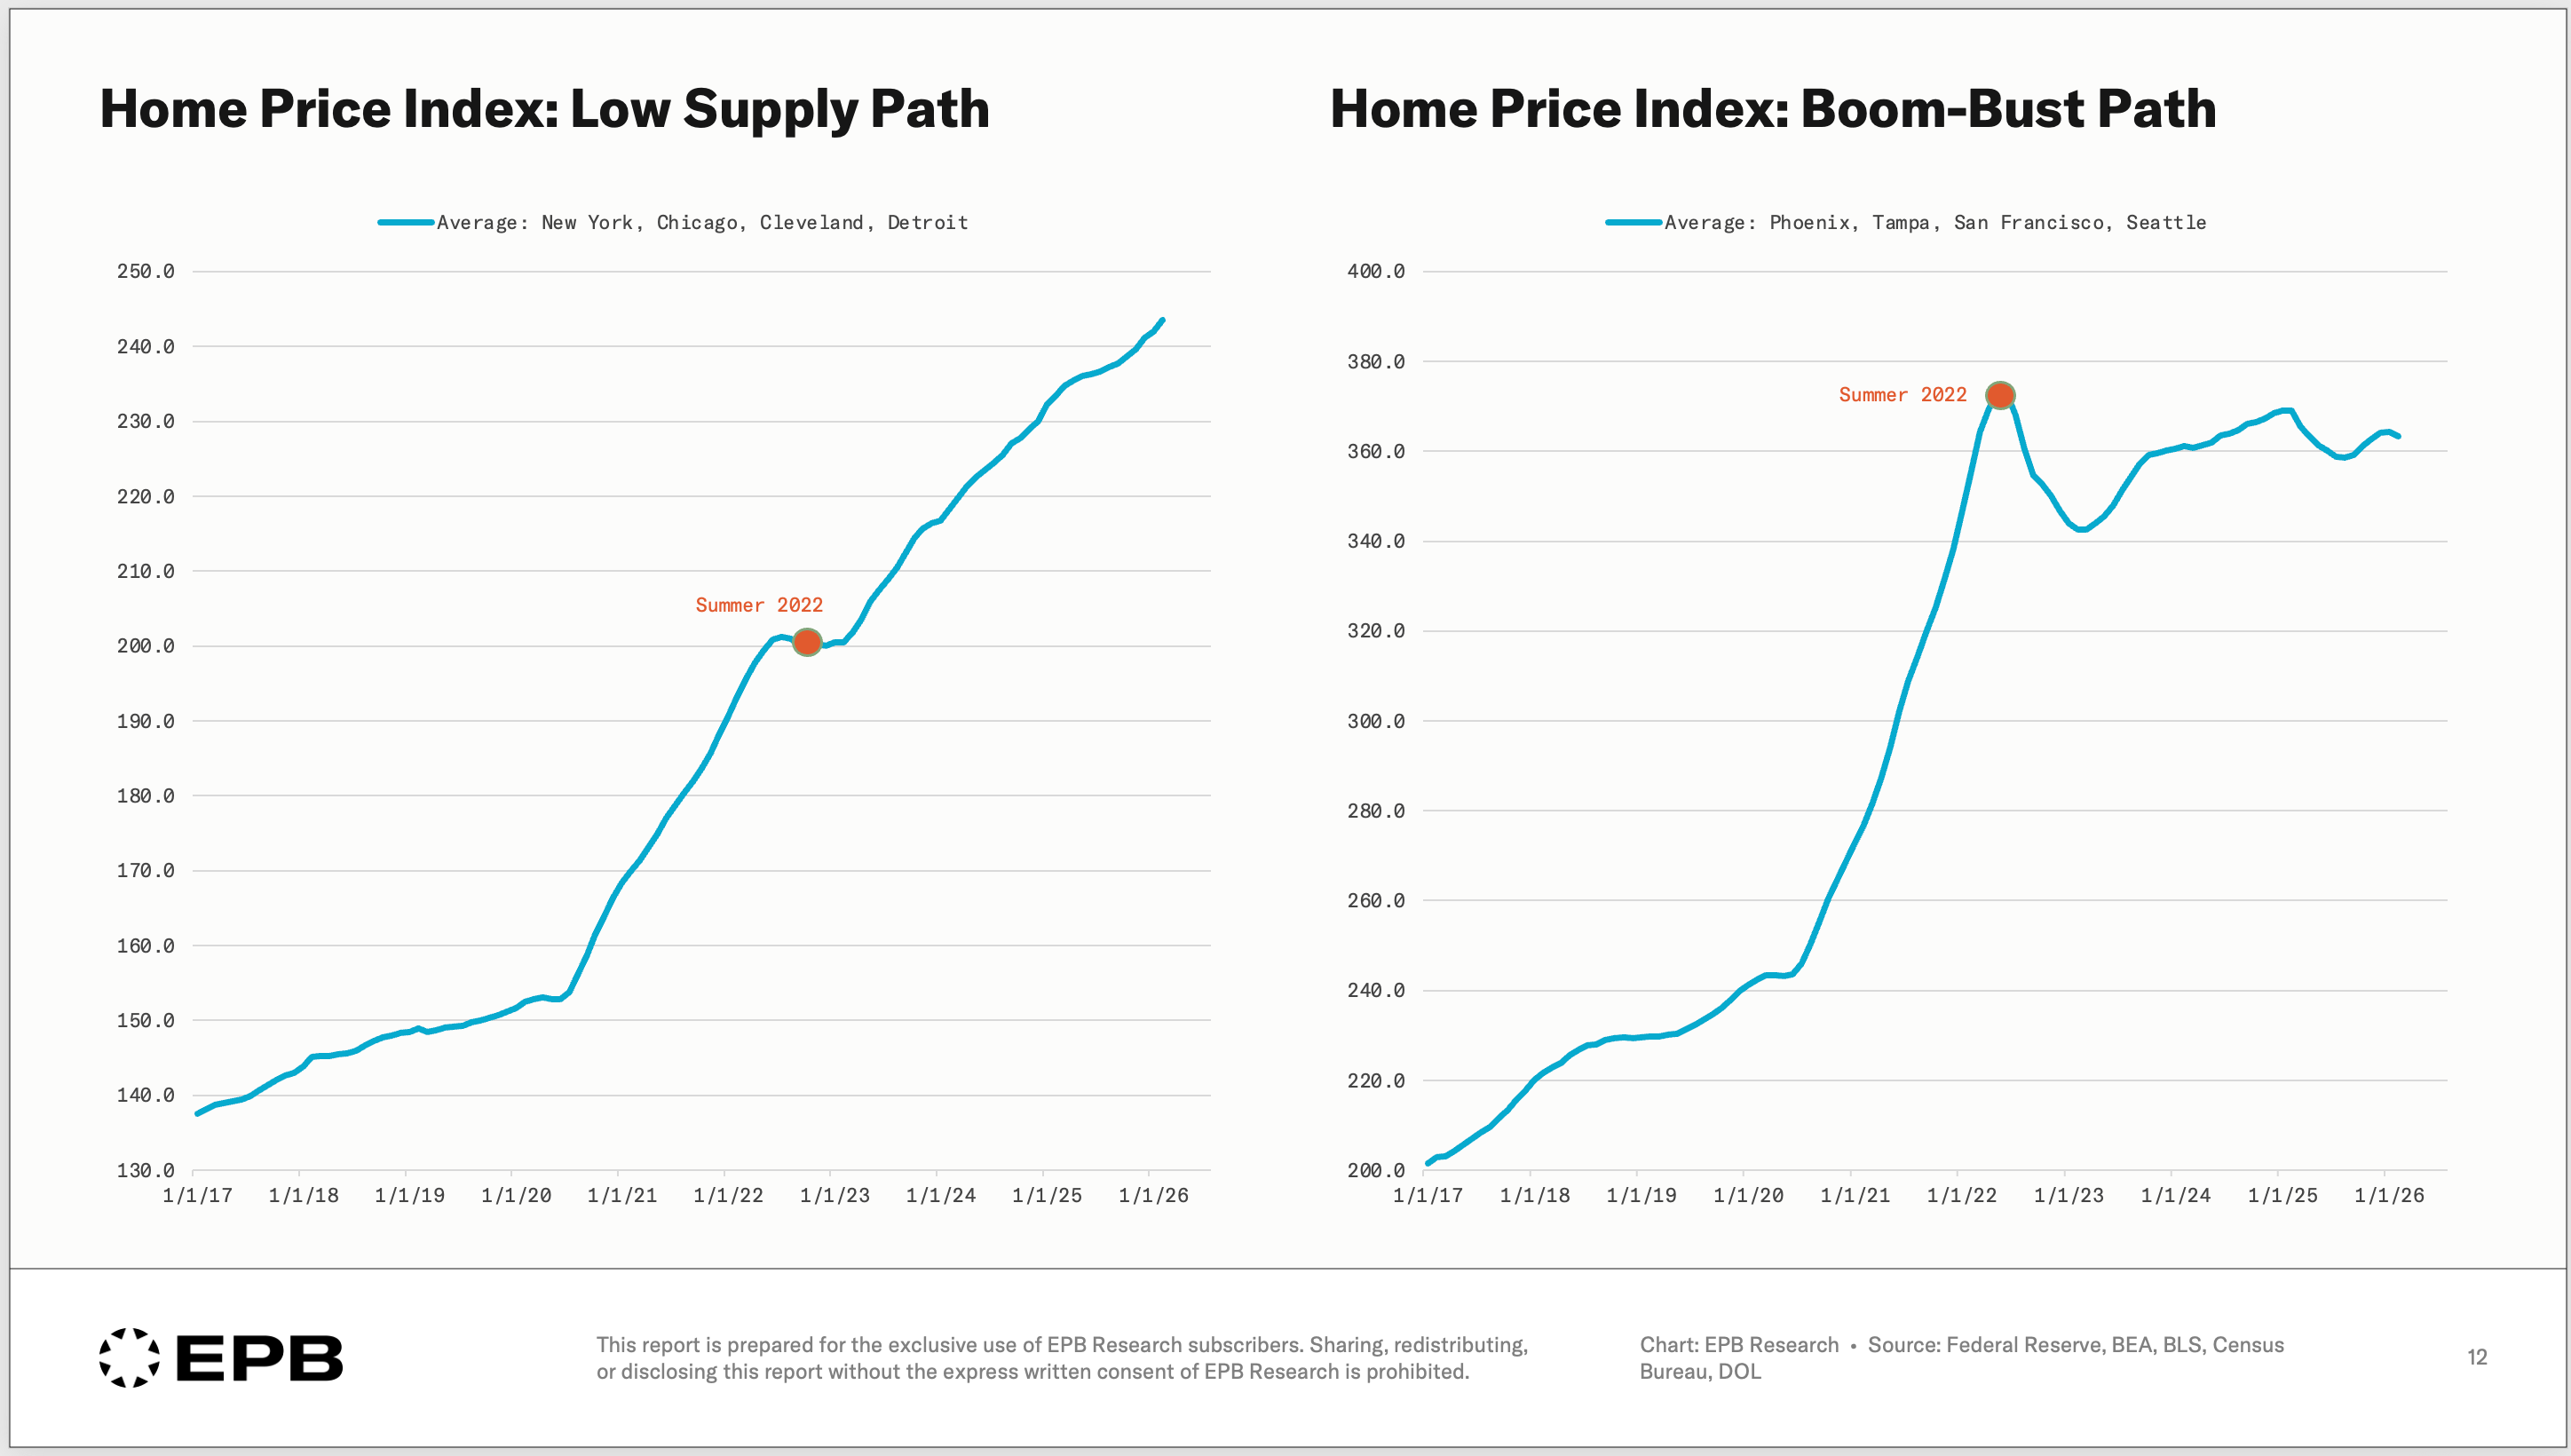
Averaging boom-bust and low-supply markets makes the two distinct housing paths unmistakable.
The first composite is the average of New York, Chicago, Cleveland, and Detroit, four low-supply markets. There’s been a smooth rise with barely a pause in 2022.
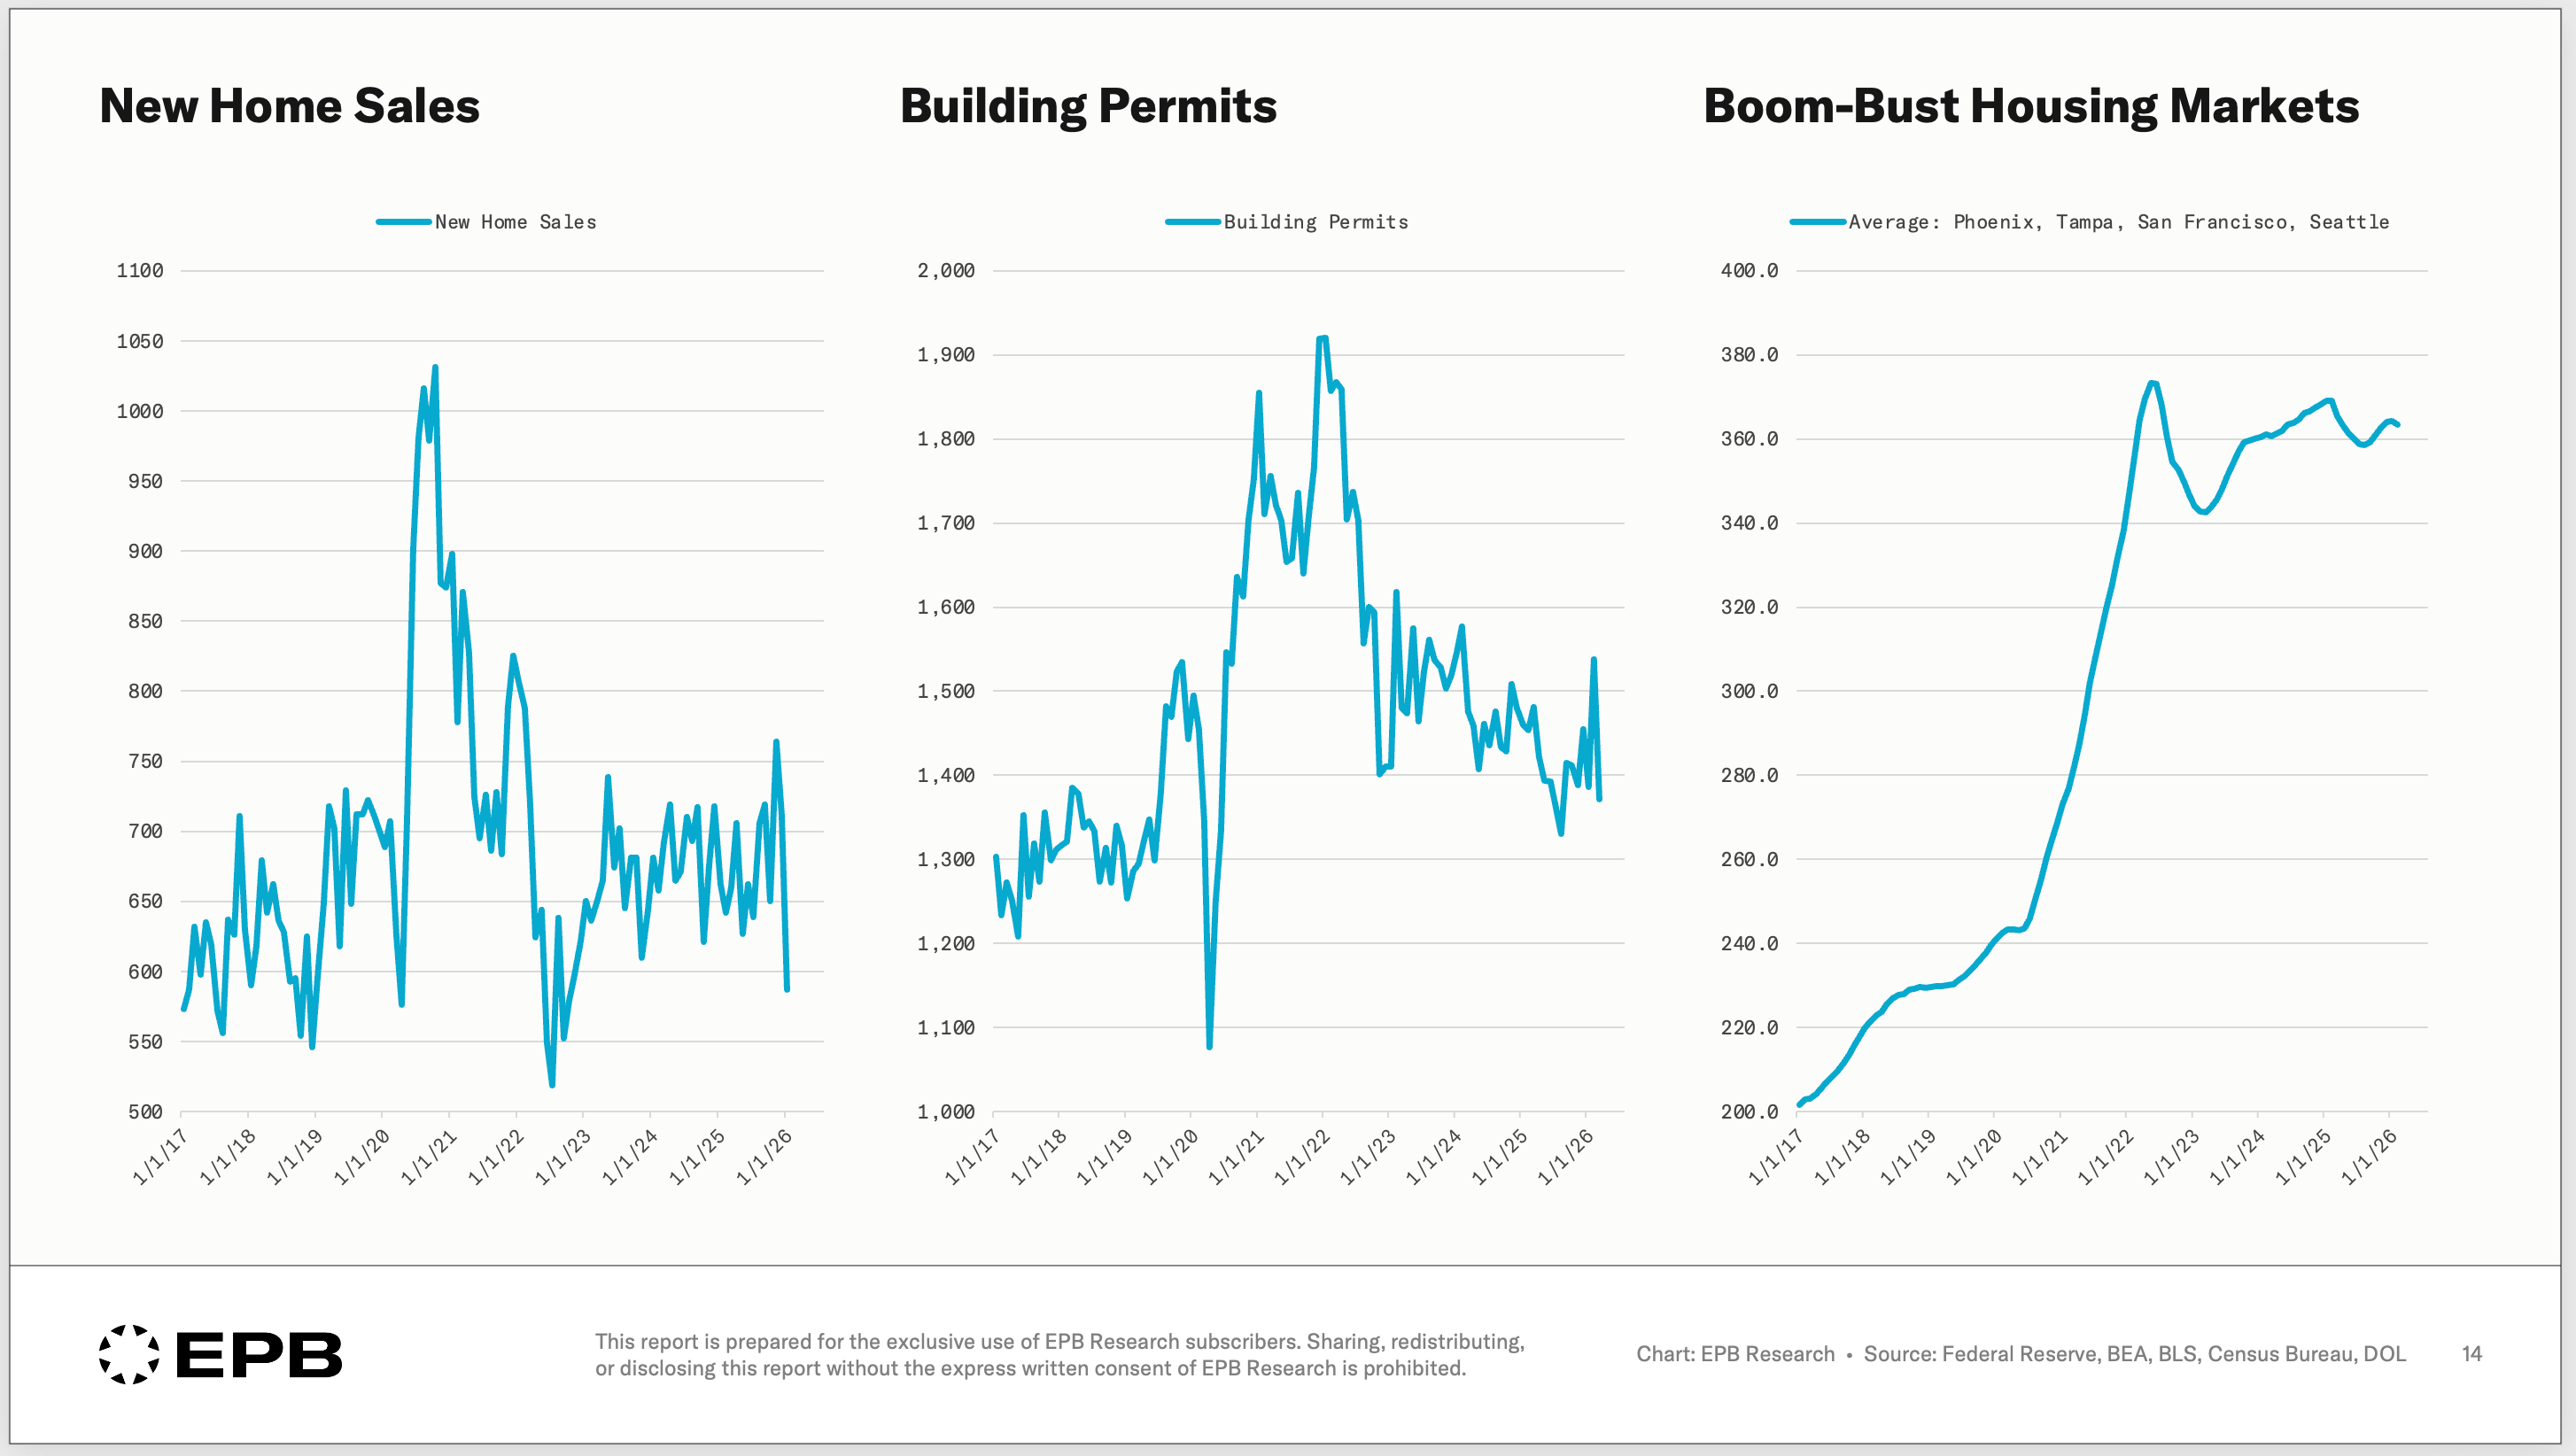
The second composite is the average of Phoenix, Tampa, San Francisco, and Seattle. Four boom-bust markets. There was an aggressive run-up into 2022, then a fairly sharp drawdown into 2023, and then a recovery attempt that’s still ongoing.
Here’s what’s interesting.
Over nine years, both paths produced almost identical cumulative gains. The Low Supply Path produced an average 77% gain. The Boom-Bust Path produced an 81% average gain. The same nine years, almost an identical total return.
The boom-bust markets didn’t get rewarded for the volatility.
A homeowner in New York earned roughly the same total appreciation as a homeowner in Phoenix over the last nine years. But the New York homeowner never had to watch their home value drop 13% and stay underwater for almost four years.
The Phoenix homeowner experienced the entire emotional cycle. The euphoria of the 2021 boom, the dread of the 2022 reset, the false hope of the 2023 recovery, and now the slow grind of being stuck.
The Sequence Underneath It All
The cities that boomed the hardest from 2020 to 2022 are the cities where building permits, new home sales, and residential construction activity surged the most when rates fell to 3%.
When rates moved from 3% to 7%, the construction activity that drove the boom collapsed.
New home sales fell, building permits fell, and builders started cutting prices.
This is the exact housing cycle sequence we reference often in our research on the residential construction cycle.
Monetary policy moves first. Then permits and construction lead. Employment follows, and prices come last.
Reading Your Own Market
The headline national number is hiding different cycles running at once. Our residential housing framework gives you a way to read your own local market.
Are you in a boom-bust market with huge swings in construction, or are you in a market with limited construction and low inventory forever?
If you are in a boom-bust market, you need to follow the sequence and wait for monetary policy to ease enough that permitting and construction activity starts to pick up again before the housing market gets out of the slump it has been in since 2022. You also need to be far more careful with real estate investing decisions.
If you’re in a market like New York, the housing market is always tight since supply is so low, and the only thing that matters is a national recession with sustained job losses.
We put the full national housing cycle sequence into a free guide, with graphics, visuals, and timelines, using the 2008 period as a case study.
It’s the framework behind how to interpret incoming housing data, what the construction cycle means for the broader economy, and exactly which indicators to watch.
From there, regional differences take over. But it’s the national sequence that sets the tone and puts the whole thing in motion.
You can grab the free PDF guide below.
As a life-long Californian, I don't recall a big building spike over the last 10 years in any mature market. In any year.
Texas and Florida seem to have built much more than my state.
I mention this because the last graph shows New Home Sales, Building Permits, and Boom-Bust Housing Markets.
As I look at the 4 markets mentioned under Boon-Bust, I infer those are the markets being listed under New Home Sales and Building Permits. If so, breaking it out by each of the 4 markets would be insightful.
If prices fall because of higher supply, we should welcome and applaud that outcome.
I almost own my house. Just a small mortgage at such a low interest rate that paying it off makes no sense. As someone who benefits from higher home prices, I am all for building more in California.
My home is in Marin County. Everyone here celebrates every time more land is set aside as Open Space (please genuflect when saying Open Space!).
My kids left the state and expect to never come back due to high home prices...and high just about everything else.
"If you’re in a market like New York, the housing market is always tight since supply is so low."
It's the densest city in the country. Supply per land area is higher than anywhere The market is tight because demand is so high.