

Every Economic Number Is Either Early or Late. Most of the Famous Ones Are Late.
The three biggest numbers in economics share a hidden flaw: they can only confirm what already happened. Here’s the small, specific part of the economy that actually moves first.

If you ask anyone how the economy is doing, they will all reach for the same economic numbers: GDP, nonfarm payrolls, or the unemployment rate. Even worse, they may quote the stock market's year-to-date gain or loss.
While this is a reasonable instinct, it’s a dangerous analysis.
These are the biggest, most comprehensive, and most widely cited measures of the economy that we have. And the truth is that they are very reliable at what they measure. GDP is the sum of everything the country produces. Nonfarm payrolls count the total number of jobs in the economy. If you wanted a single reading on the economy’s health, these are the obvious places to look.
But that instinct will leave you blindsided every time. Every recession will “come out of nowhere,” and every boom will feel like you missed the boat.
These aggregate numbers don’t describe where the economy is going.
They just tell you what already happened.
The start and end dates of a recession are officially measured by these indicators.
Which means these numbers can’t warn you that a recession is coming, or if the economy is going to heat up, for the same reason rain can’t warn you of bad weather. When you feel the rain, the weather has already arrived.
By the time GDP turns negative and unemployment climbs, the downturn isn’t approaching; it’s already here, and it has been for months.
This seems like a technicality, but it’s the difference between reading where the economy is heading and reporting what it's doing today.
So in this post, I’ll show you why the most trusted numbers in economics are structurally incapable of giving you a warning, and the narrow, specific slice of the economy that actually turns first in every cycle, even while the headlines still look calm.
The Biggest Numbers & The Trap
If we start with the big numbers: GDP, payrolls, personal income, personal consumption, and the unemployment rate, we have a basket of highly reliable data points that define what's going on today. At EPB Research, we call these “Aggregate Economy” indicators.
Tracking this data feels good since you’re using the largest, broadest, and most time-tested data available. With such a broad scope, you can’t possibly miss what’s going on, right?
But we have to follow this logic one step further to understand the true problem and the real danger.
If the Aggregate Economy is the very thing that defines a recession, then trying to use it as an early warning is circular. You cannot get advance notice from the one indicator that, by definition, turns at the exact moment the recession begins.
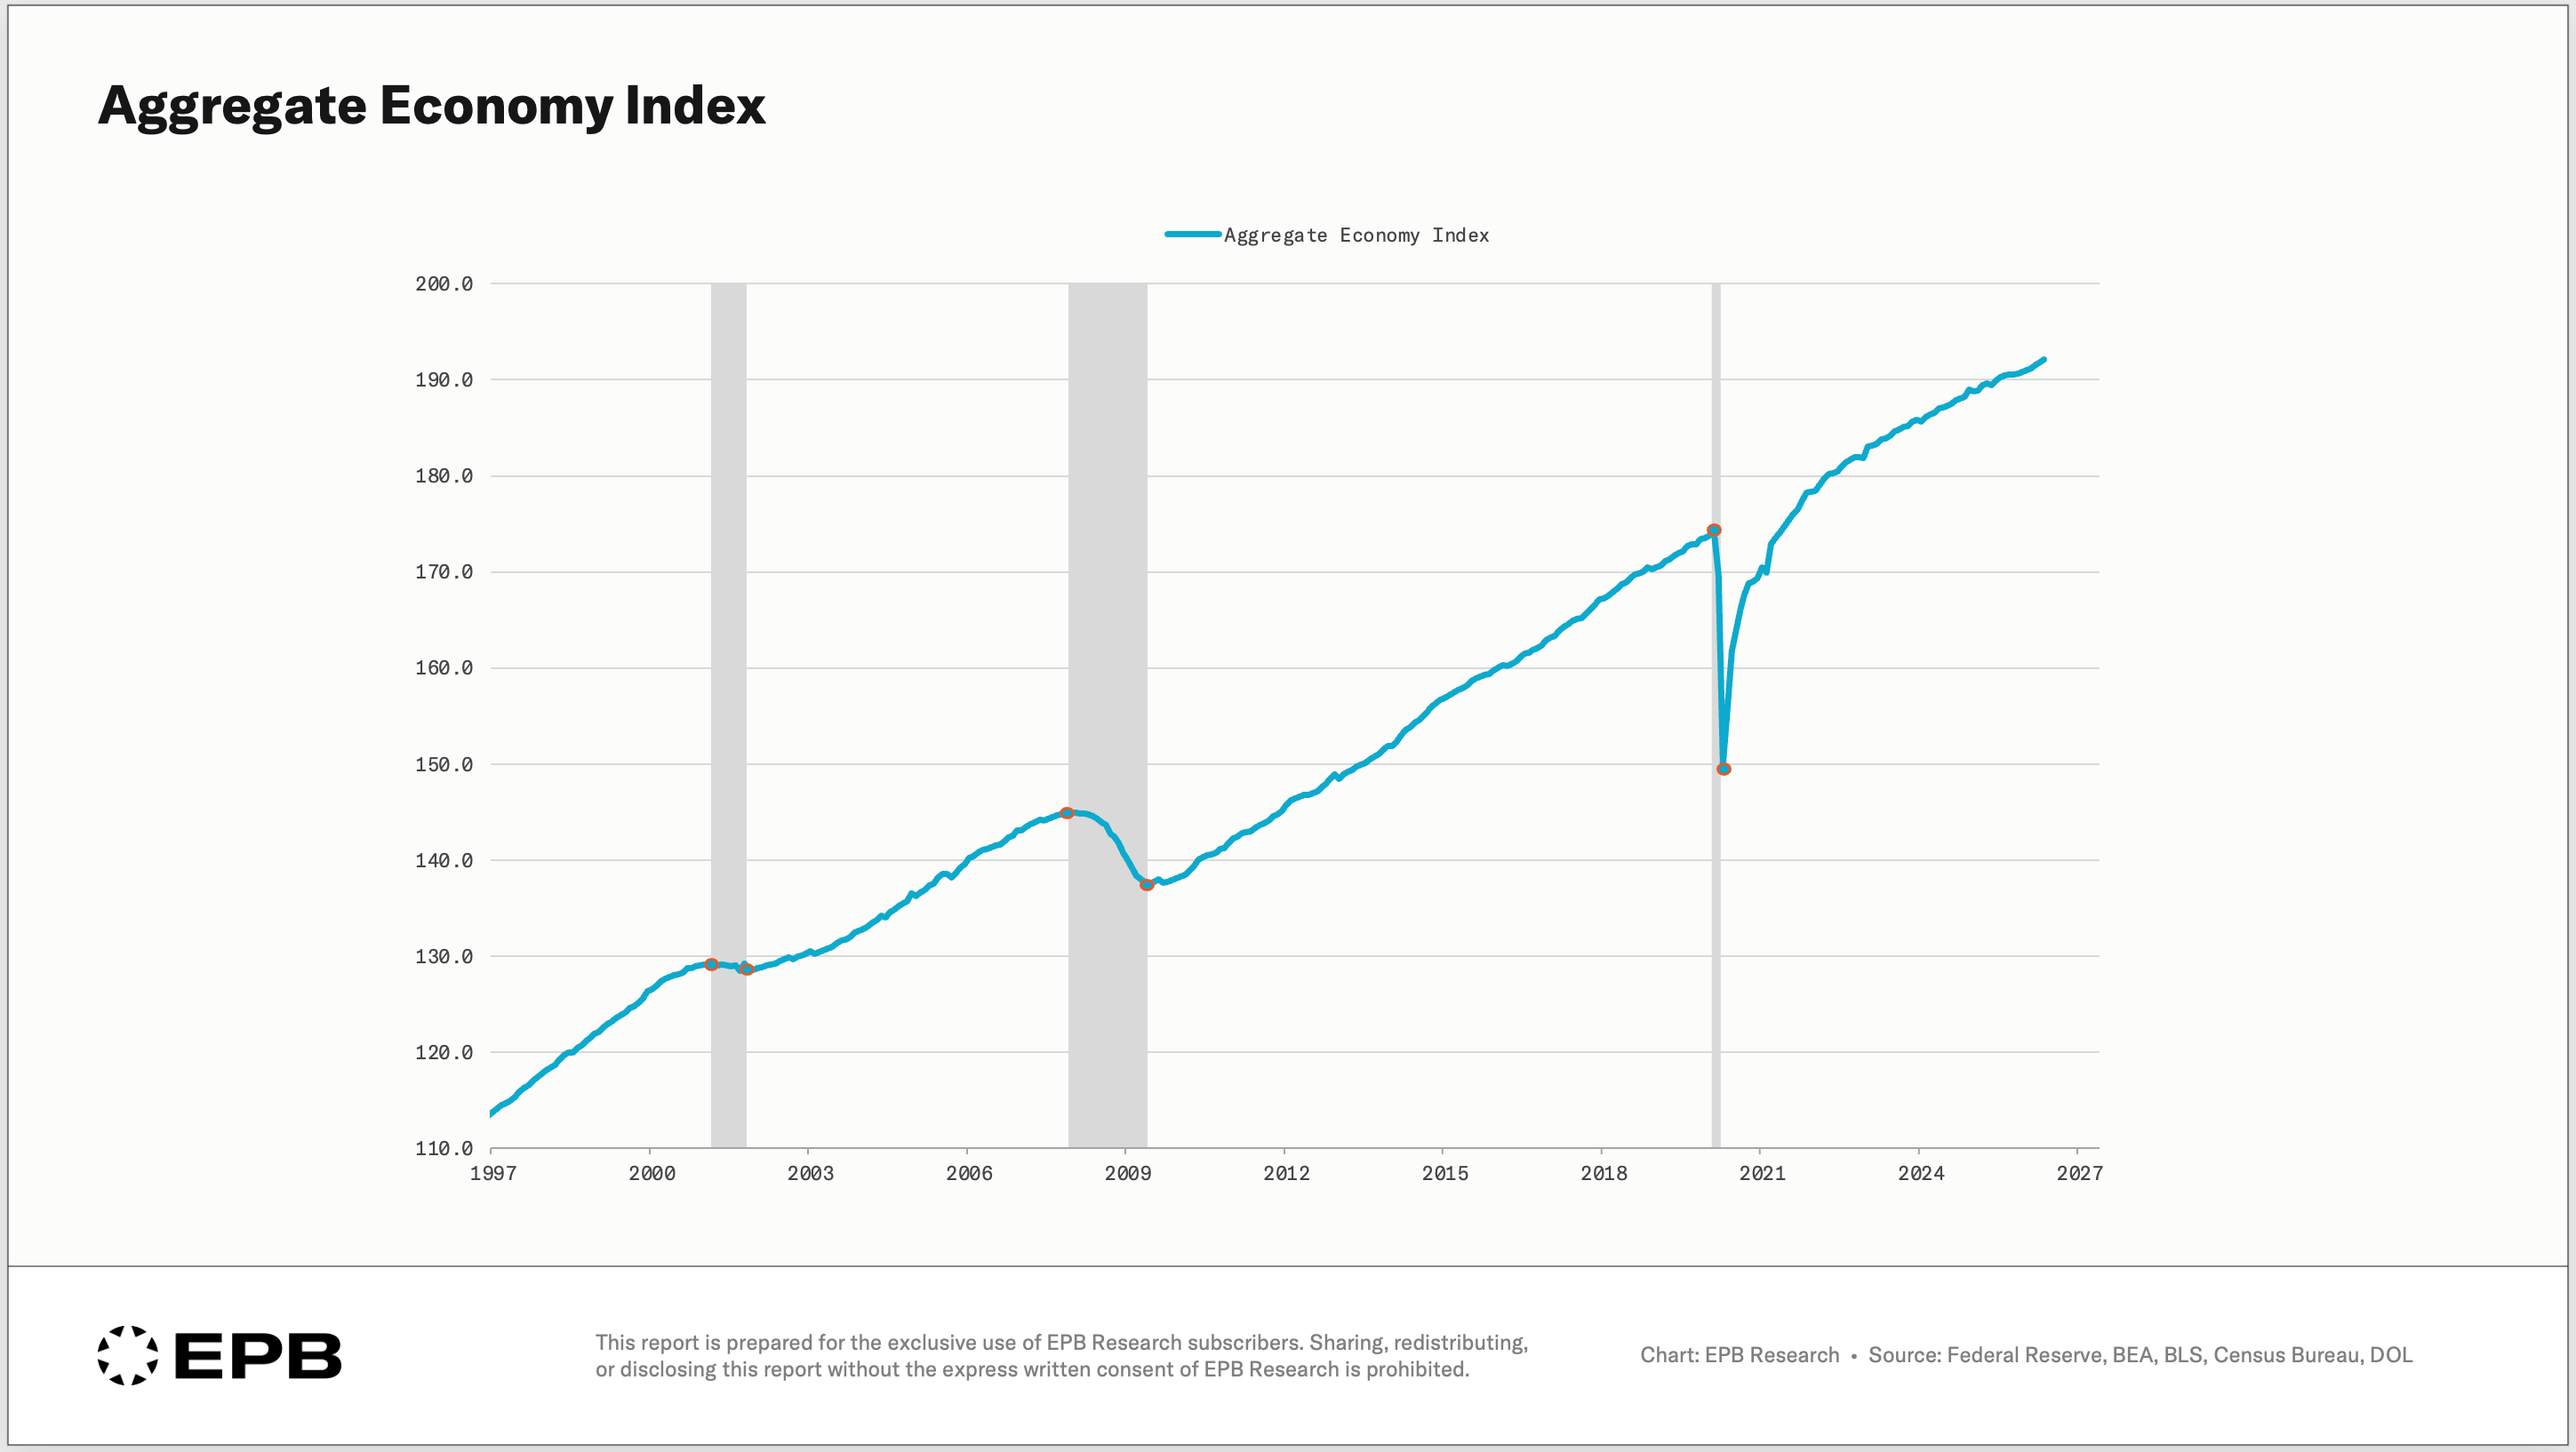
When it finally rolls over, you’re not ahead of the downturn. You’re standing in it.
That single logical point is why the biggest headline numbers have such a poor record as a warning system and why recessions always have a story that starts with “no one saw it coming.”
Think about this.
What if you heard the following:
Real GDP growth is 3.9%, the unemployment rate is 4.0%, and the S&P 500 is up 13% in the past year.
A string of numbers like this is exactly what you’d hear as evidence for why the economy is strong, and the risk of a recession is low. How could a recession occur on the heels of data like that?
That string of data was Q3 2000, less than two quarters away from the start of the Dot-Com recession.
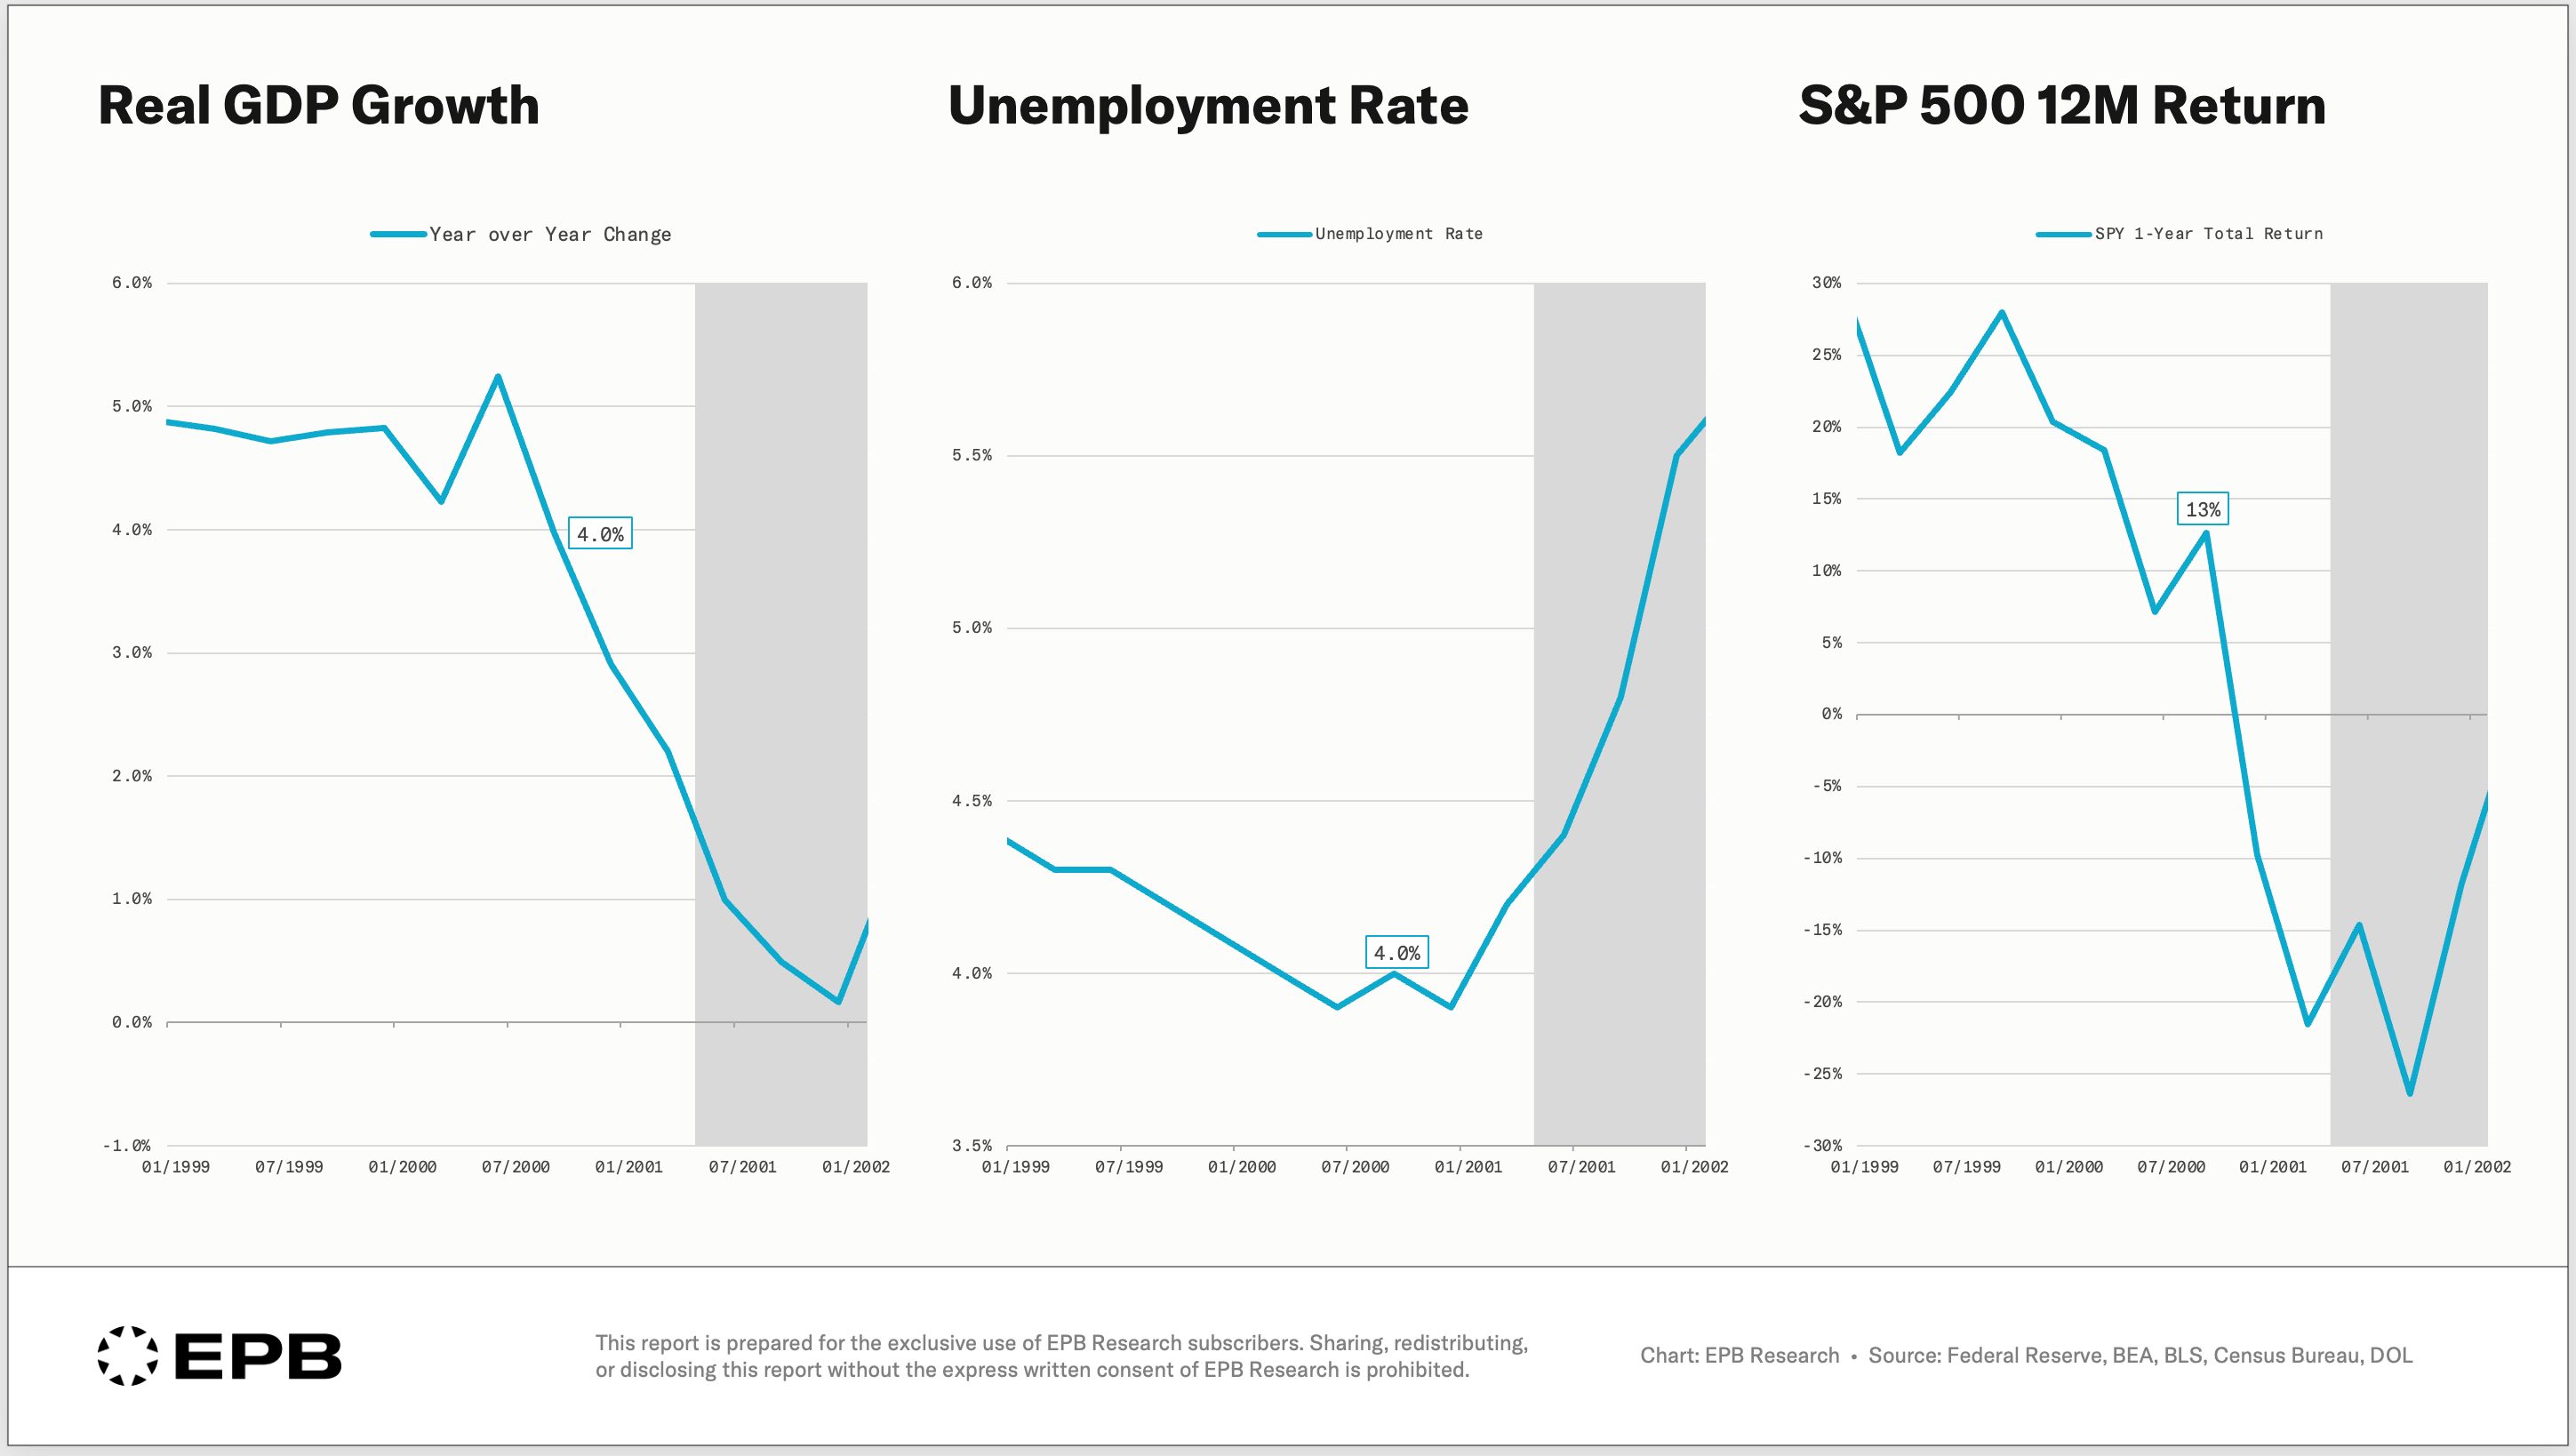
How about real GDP growth of 2.4%, unemployment rate of 4.7%, and a 12-month S&P 500 return of 16%.
That was Q3 2007. Less than a quarter away from the official start of the Great Financial Crisis.
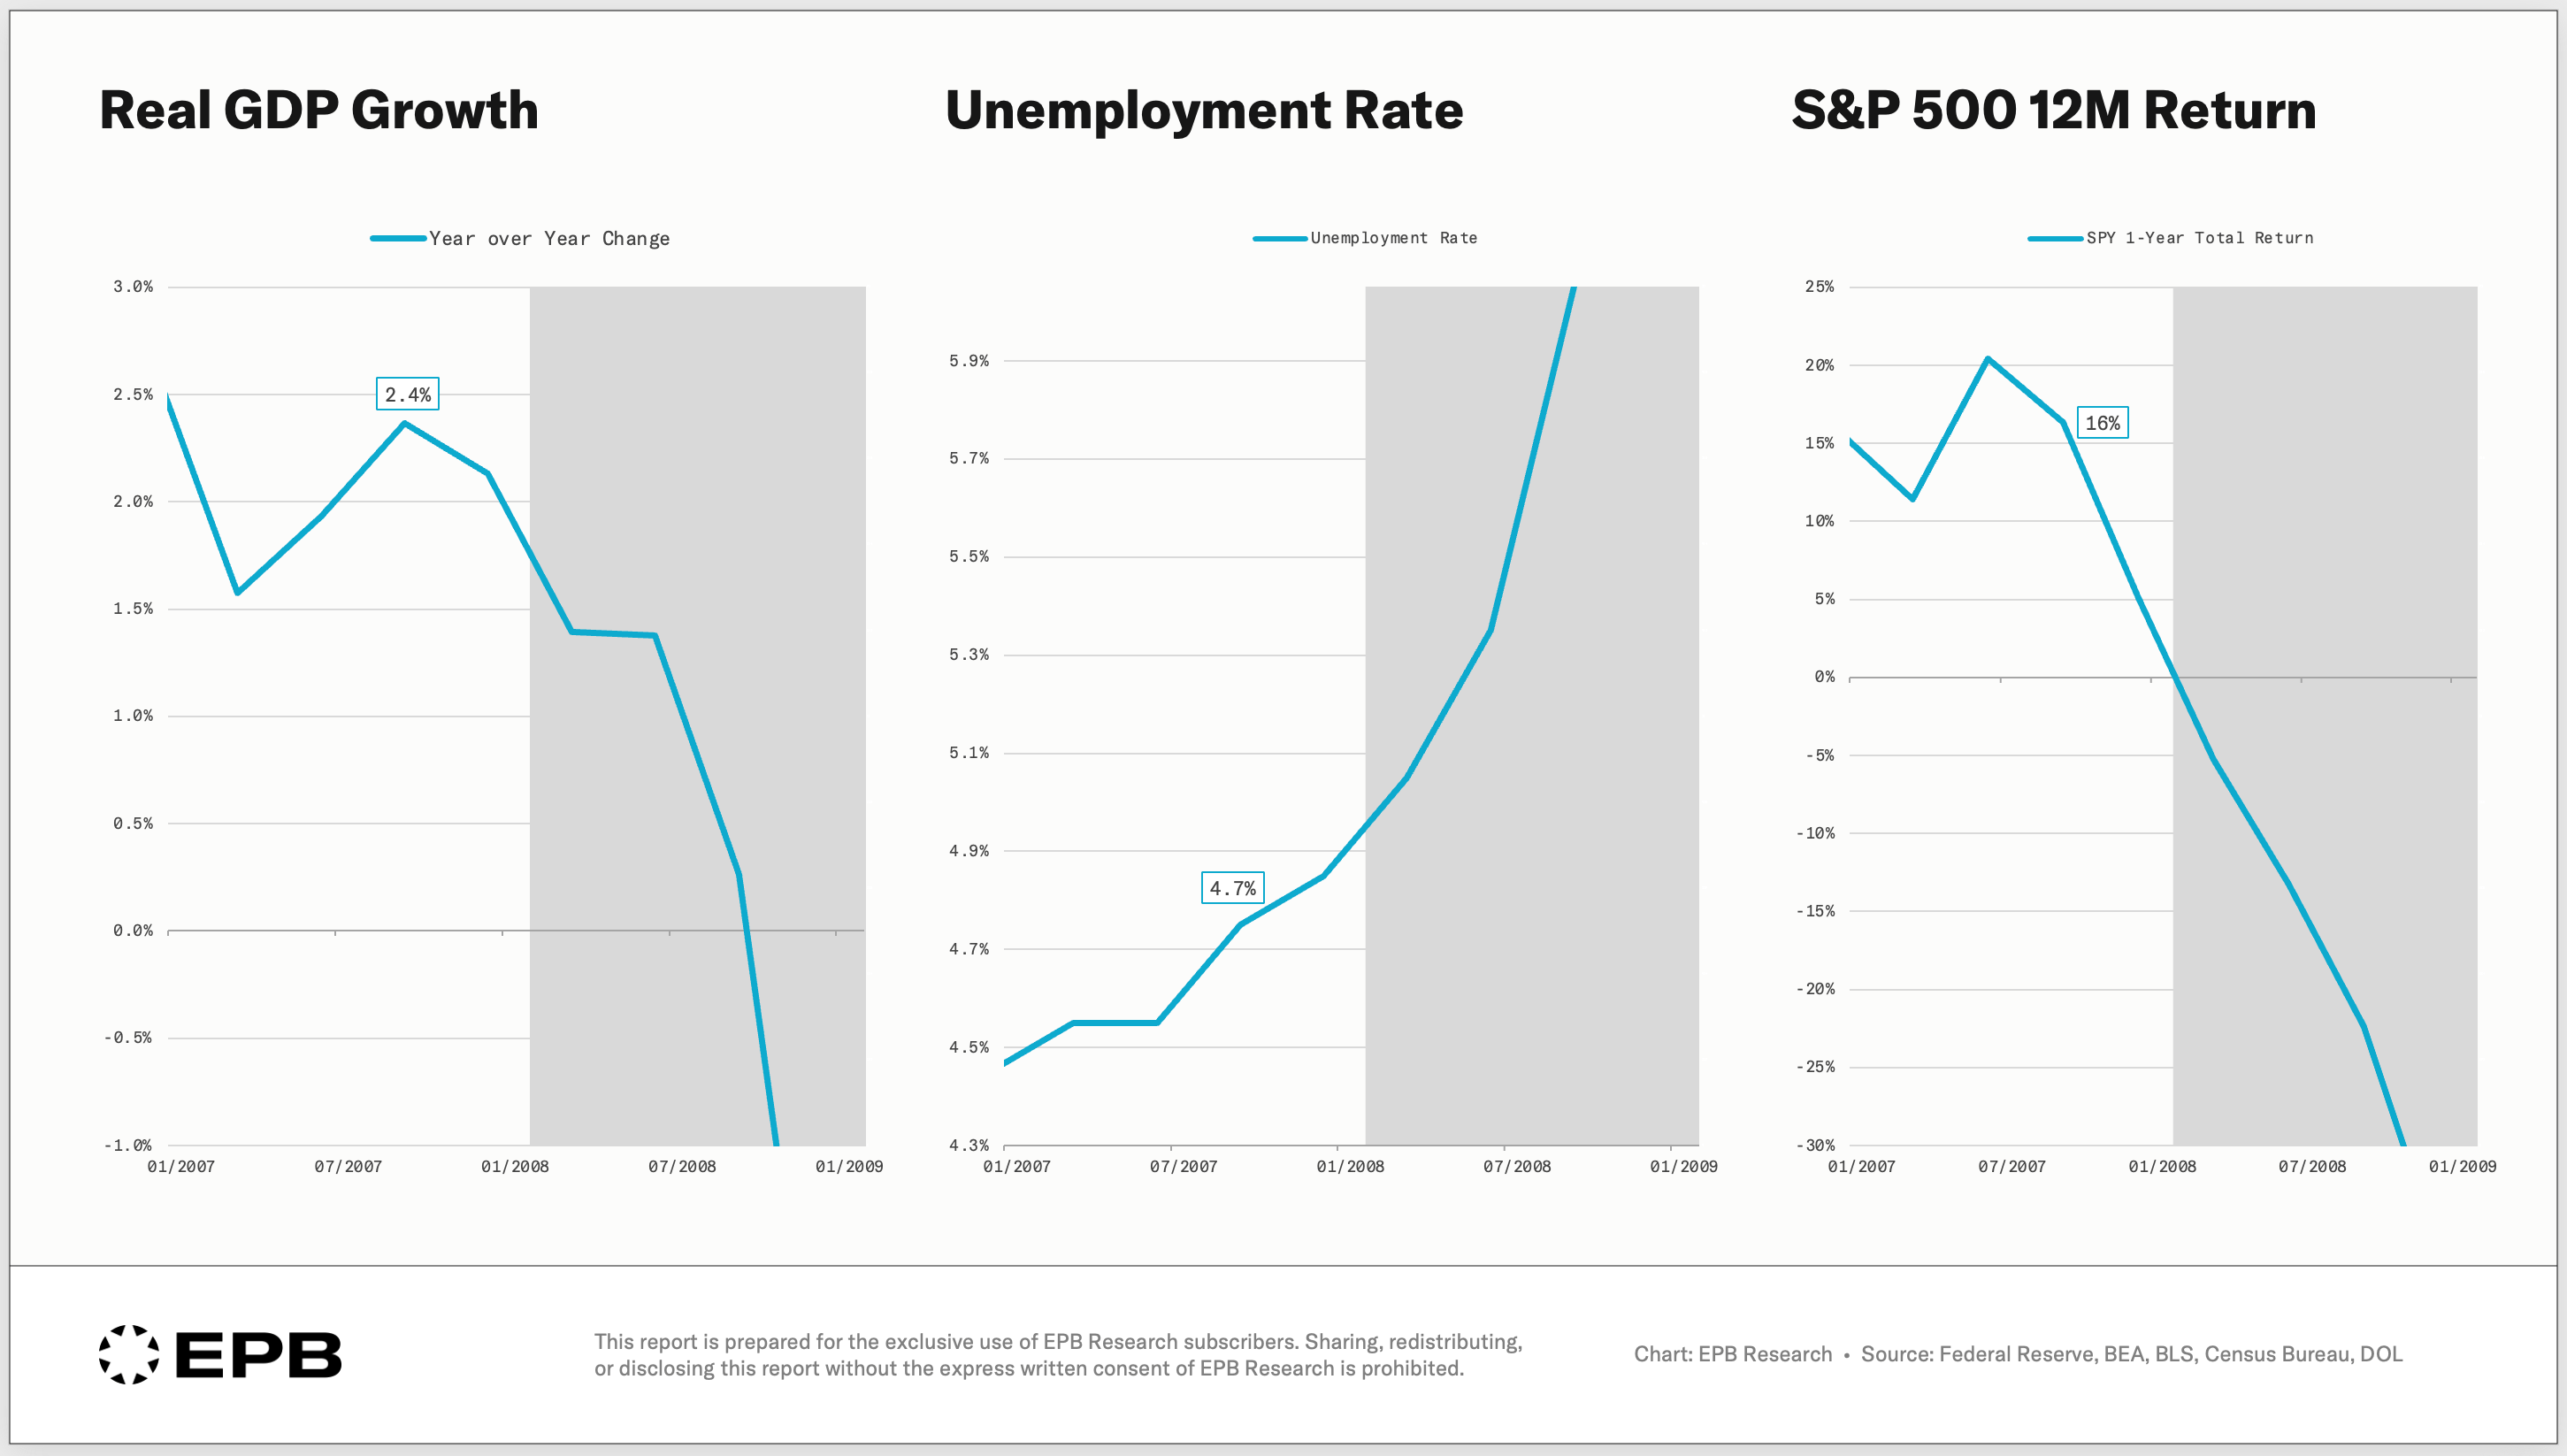
In both cases, the Aggregate Economy data wasn’t lying.
GDP really was growing. Unemployment really was low. The stock market was booming. The numbers were accurate.
They were simply describing a photograph of a moment that had already passed, while the ground had shifted underneath months earlier.
These facts are not a claim that a recession is around the corner; they are supposed to highlight that we cannot look to GDP growth, the unemployment rate, or the stock market to tell us where the economy is going.
What Actually Moves First?
So if the most widely cited, common data points won’t do the job, then what data actually moves first?
The truth is that the economy doesn’t move as one single unit. So it requires nuance and the ability to see one part of the economy as in recession, and one part of the economy still booming. This is a situation that can happen, and it does…all the time.
At the beginning of 2007, the housing industry was in recession, but services, healthcare, government contracts, and big corporate expos were still booming.
Two people could be talking, and one says the economy is in recession, and one just had the best quarter in business. Both could be true.
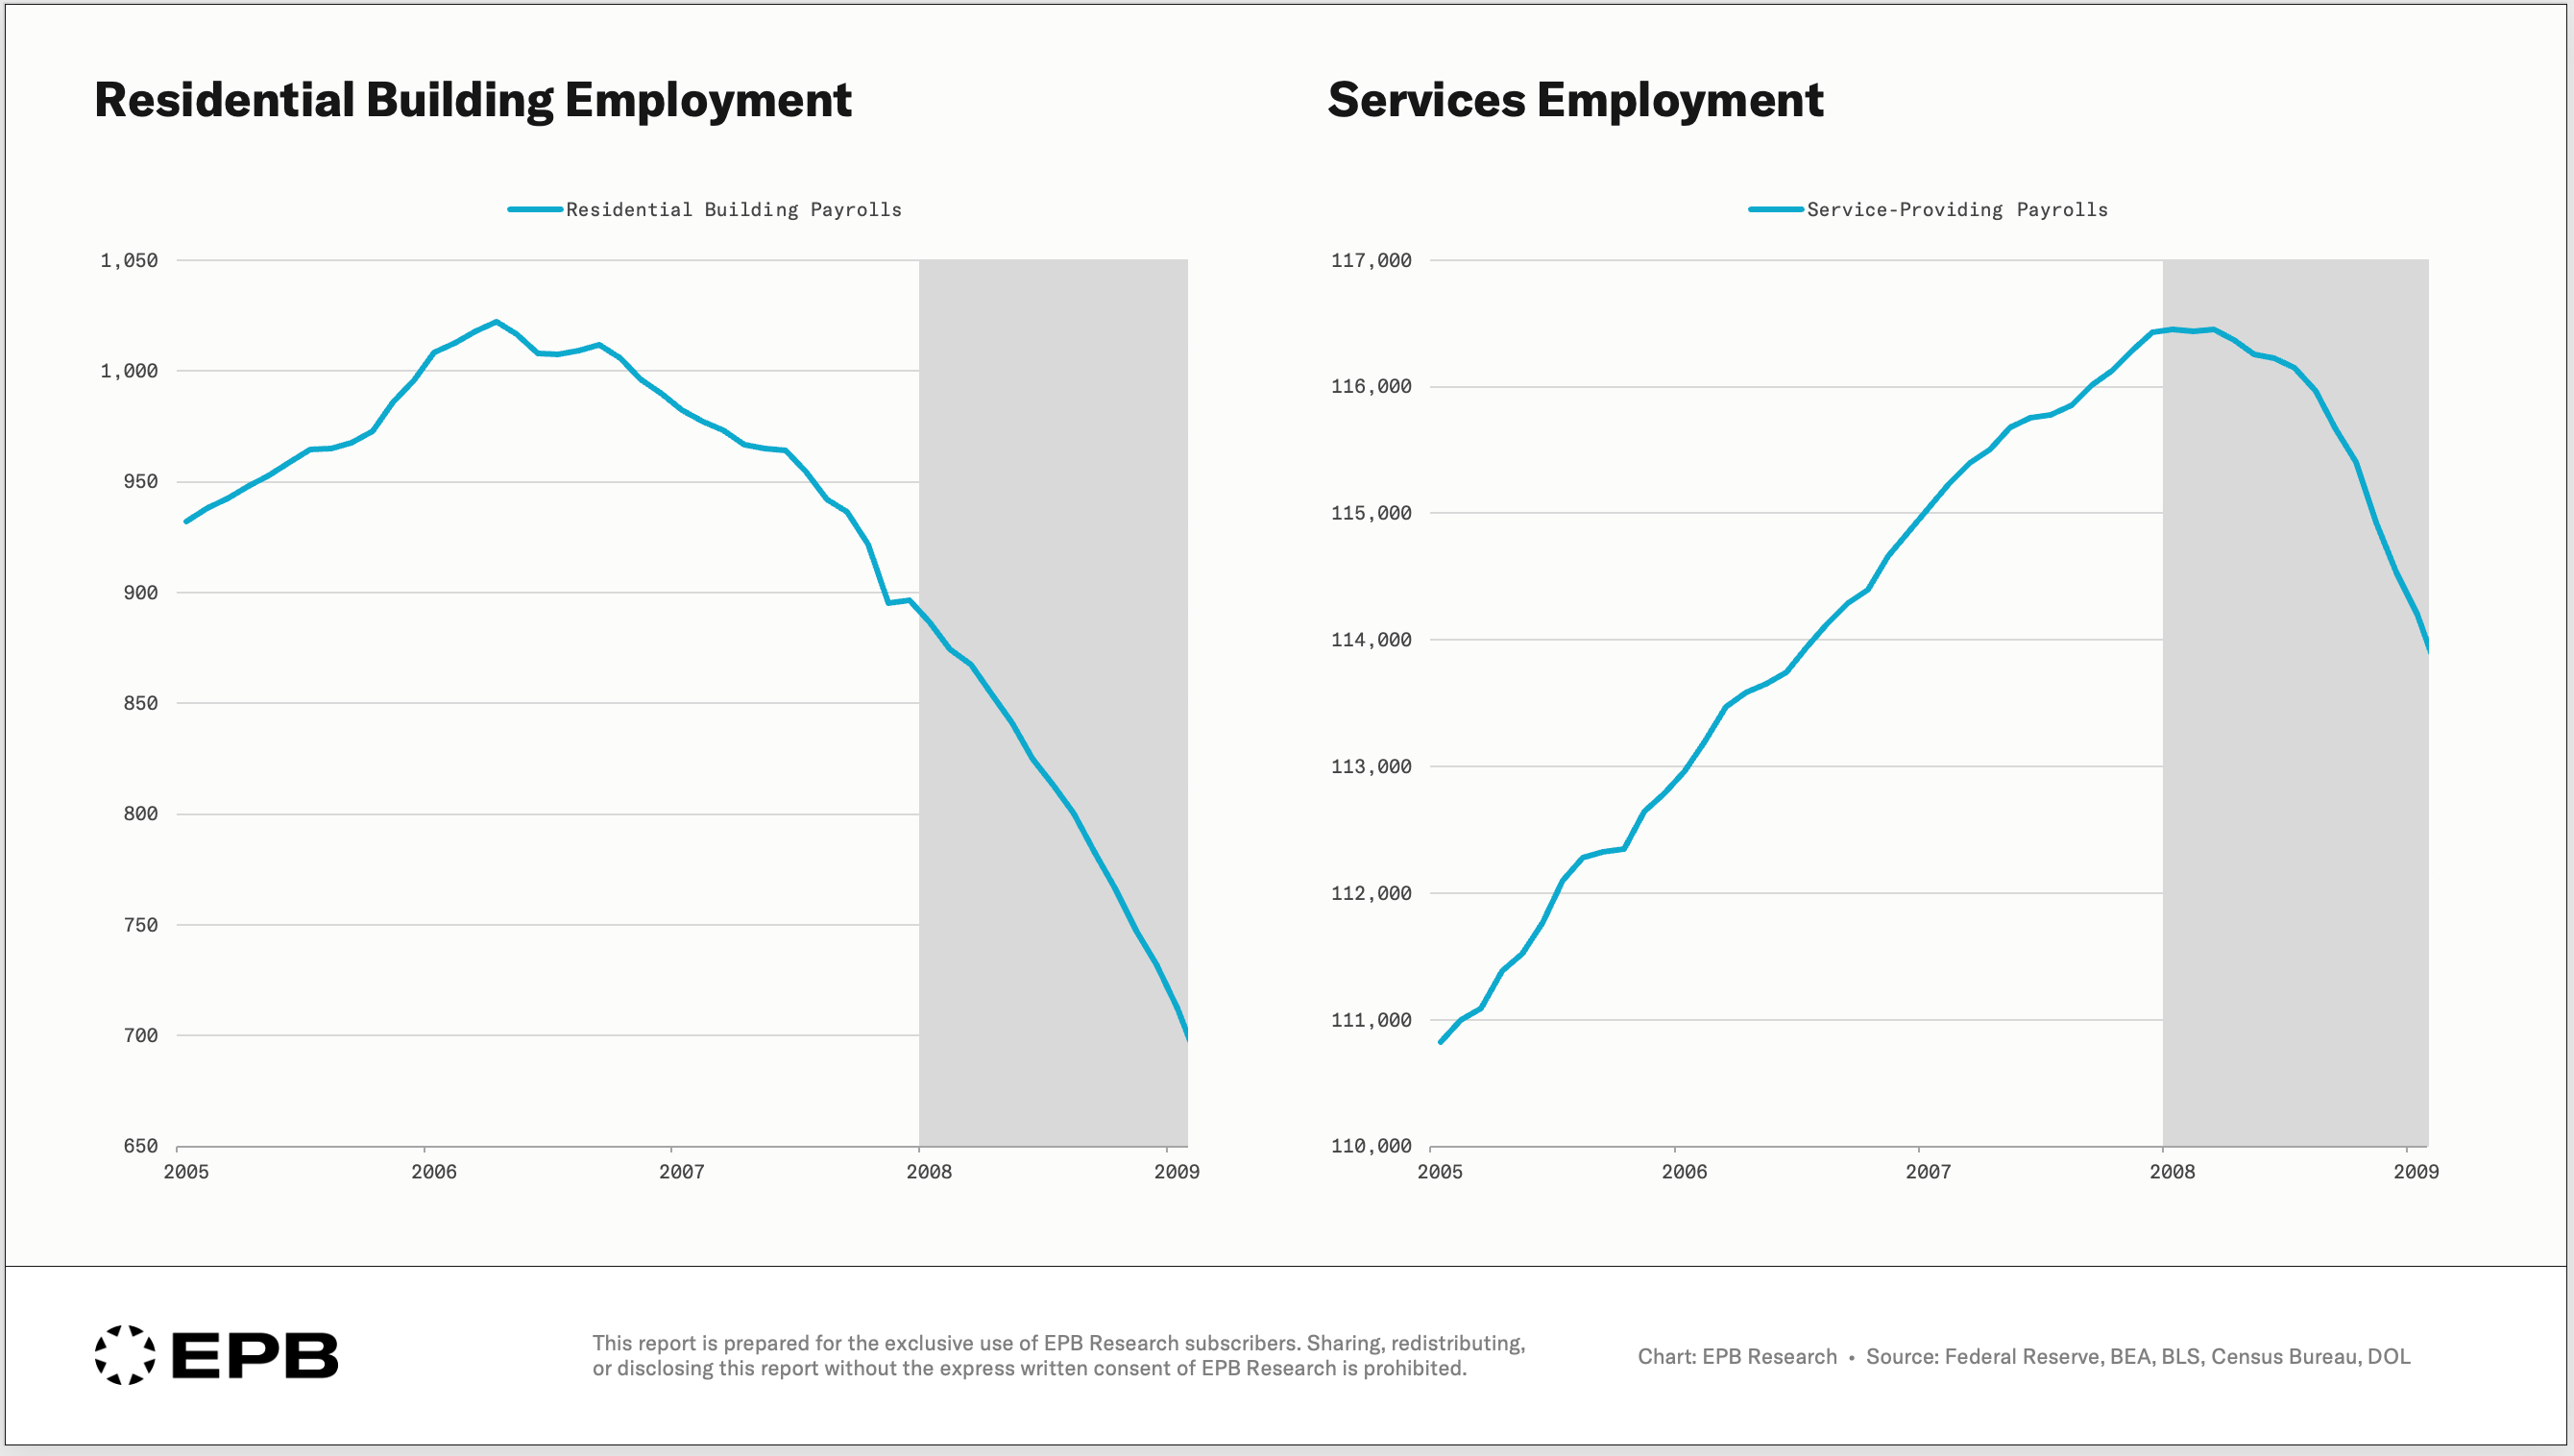
The economy moves in a sequence. Some parts of the economy always move before the average, and some always move after the average.
The entire skill of reading the economy early is knowing which part you’re looking at.
At EPB, we organize this into the Four Economy Framework.
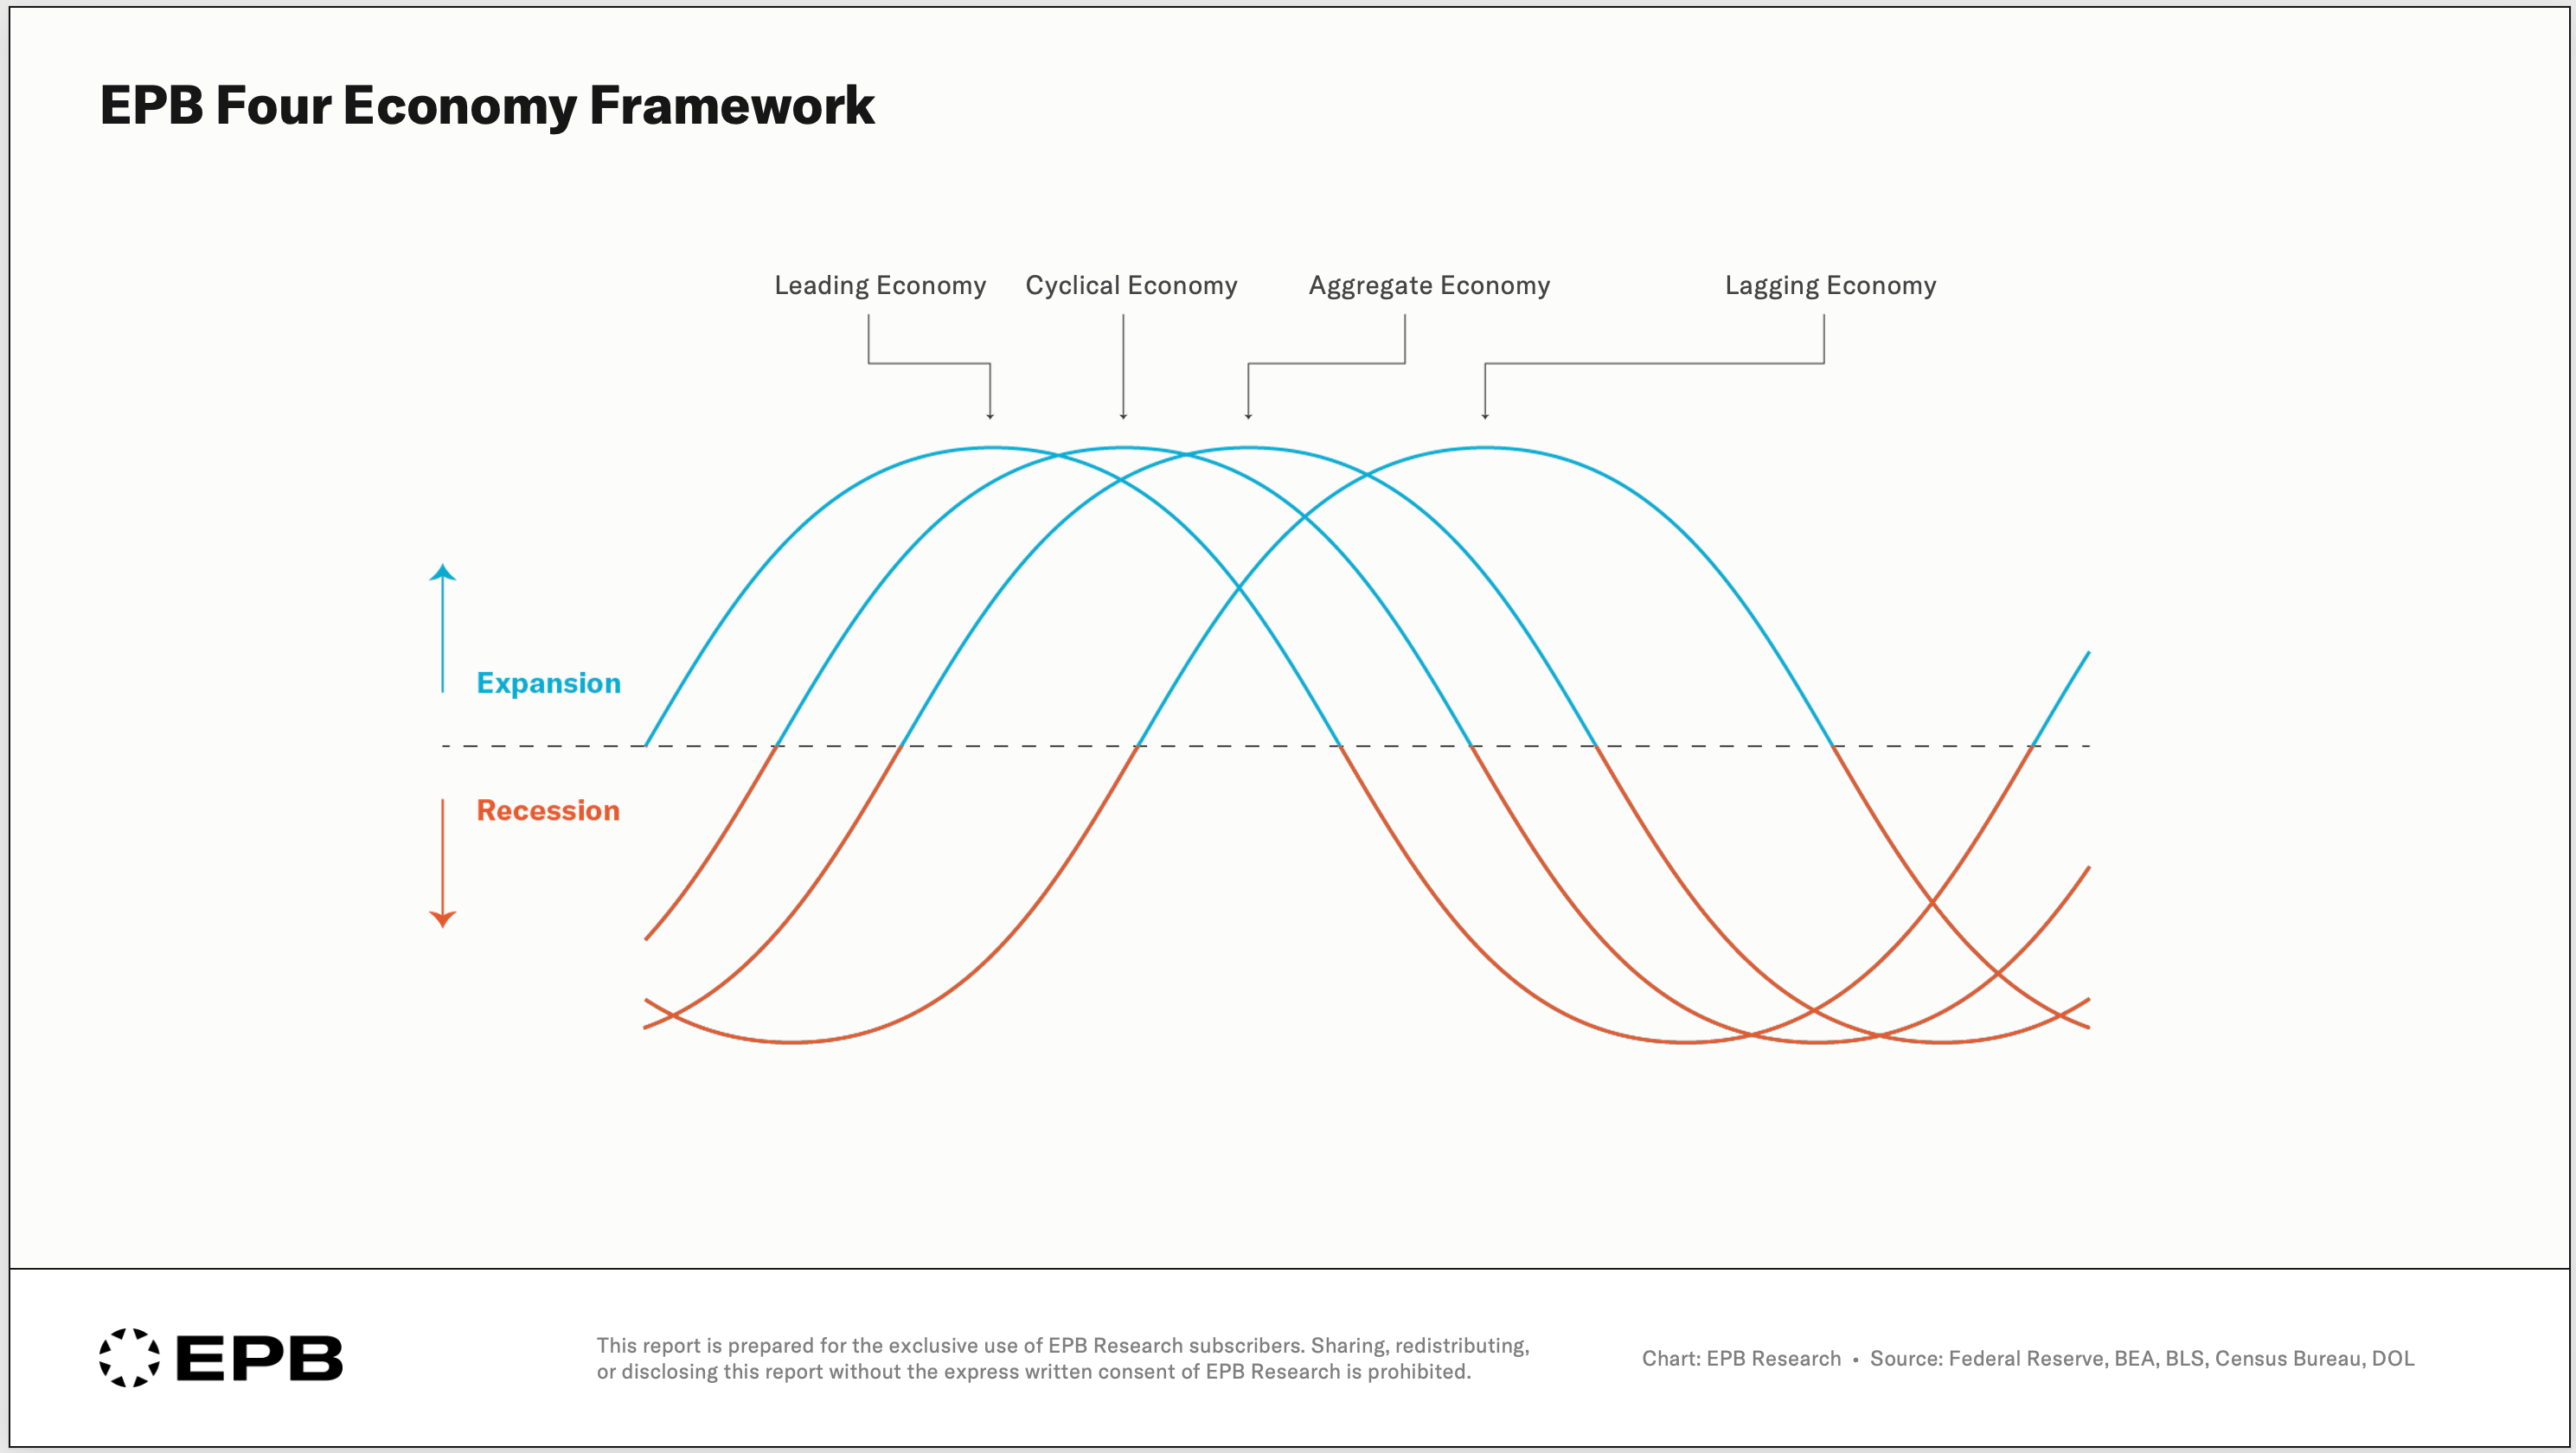
Four buckets or four groups in the order they actually move:
The Leading Economy: The availability of money and credit, and the earliest commitments people make with borrowed money, such as the real money supply, the yield curve, and building permits. These are signals of monetary policy and applications about the future.
The Cyclical Economy: The engine of the economy. The source of booms and busts. Growth and employment in construction and manufacturing. About 15% of total jobs, but nearly 100% of recessionary job losses.
The Aggregate Economy: What defines the economy. GDP, nonfarm payrolls, the unemployment rate, personal consumption, and personal income.
The Lagging Economy: Most of the Lagging Economy never contracts. Not even in recessions. Education, healthcare, services, and government work. A big part of the economy, but it never has big swings, and it moves last, only as a byproduct of what happened in the Cyclical Economy a year or two earlier.
The three numbers that dominate the headlines all live in the third bucket.
There are two entire stages of the sequence, the Leading Economy and the Cyclical Economy, that turn before the Aggregate data has moved at all.
The people who saw 2001 and 2008 coming more than a year early weren’t smarter or luckier. They were reading the front of the sequence while everyone else was staring at the back.
Putting Theory into Practice
The problem is that the biggest and most commonly cited numbers don’t move first. They move closer to last. It’s comfortable to side with GDP, the unemployment rate, and the stock market, but we’ve just seen how that can be a disaster time and time again.
The fix isn’t to watch more data or watch the wiggles of GDP even closer.
It’s to watch the right data, in the right order. It’s to focus more on the leading half of the equation rather than the lagging half.
The averages, like GDP, combine the leading parts with the lagging parts. It’s a reliable gauge of the temperature outside today, and that’s useful, but not as a forecast.
So watch the part that moves first, ignore the noise that moves last, and use the big numbers as confirmation.
Every week, I send out a newsletter with current events, data, and news filtered through the Four Economy Framework. One email, plain English, every Sunday.
If you want to stay updated on the narrow slice of the economy that actually matters, join the free EPB Research newsletter below.
You’ll also get Breaking Down GDP, a one-page map of the narrow 20% of the economy that drives every boom and bust.
If you found this informative, please share it with someone who would find it useful.
If you have a question or a comment about the Four Economy Framework, leave it below or send me an email.