

Build Less, Pay More: What Happened to American Housing
Housing is the best example of a deeper shift: America has stopped funding its own investment, and stopped building the physical structures most people rely on.

Before diving into the post, I wanted to let you know that EPB Research has a free Sunday newsletter.
One email per week with ongoing business cycle education plus live examples of the framework in action. Click the button below to join for free.
Now, let’s talk about what happened to American housing and the deeper shifts at the national level.
Housing costs and affordability are among the biggest issues in America today. Construction is too expensive, and housing always feels like it’s in short supply.
Adjusted for inflation, America now adds less housing per household than it did in the late 1960s, and the cost of building it has far outpaced almost everything else.
It’s tempting to say that the issues are mostly zoning, interest rates, or regulations of your specific city. Those factors certainly matter.
But really, the housing situation is the most visible sign of something bigger happening at the broader macroeconomic level.
There are two major forces at play…
America has slowly stopped building physical structures, and it no longer funds the investment it does make.
In this post, you’ll see why we can no longer fund our own investment, the major shift in the type of investment we do make, and why housing is where the burden lands on people most severely.
Two Filters: Depreciation & Inflation
To see what’s really happening, to housing or anything else, a spending figure has to clear two adjustments first.
The first filter is depreciation, which is why the number that matters is net investment.
Net investment counts only what’s added beyond what wears out. If you invest $1,000 in a new road while $500 of the existing road decays, the net investment is just $500.
Depreciation has risen in recent decades, partly because we shifted from structures (buildings) that wear out over 30 years to equipment and software that wear out far faster.
That shift quietly lowers net investment, or demands more spending just to stand still.
The second filter is price, which is why the number that matters is real investment.
If a mile of road once cost $1,000 to build, and years later that same $1,000 builds half a mile, the same money bought half the real investment.
So the truest measure of how much investment actually reaches the economy, in a form people feel, is real net investment: after inflation and after depreciation.
We will first look at the entire picture from 30,000 feet, then show why housing is where most people feel the problem most intensely.
America Doesn’t Fund Its Own Investment
Investment has to be paid for out of one of two pockets: savings at home or capital borrowed from abroad. (Saving here means real investment in structures, equipment, and IP, not money in the stock market.)
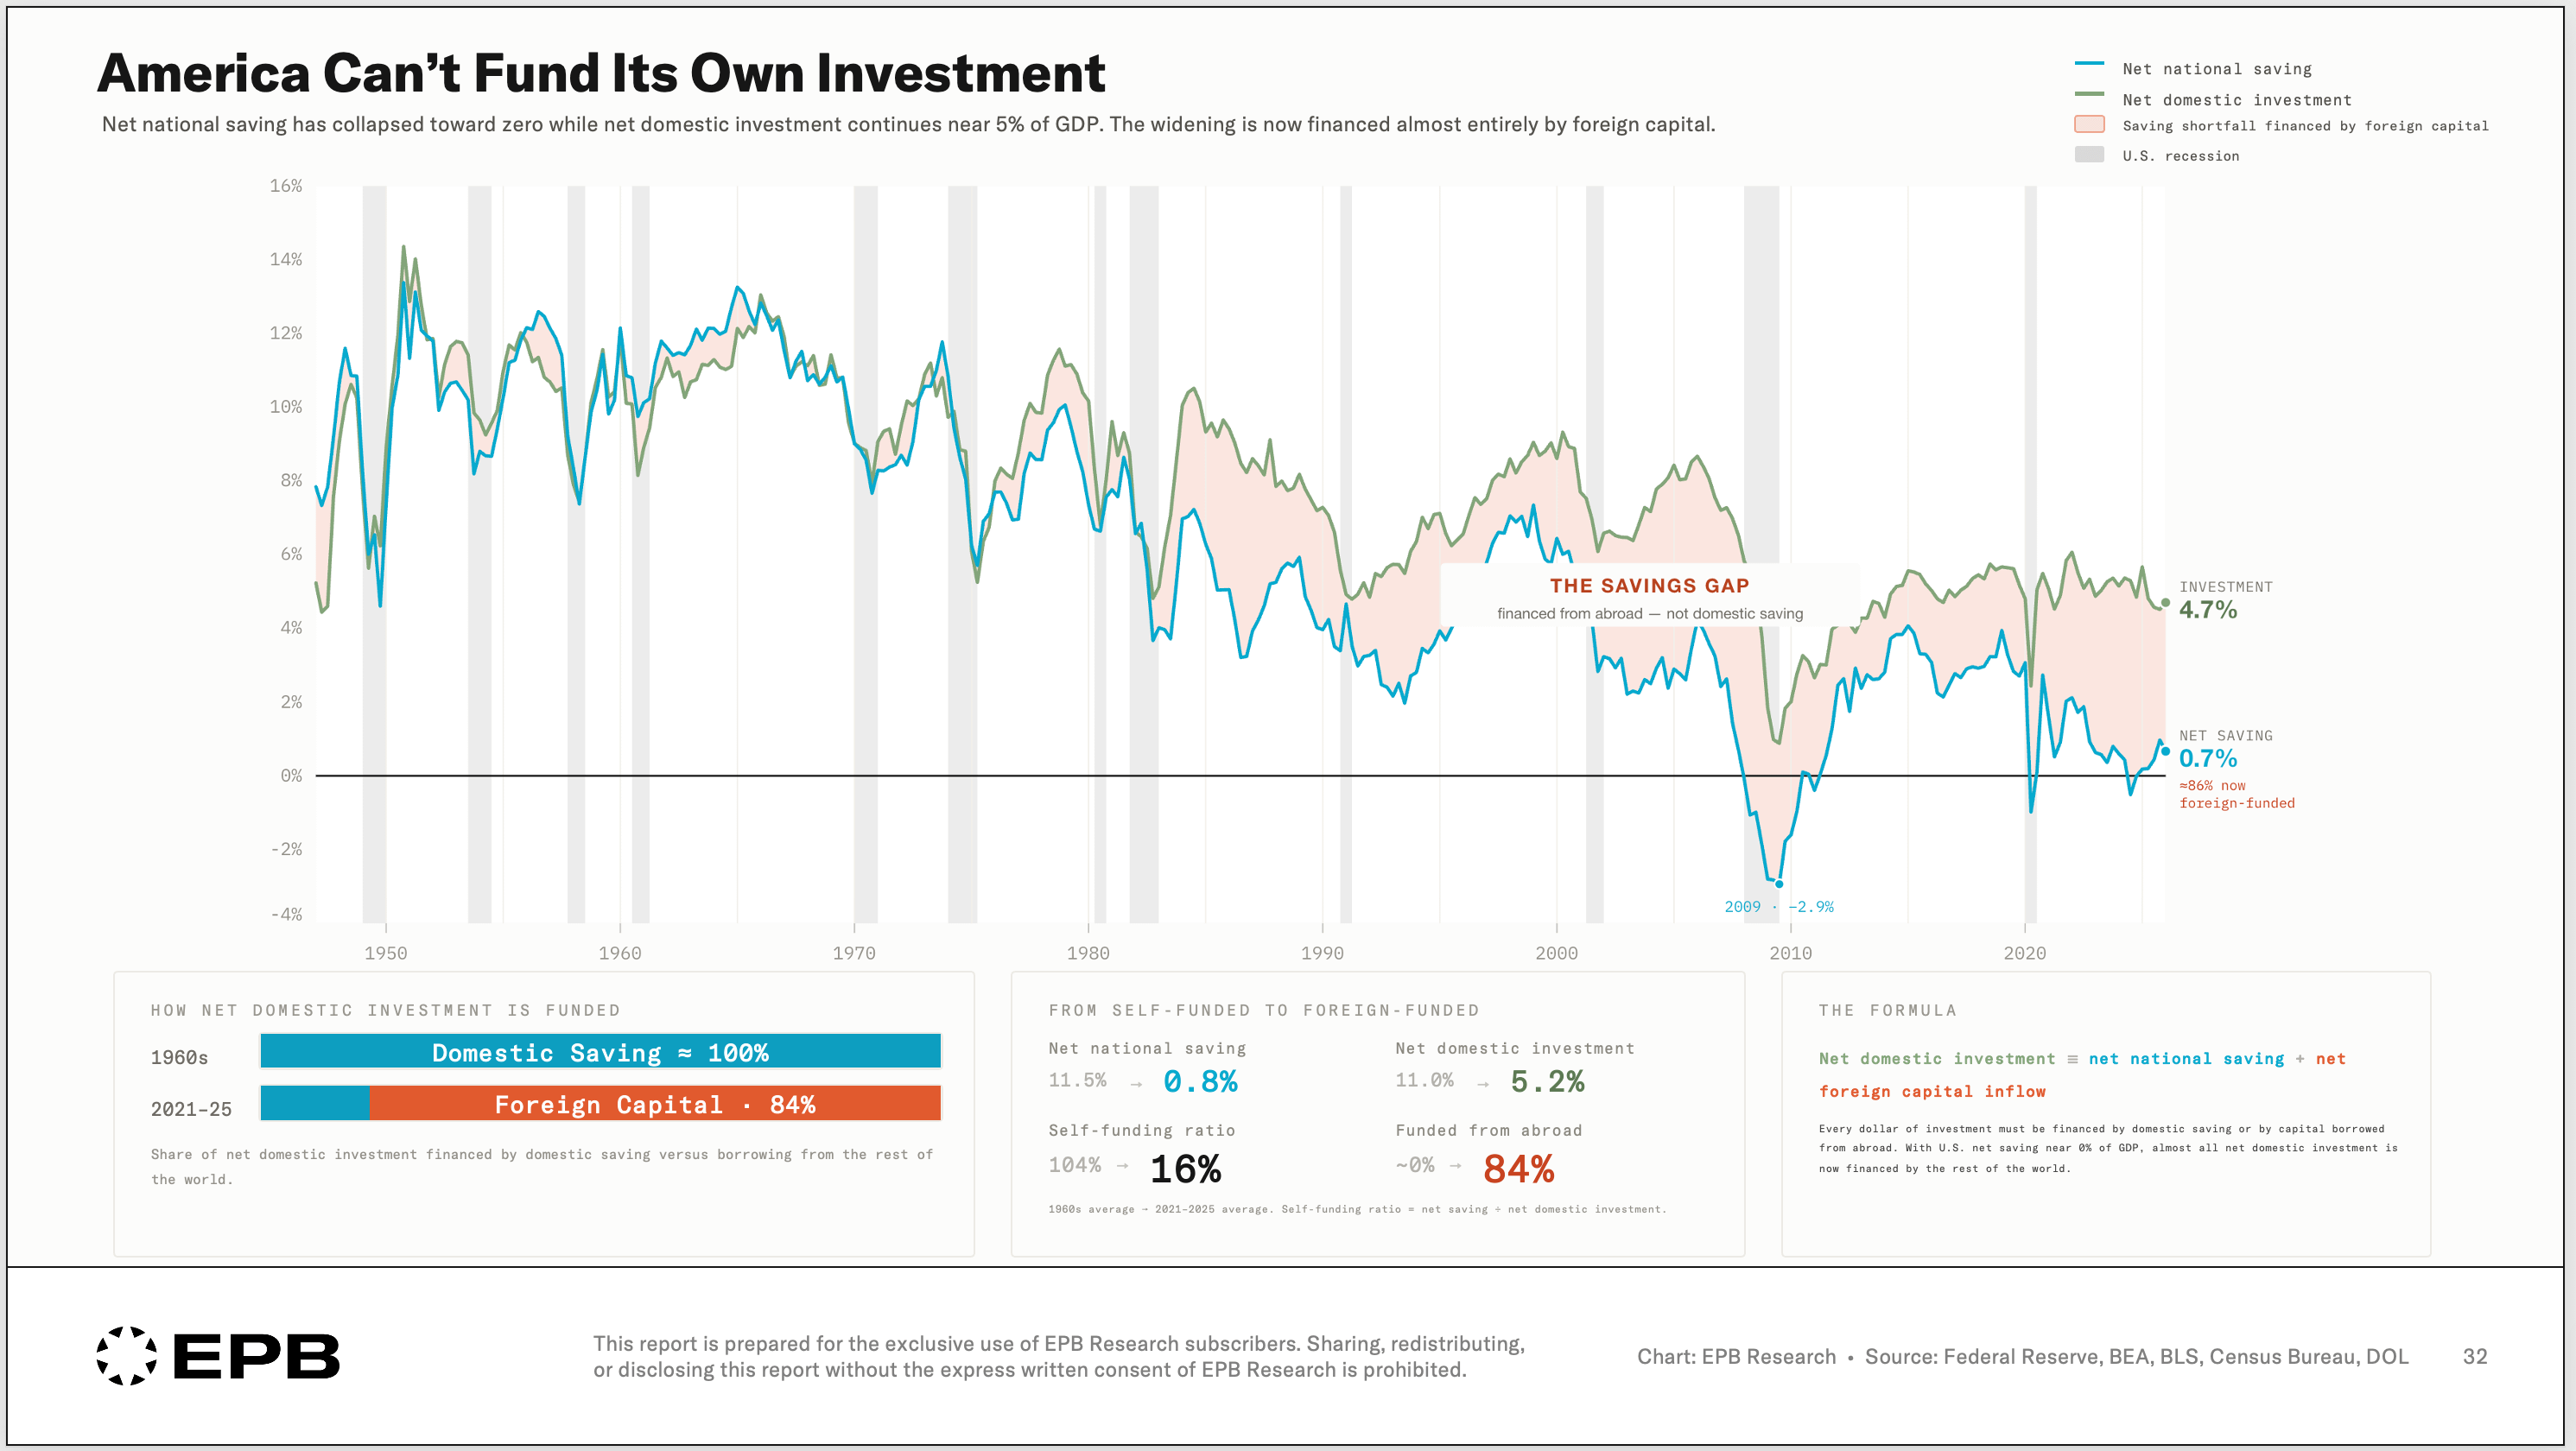
Net national saving has collapsed toward zero, in large part because government budget deficits now absorb most private saving. Government deficits are eating all the savings of households and corporations.
We’ve filled the gap with foreign savings, which shows up mostly as the counterpart of the trade deficit.
Net national saving has fallen from around 11.5% of GDP in the 1960s to roughly 0.7% today, yet net investment still runs near 5%, because the rest of the world funds the difference.

We once funded essentially all of our own investment.
Today, we fund almost none of it.
This will be an important point to hold as we work our way through this situation.
In real terms, total net investment is 5.4% of GDP. That’s down from around 8% in the late 1960s.
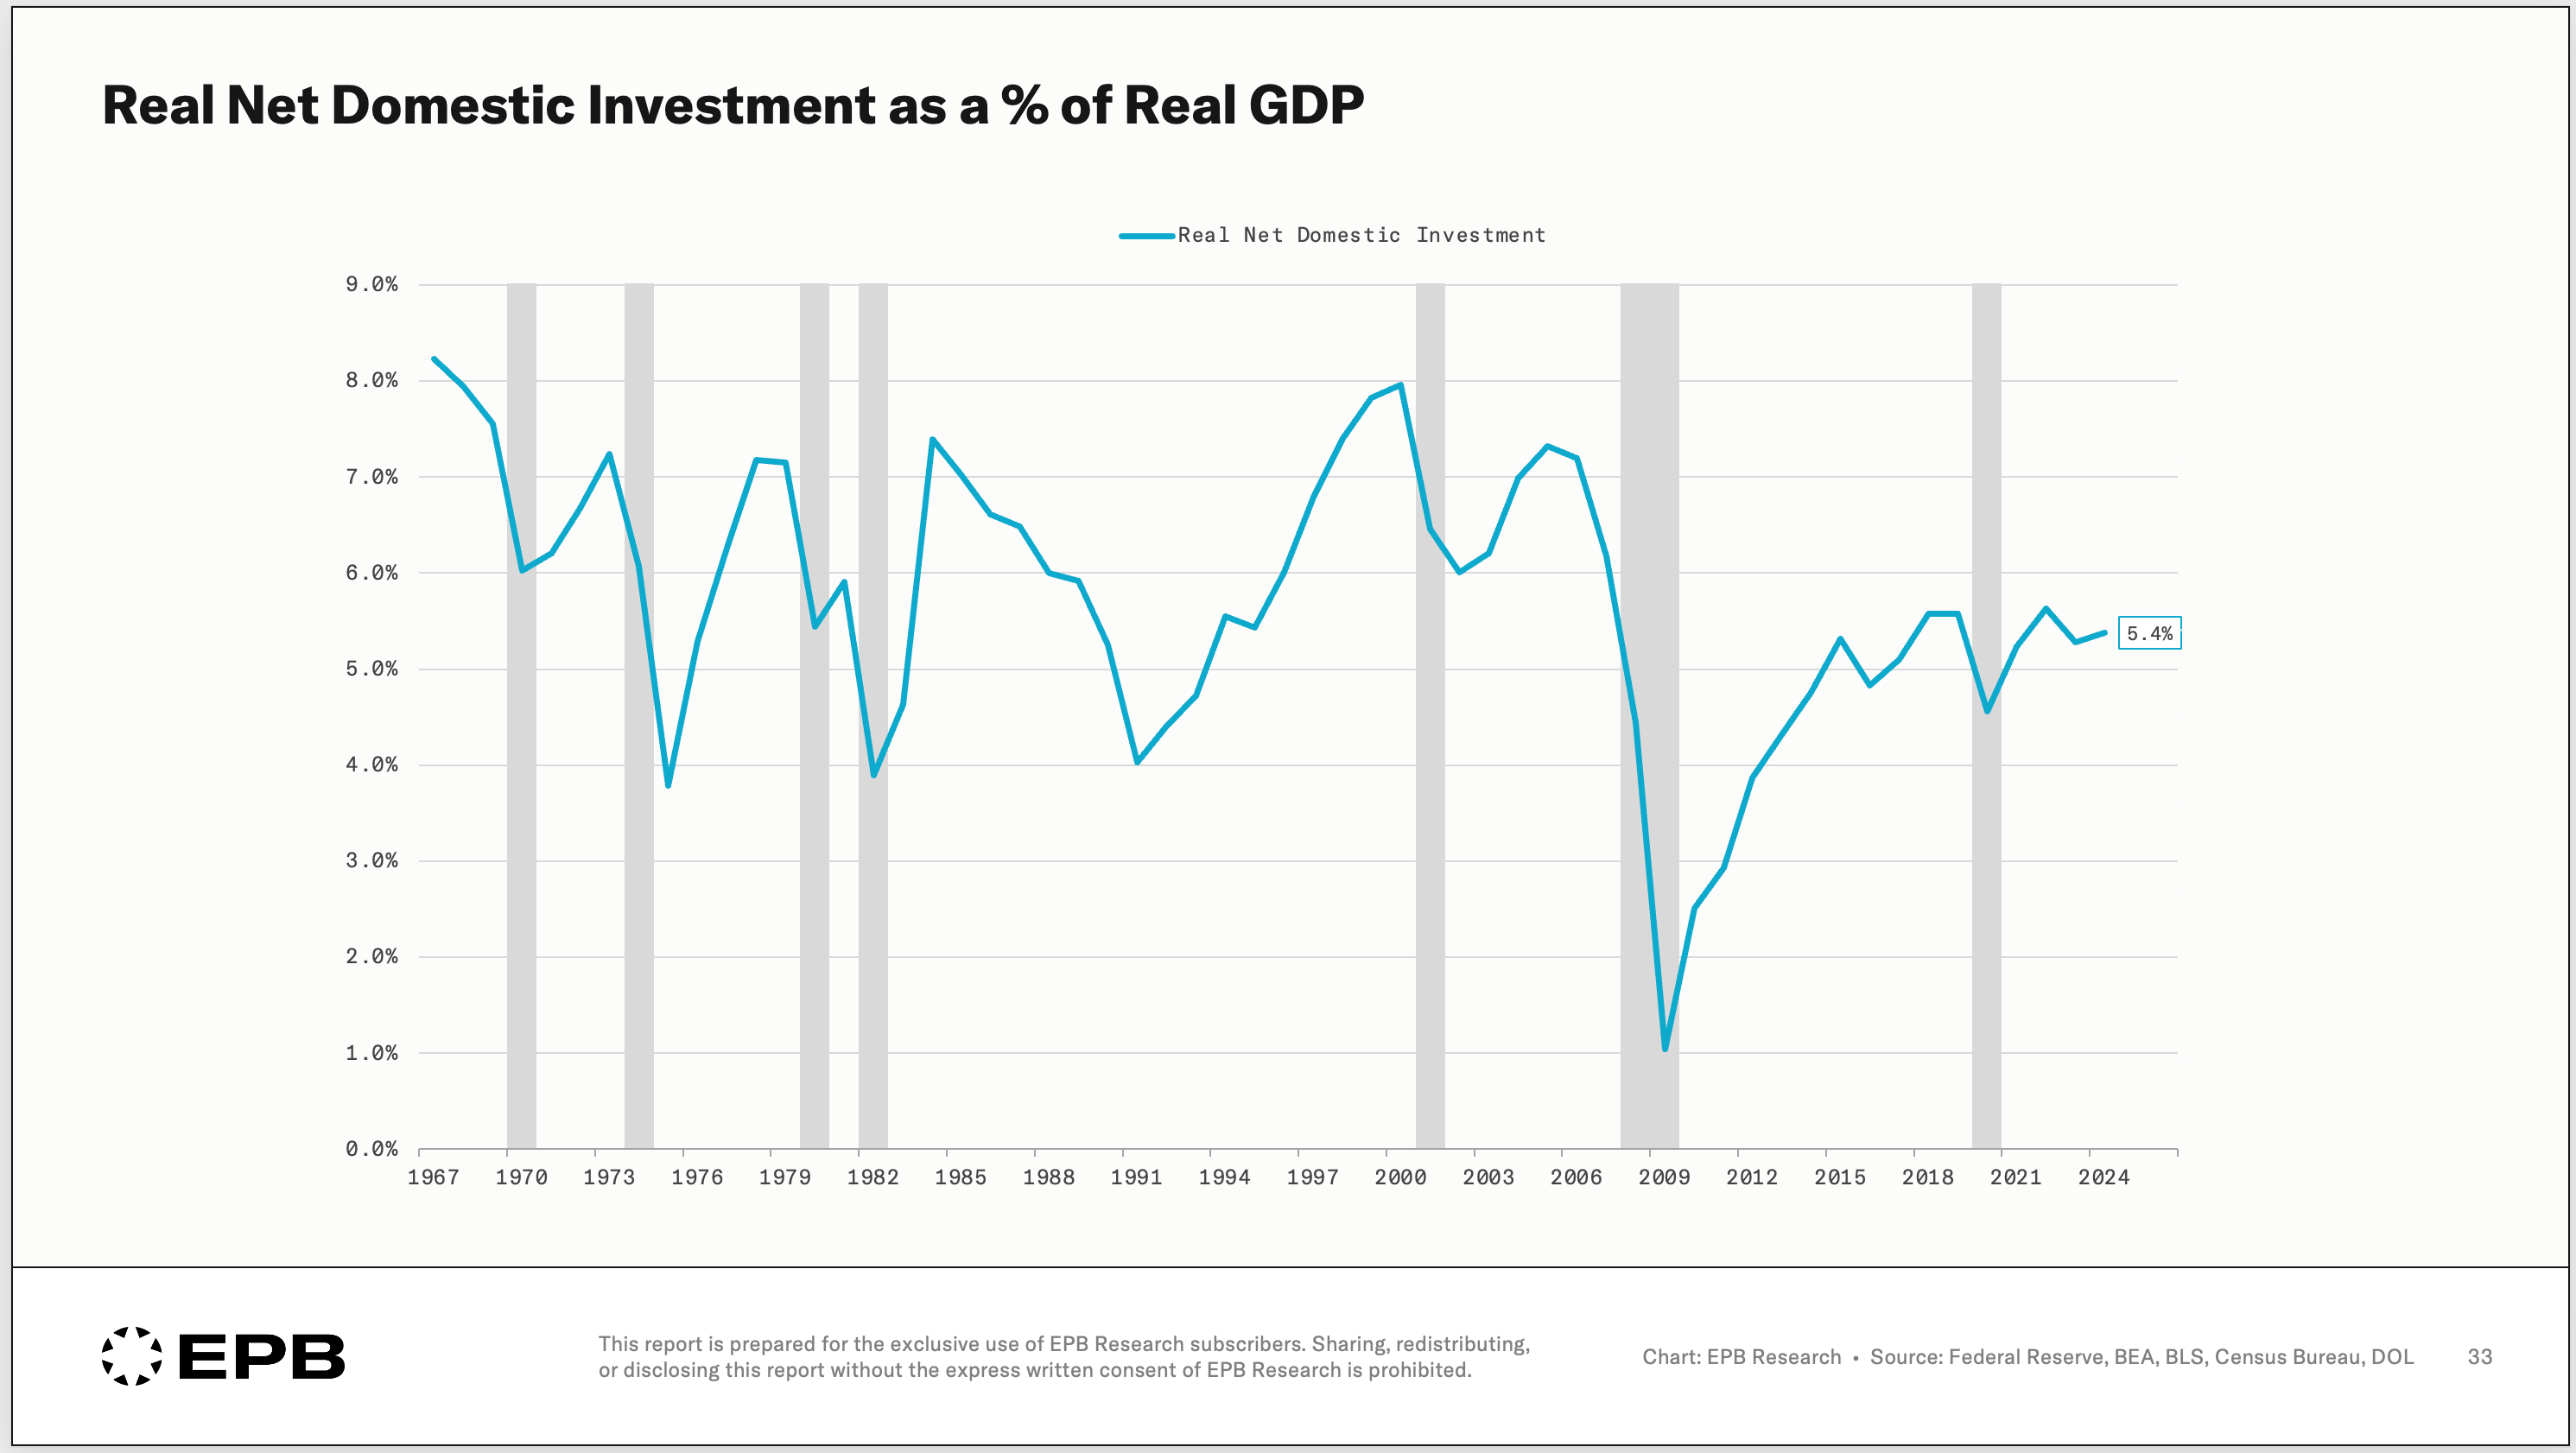
On the surface, this looks like a mild decline. But the top-line figure hides a deeper and more insidious shift going on under the surface.
The shift from structures to intangibles.
From Structures to Intangibles
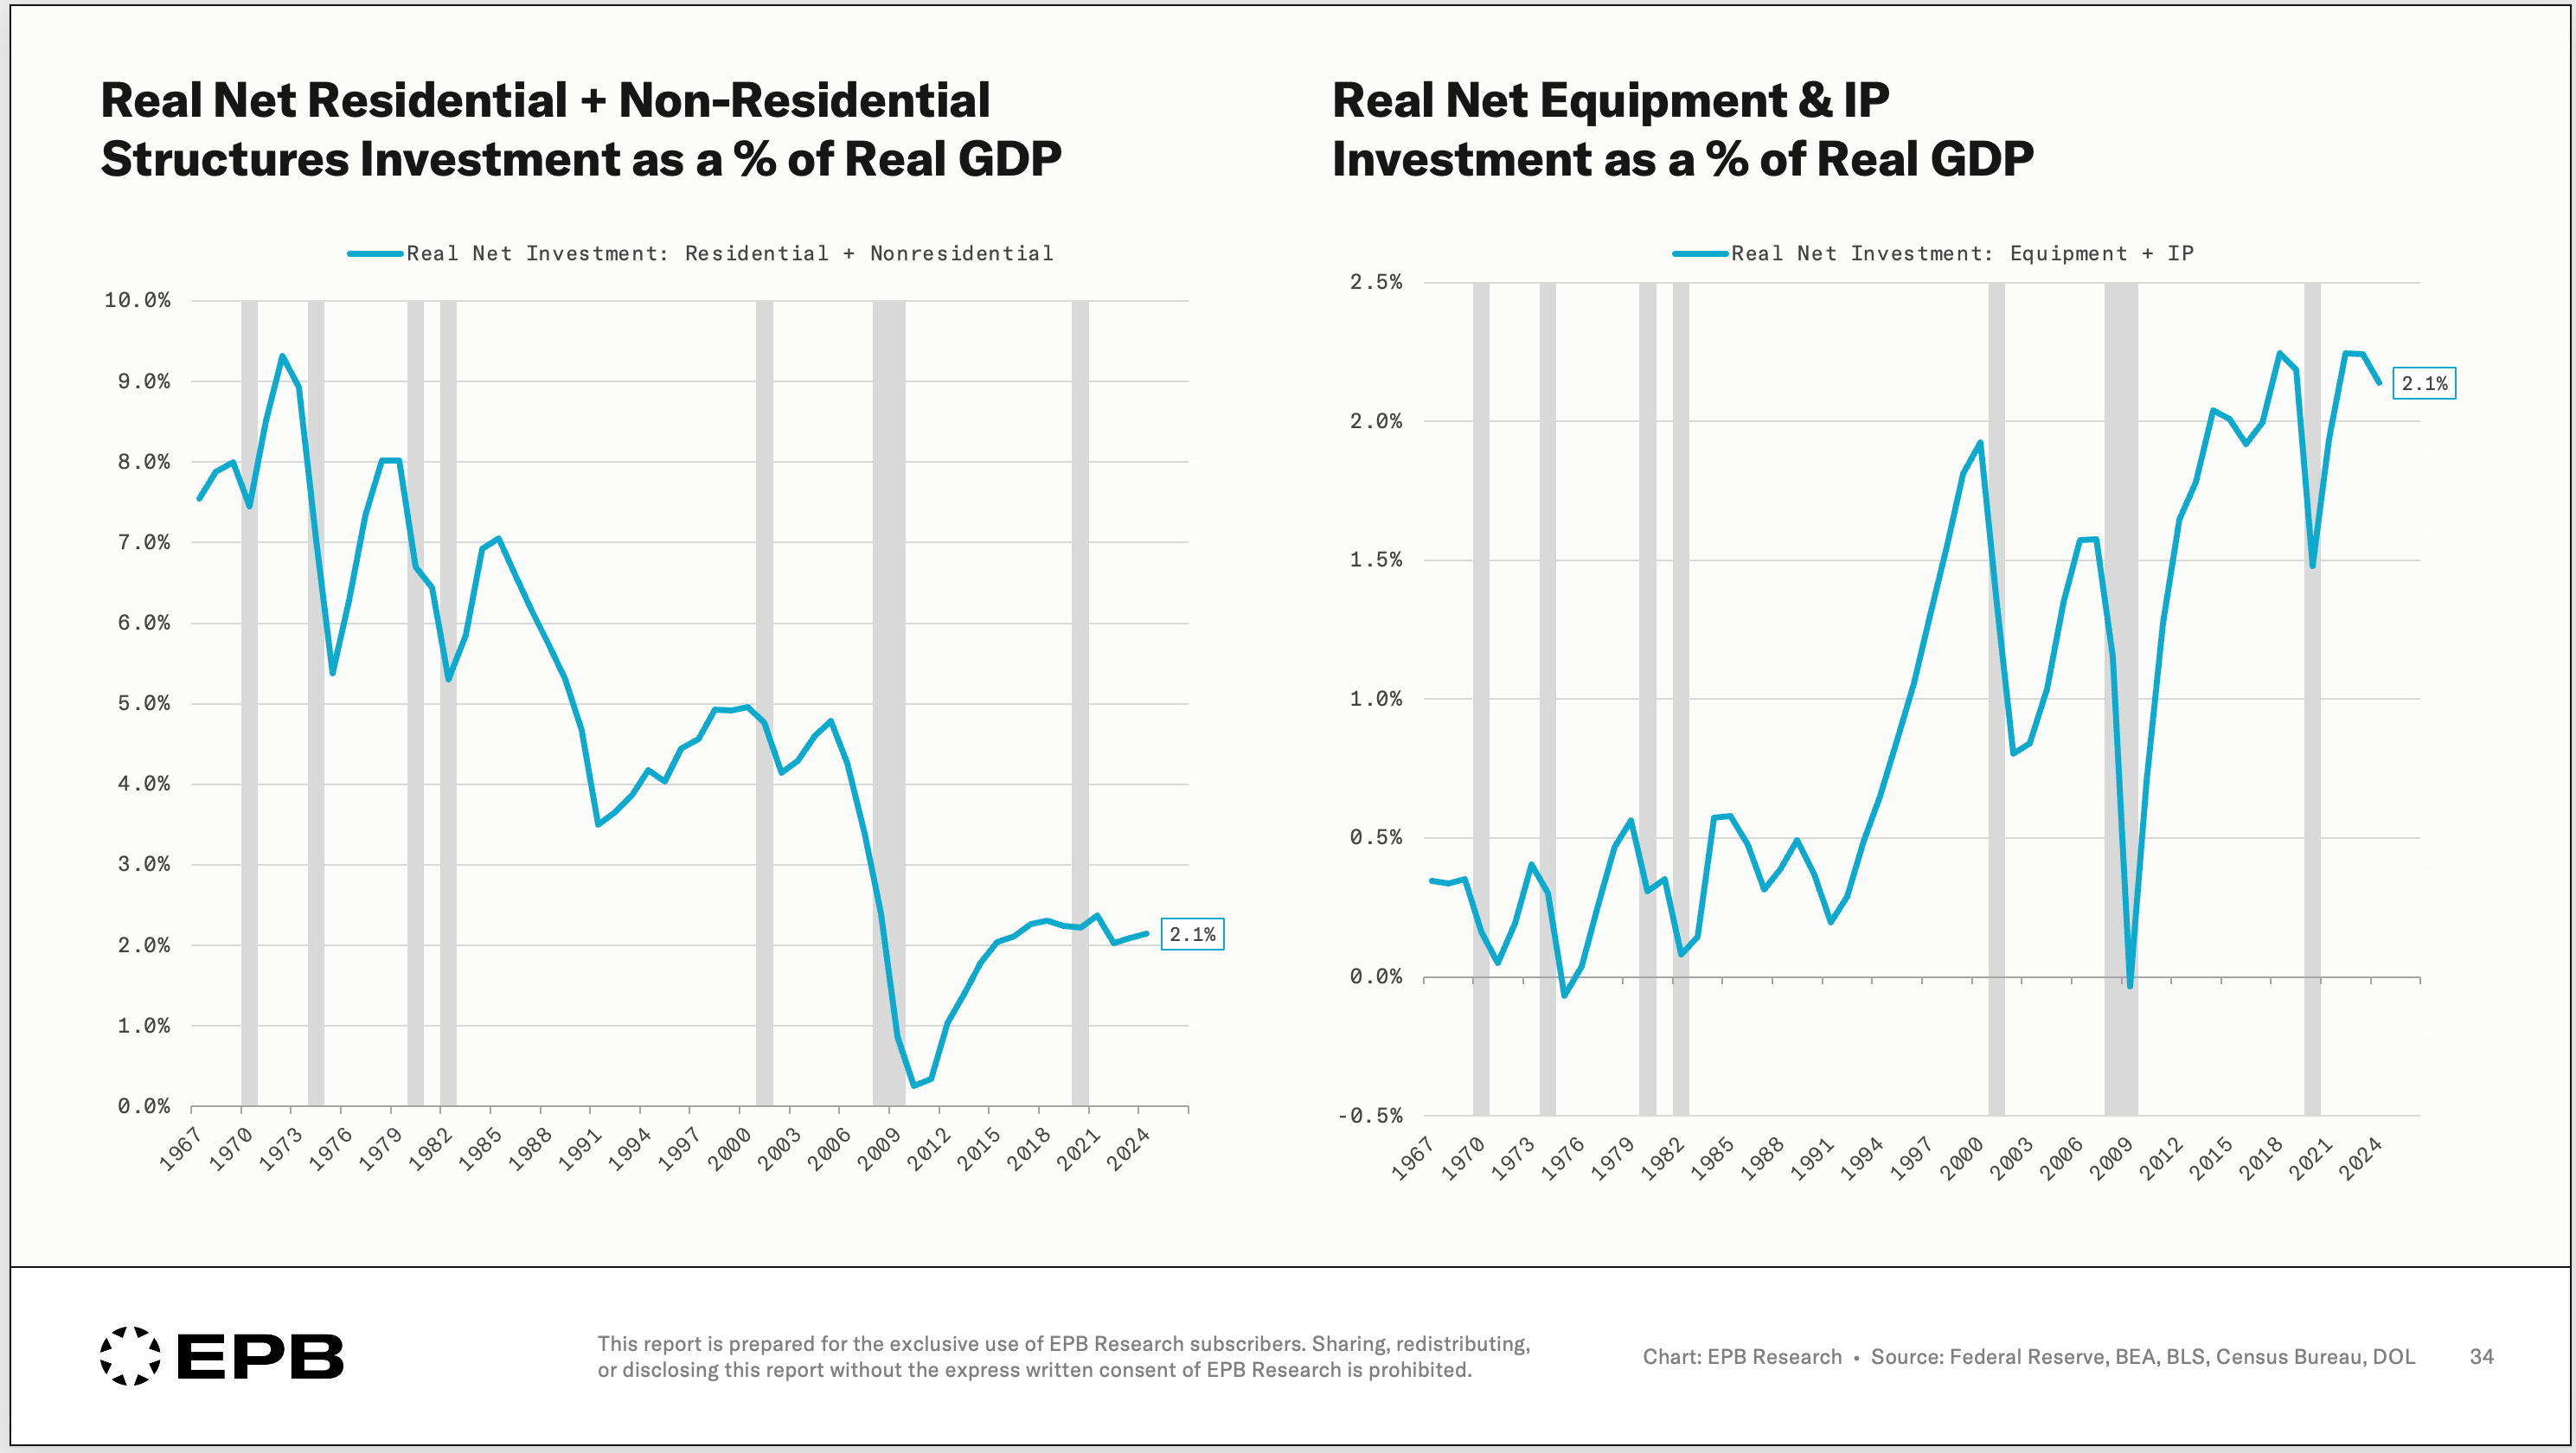
From a high level, we can split the investment we make into two categories:
Structures (homes, factories, buildings, power grids)
Equipment + Intellectual Property (computer equipment, chips, software)
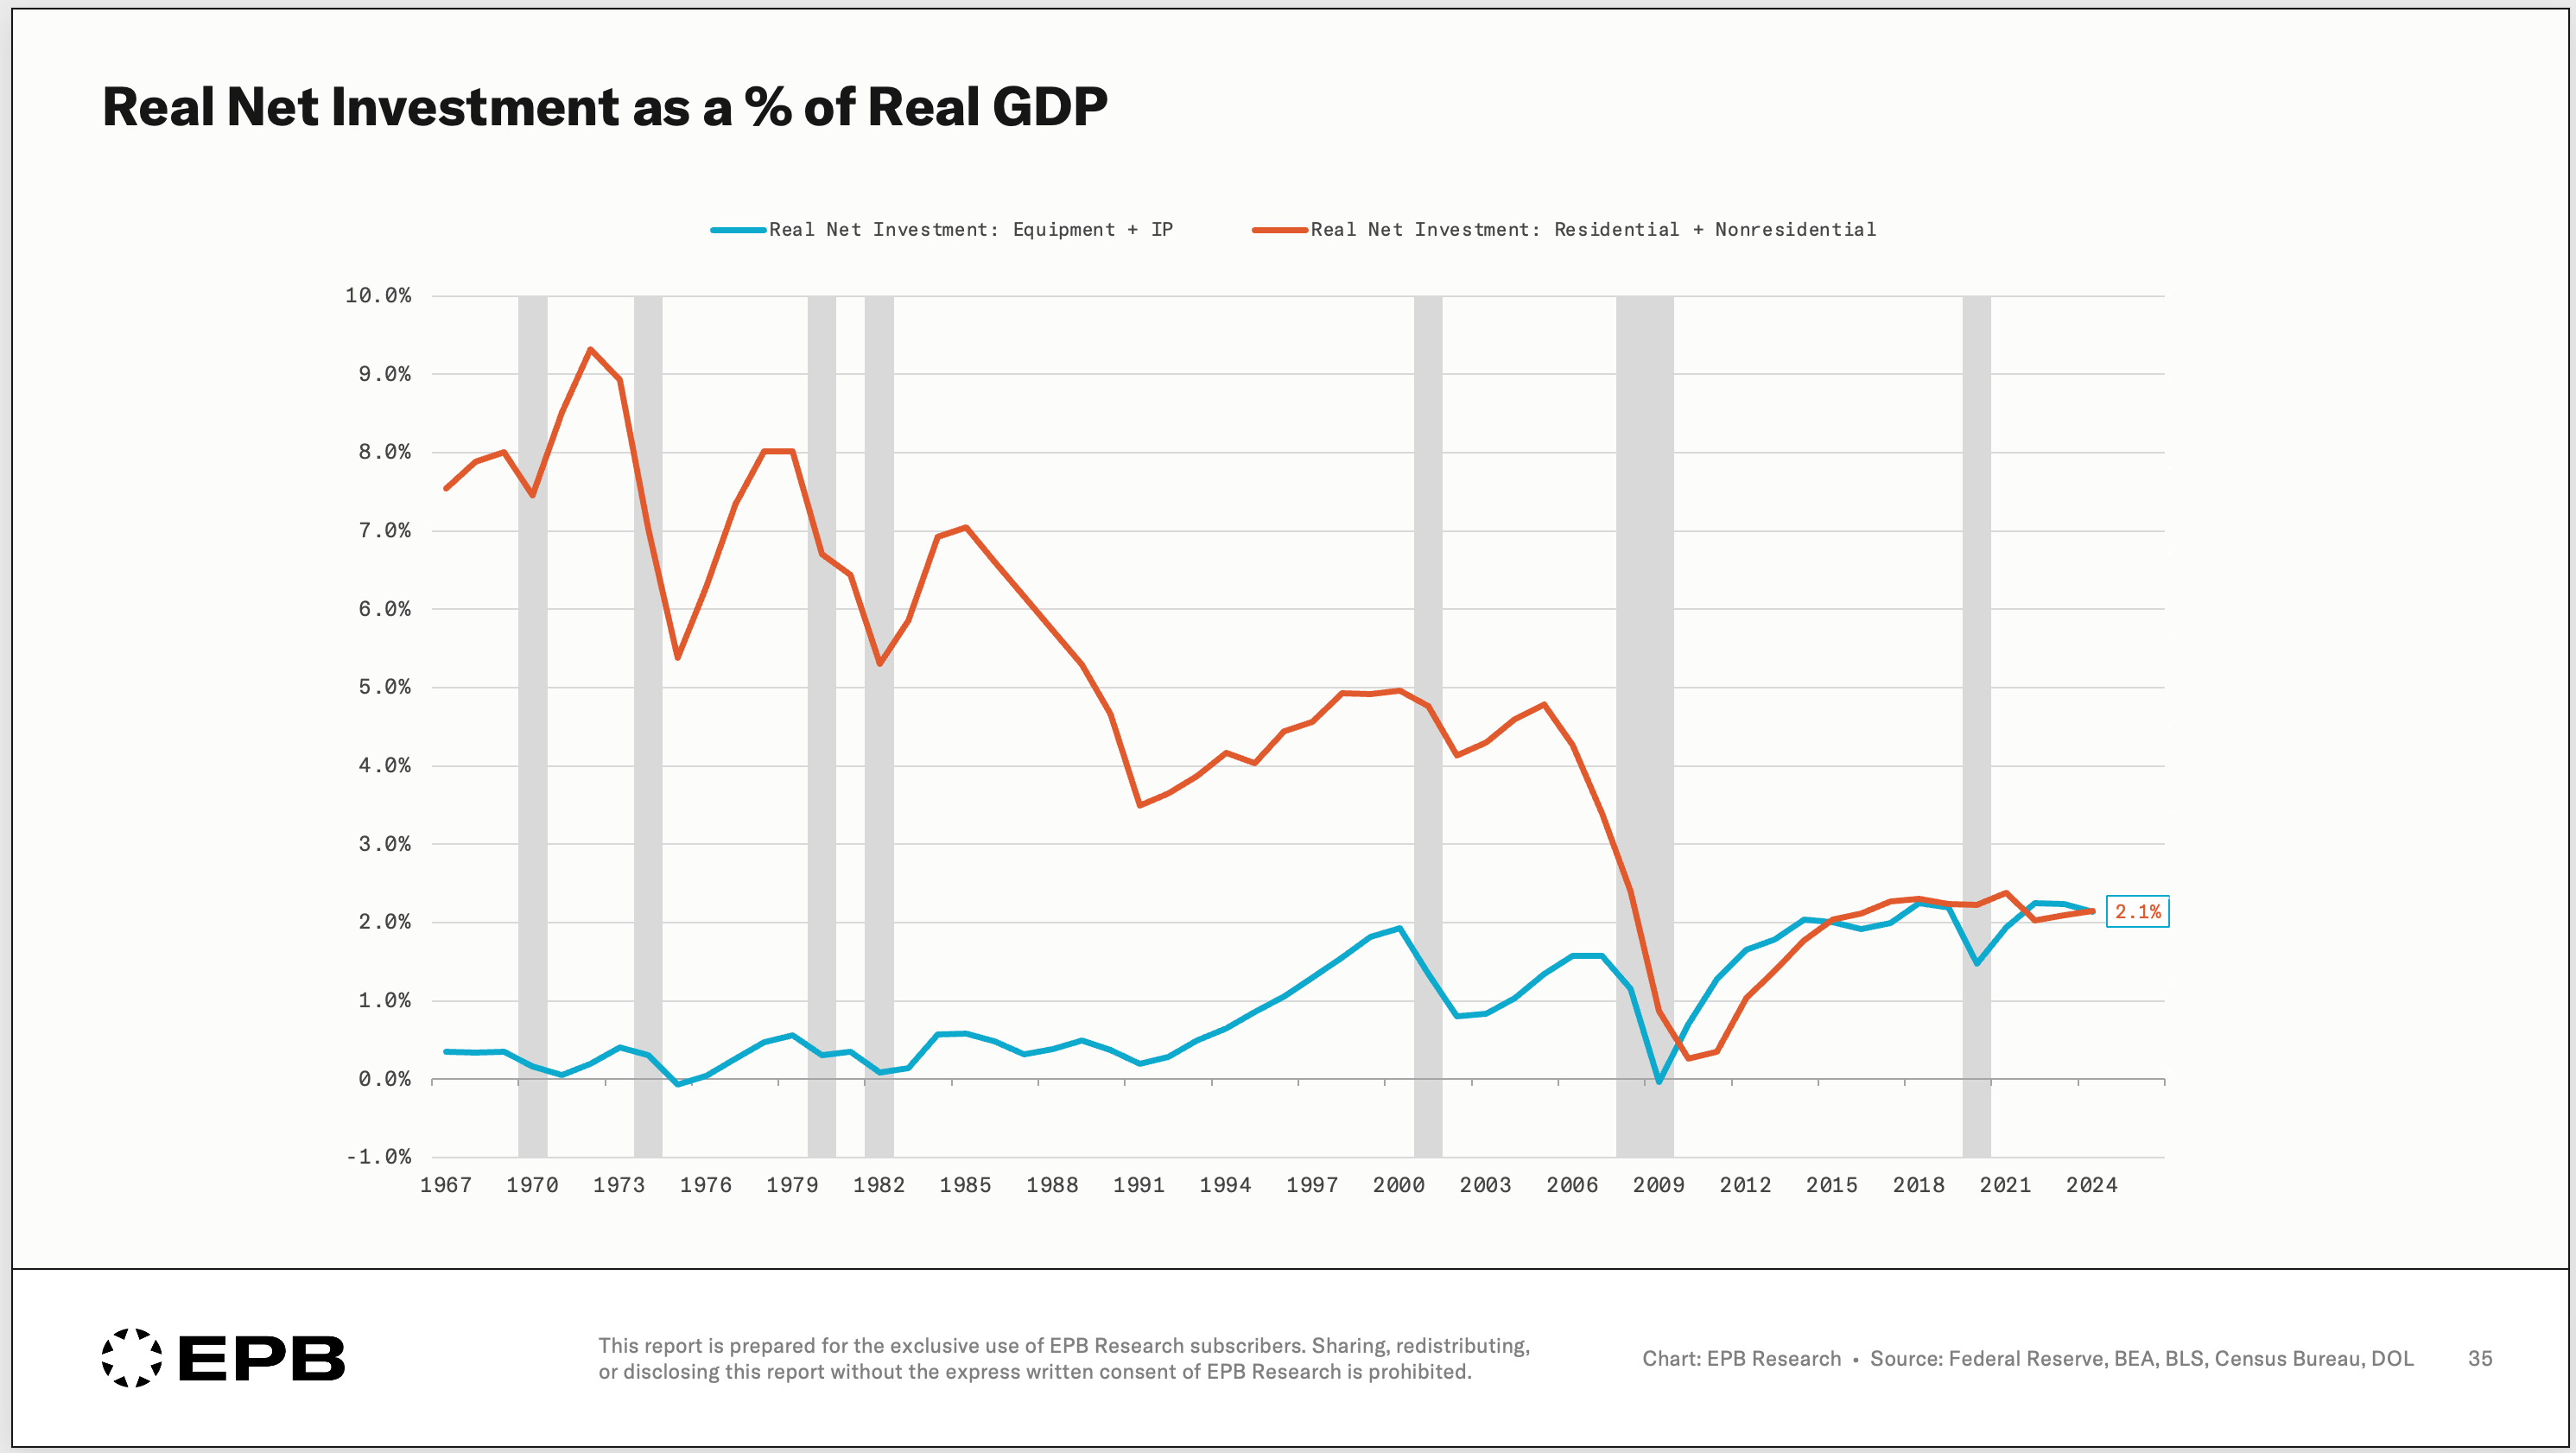
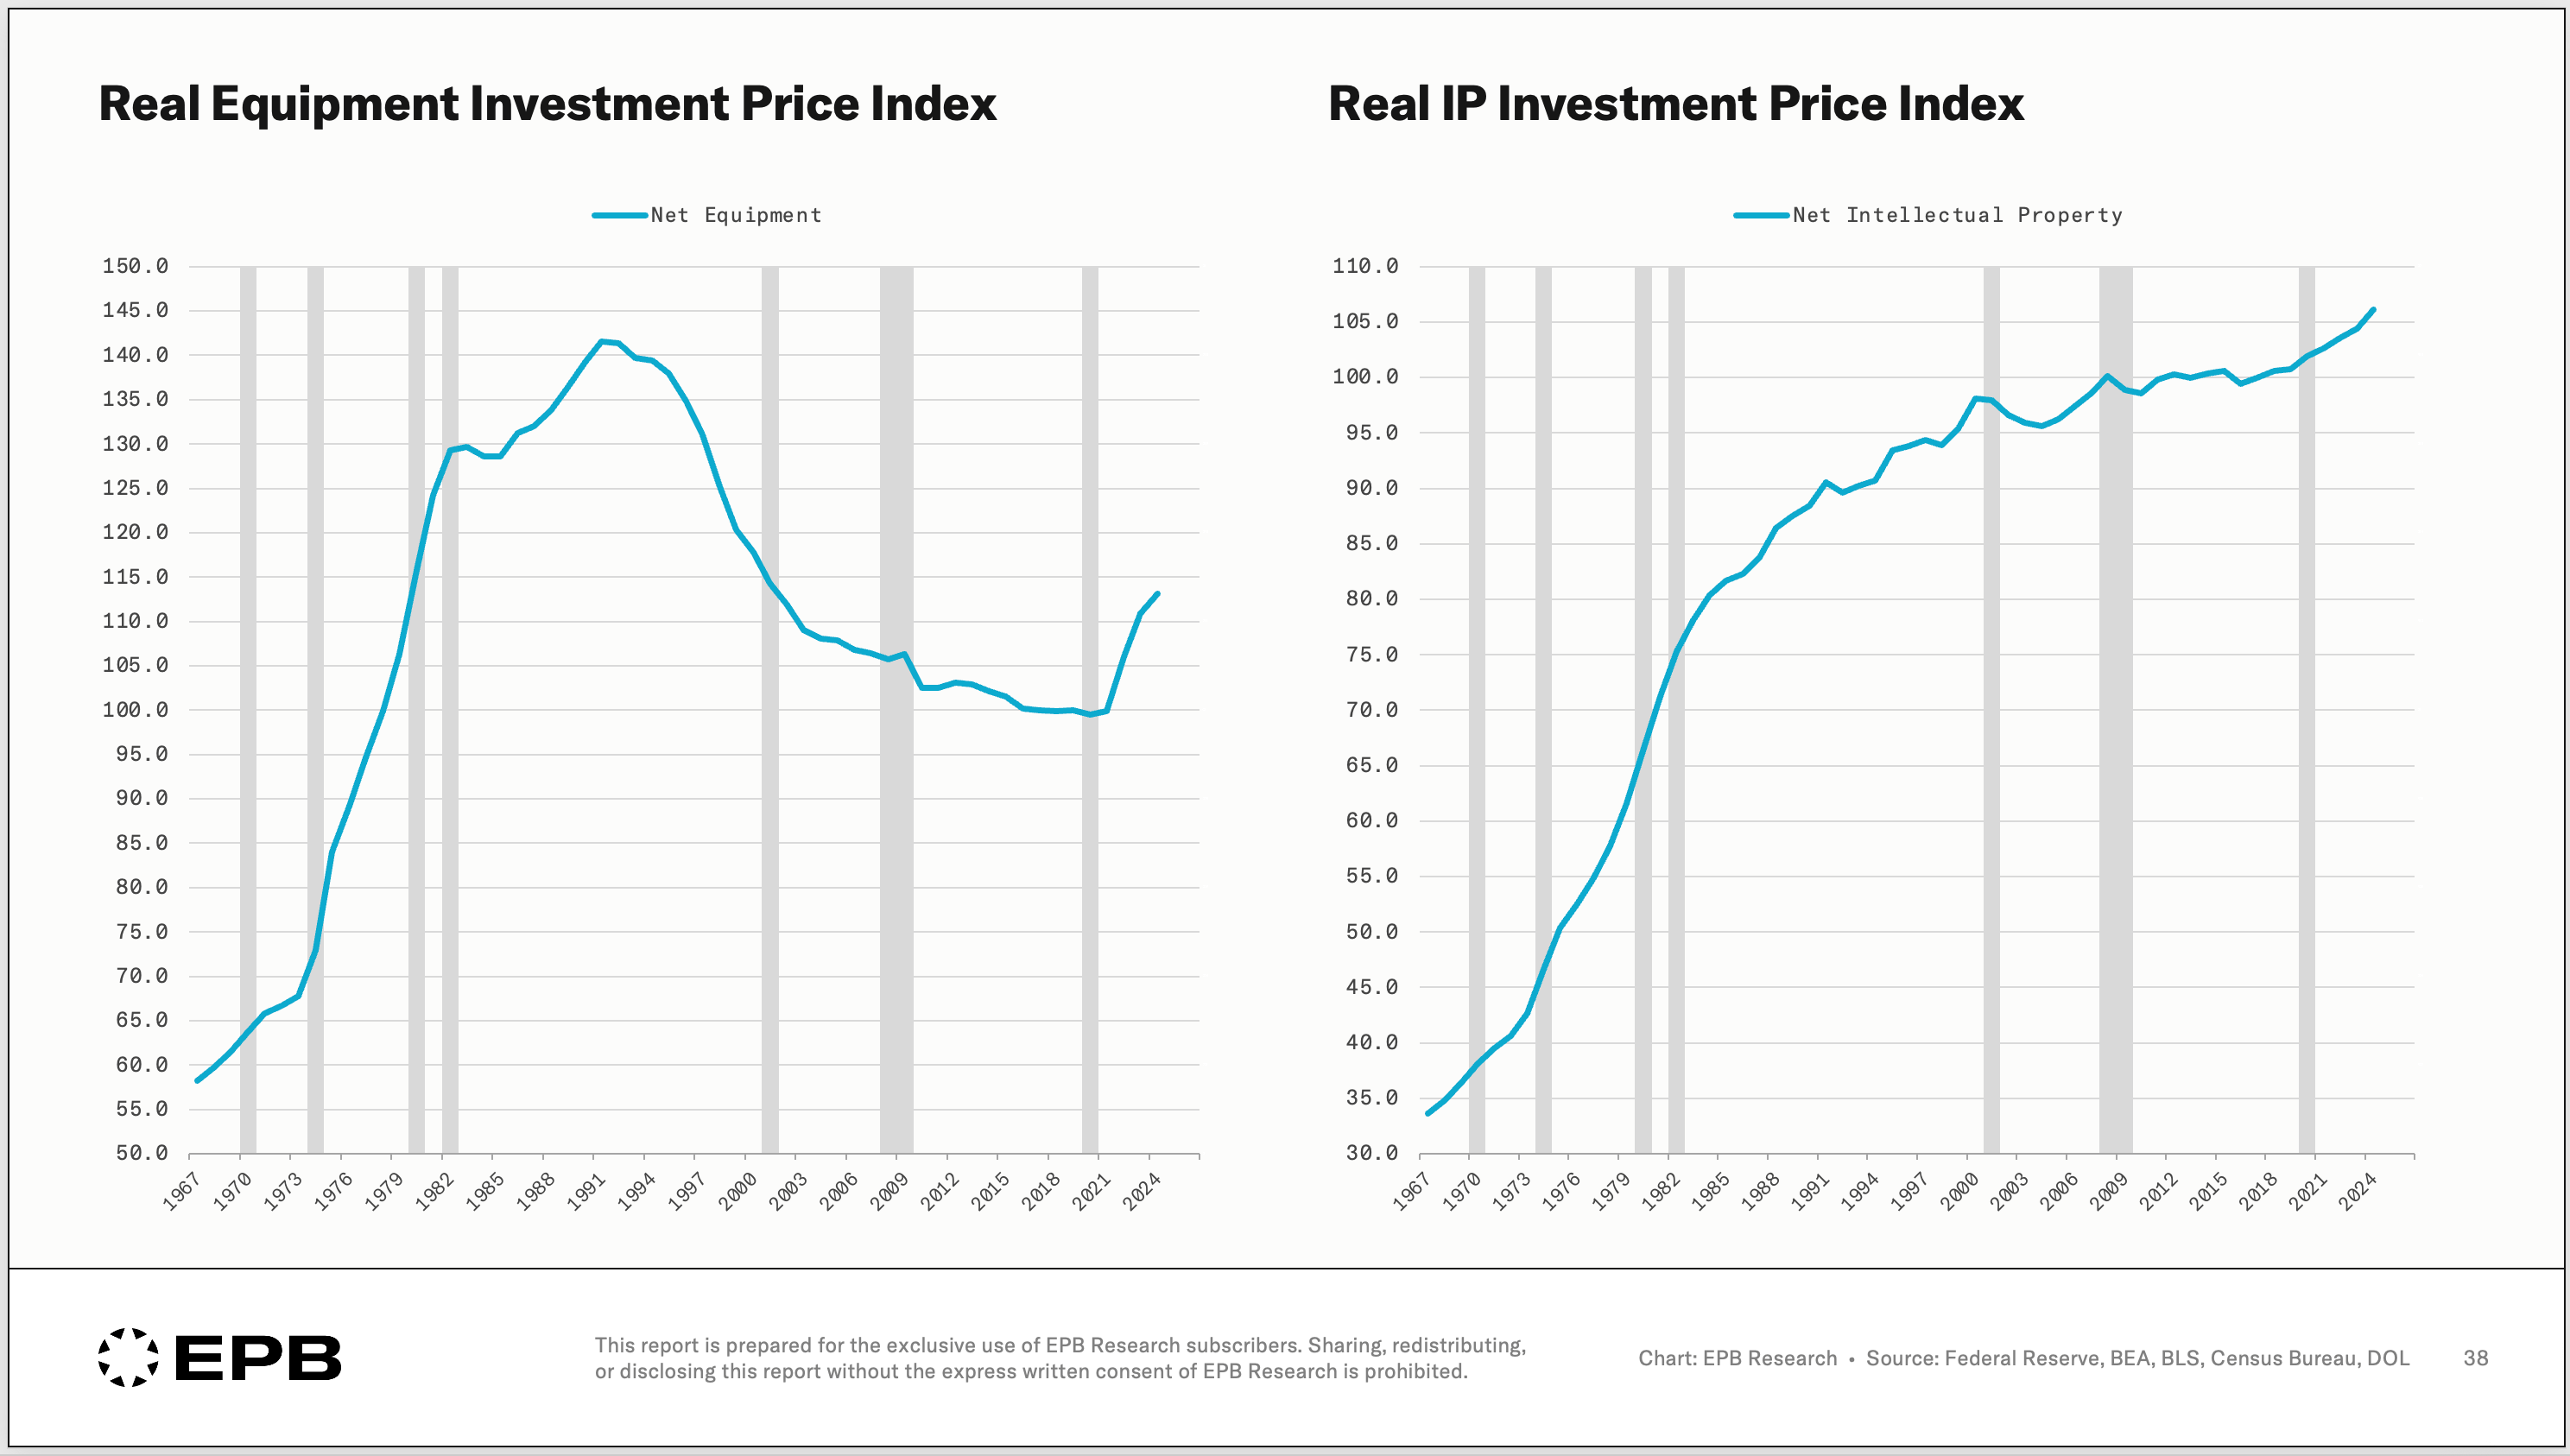
In the 1960s, real net investment in structures ran 7 to 9% of GDP while equipment and IP ran under 1%. Today they’re about 2.1% each.
This is an extraordinary shift, and it has real consequences.
Now, you could call the shift from physical to intangible capital progress, and in part it is. A more advanced society shifts resources towards higher-tech items like chips and software rather than building more buildings.
The problem is who gets the gains from high-tech and who suffers the cost of the wear and tear on the country's physical bones.
The returns to intangible capital flow to a shrinking share of the population, while the majority interact every day with the country’s physical infrastructure, which is the source of their productivity.
Remember depreciation. Our structures wear out over time, and we need to invest in them just to stand still. Also, remember inflation. Construction costs have exploded, so we need to spend a larger dollar amount to build less stuff.
On a real net basis, we’re adding to that physical base far more slowly than we used to, even as the equipment and software side races ahead.
This brings us back to housing, where this lands the hardest on the majority of the population.
Housing Feels The Squeeze
Housing is a structure, and it fell the way structures fell.
Real net residential investment has dropped from about 5% of GDP in the 1970s to roughly 1% today. And because so little is being built, and we’ve shifted so many resources away from this type of investment, it costs more to build.
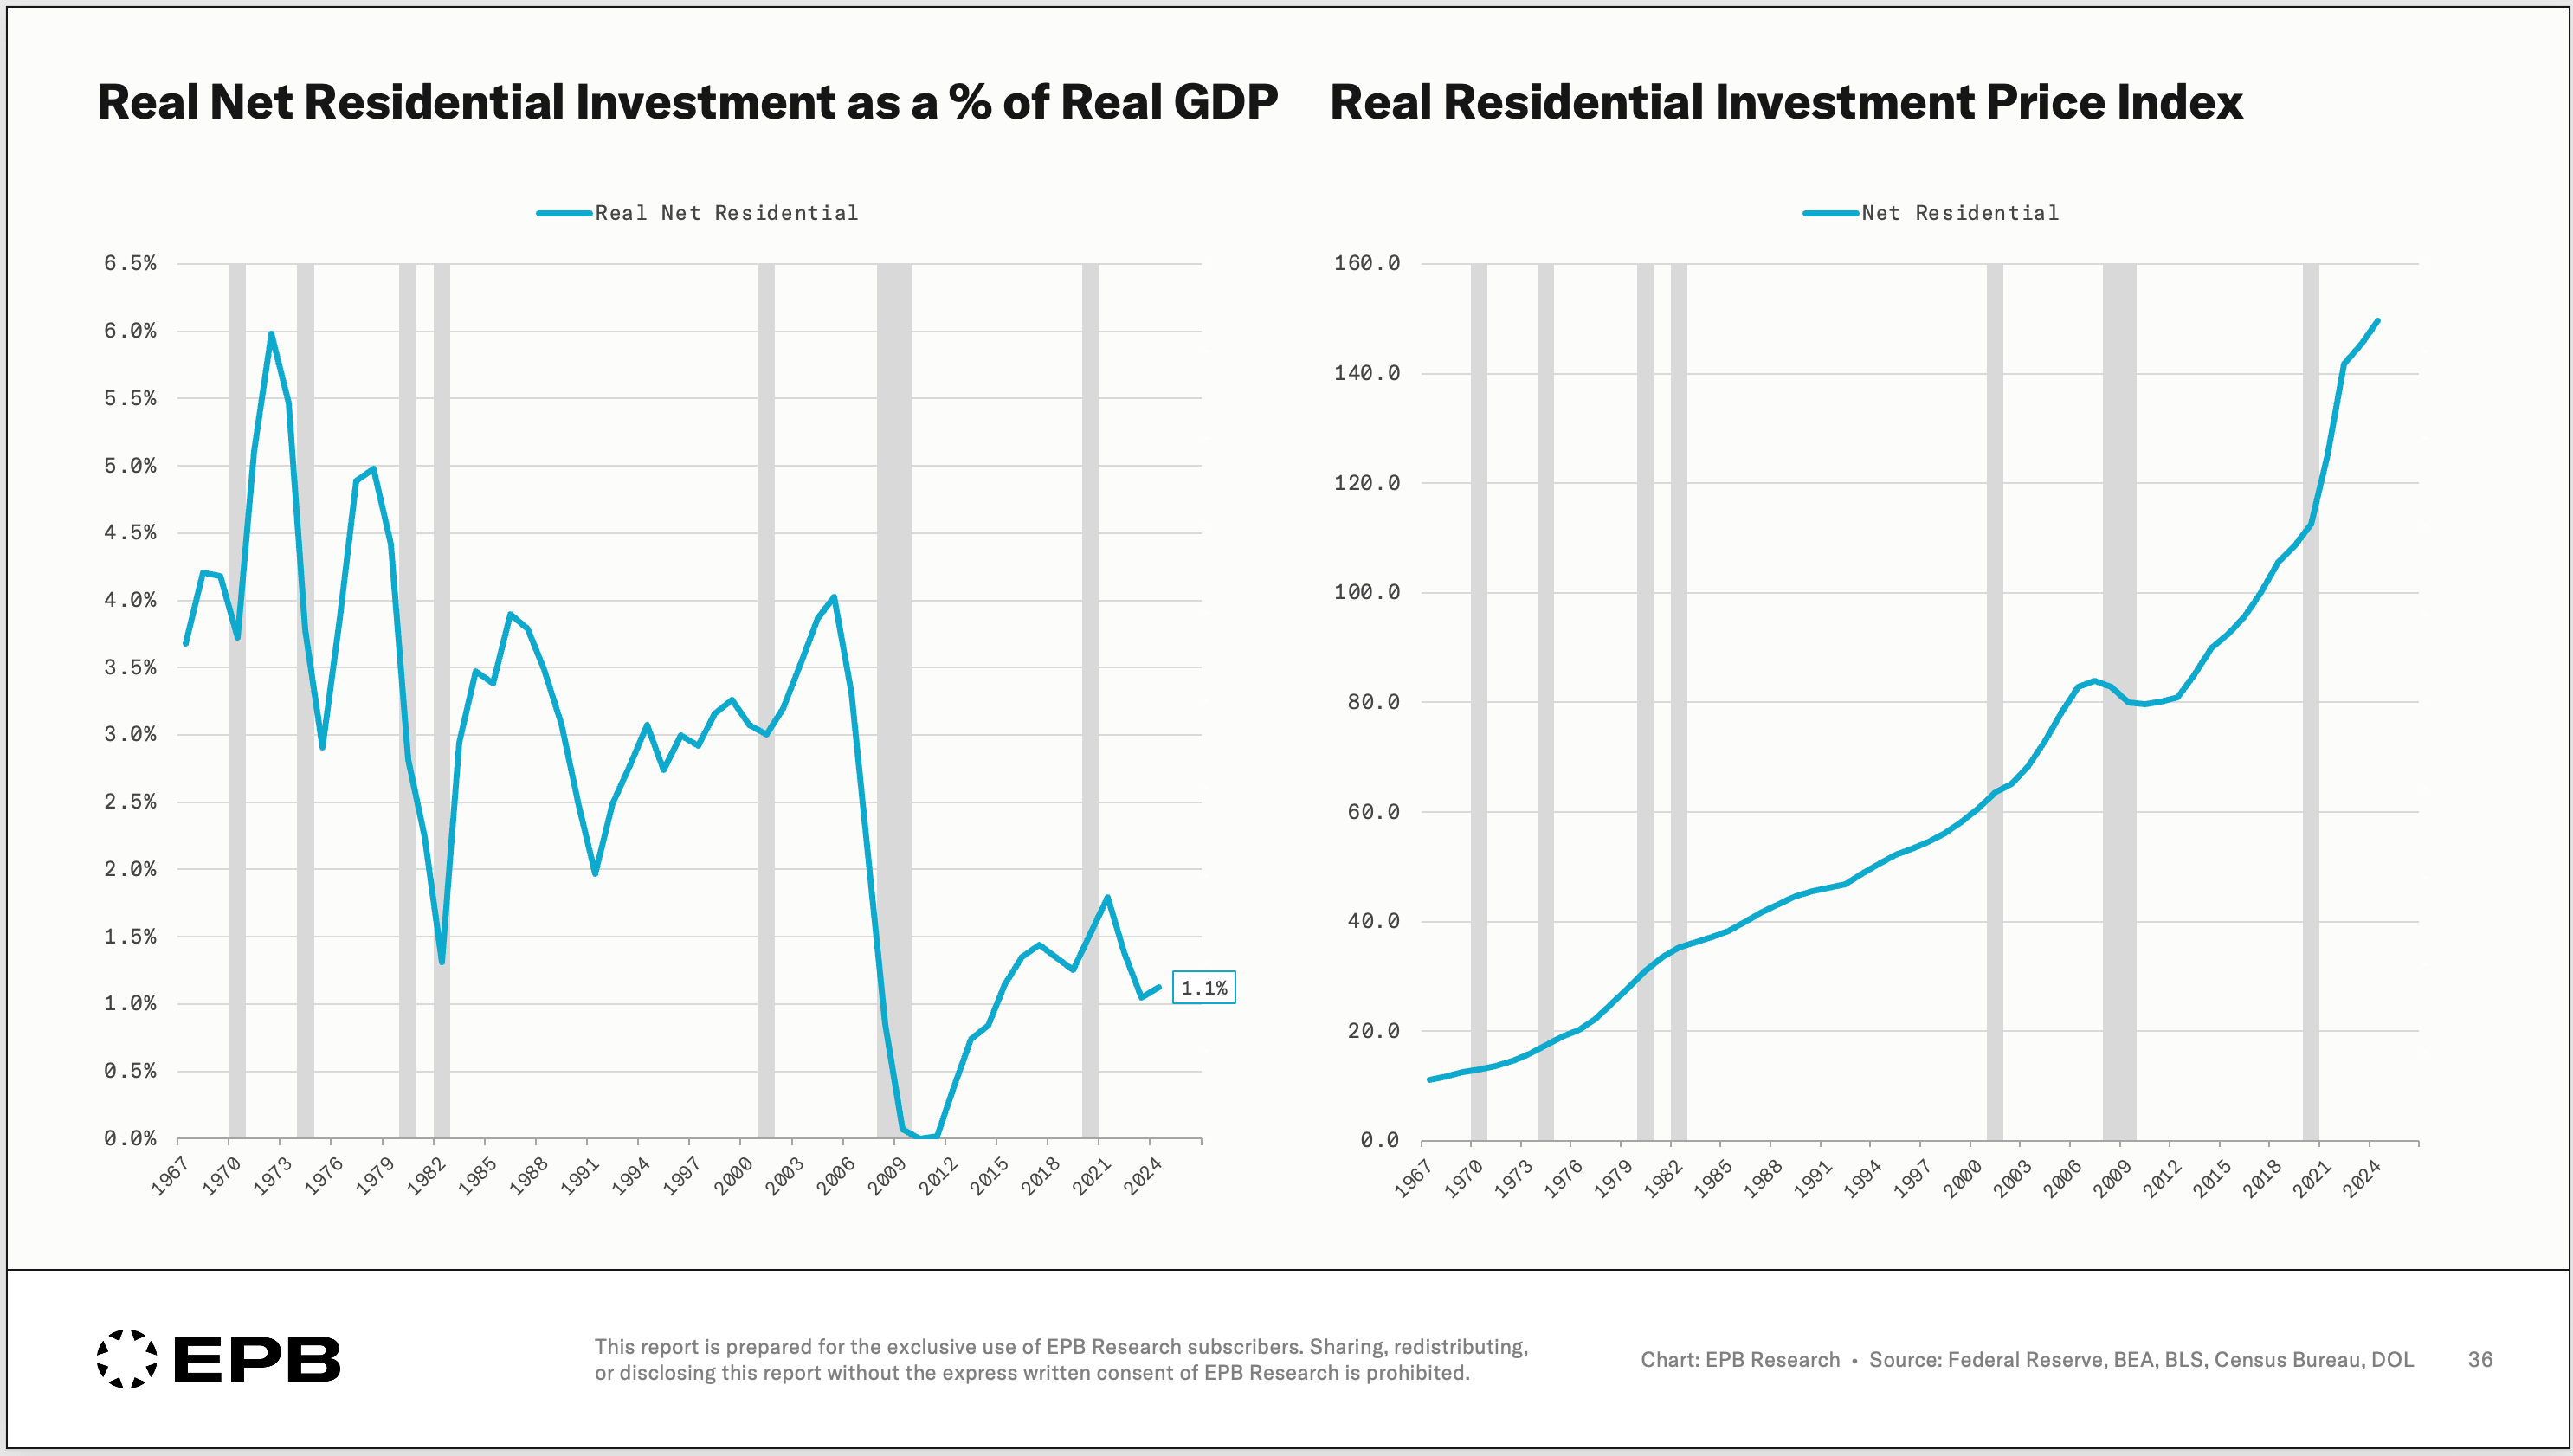
The price index for residential investment has far outpaced consumer inflation, running about 4% a year for decades. This is why people feel their personal inflation rate is higher than what the CPI reports.
The inflation rate for building a home has far outpaced CPI, which blends shelter, food, and equipment costs, and has been balanced by falling prices in those categories.
So for housing, less is being built, and it’s way more expensive to build.
This is the affordability problem written in the national accounts.
Housing Investment Has Stalled
Adjust for inflation, depreciation, and the number of households, and the picture is clear.
The US once added $3,000 to $4,000 of real housing per household each year.
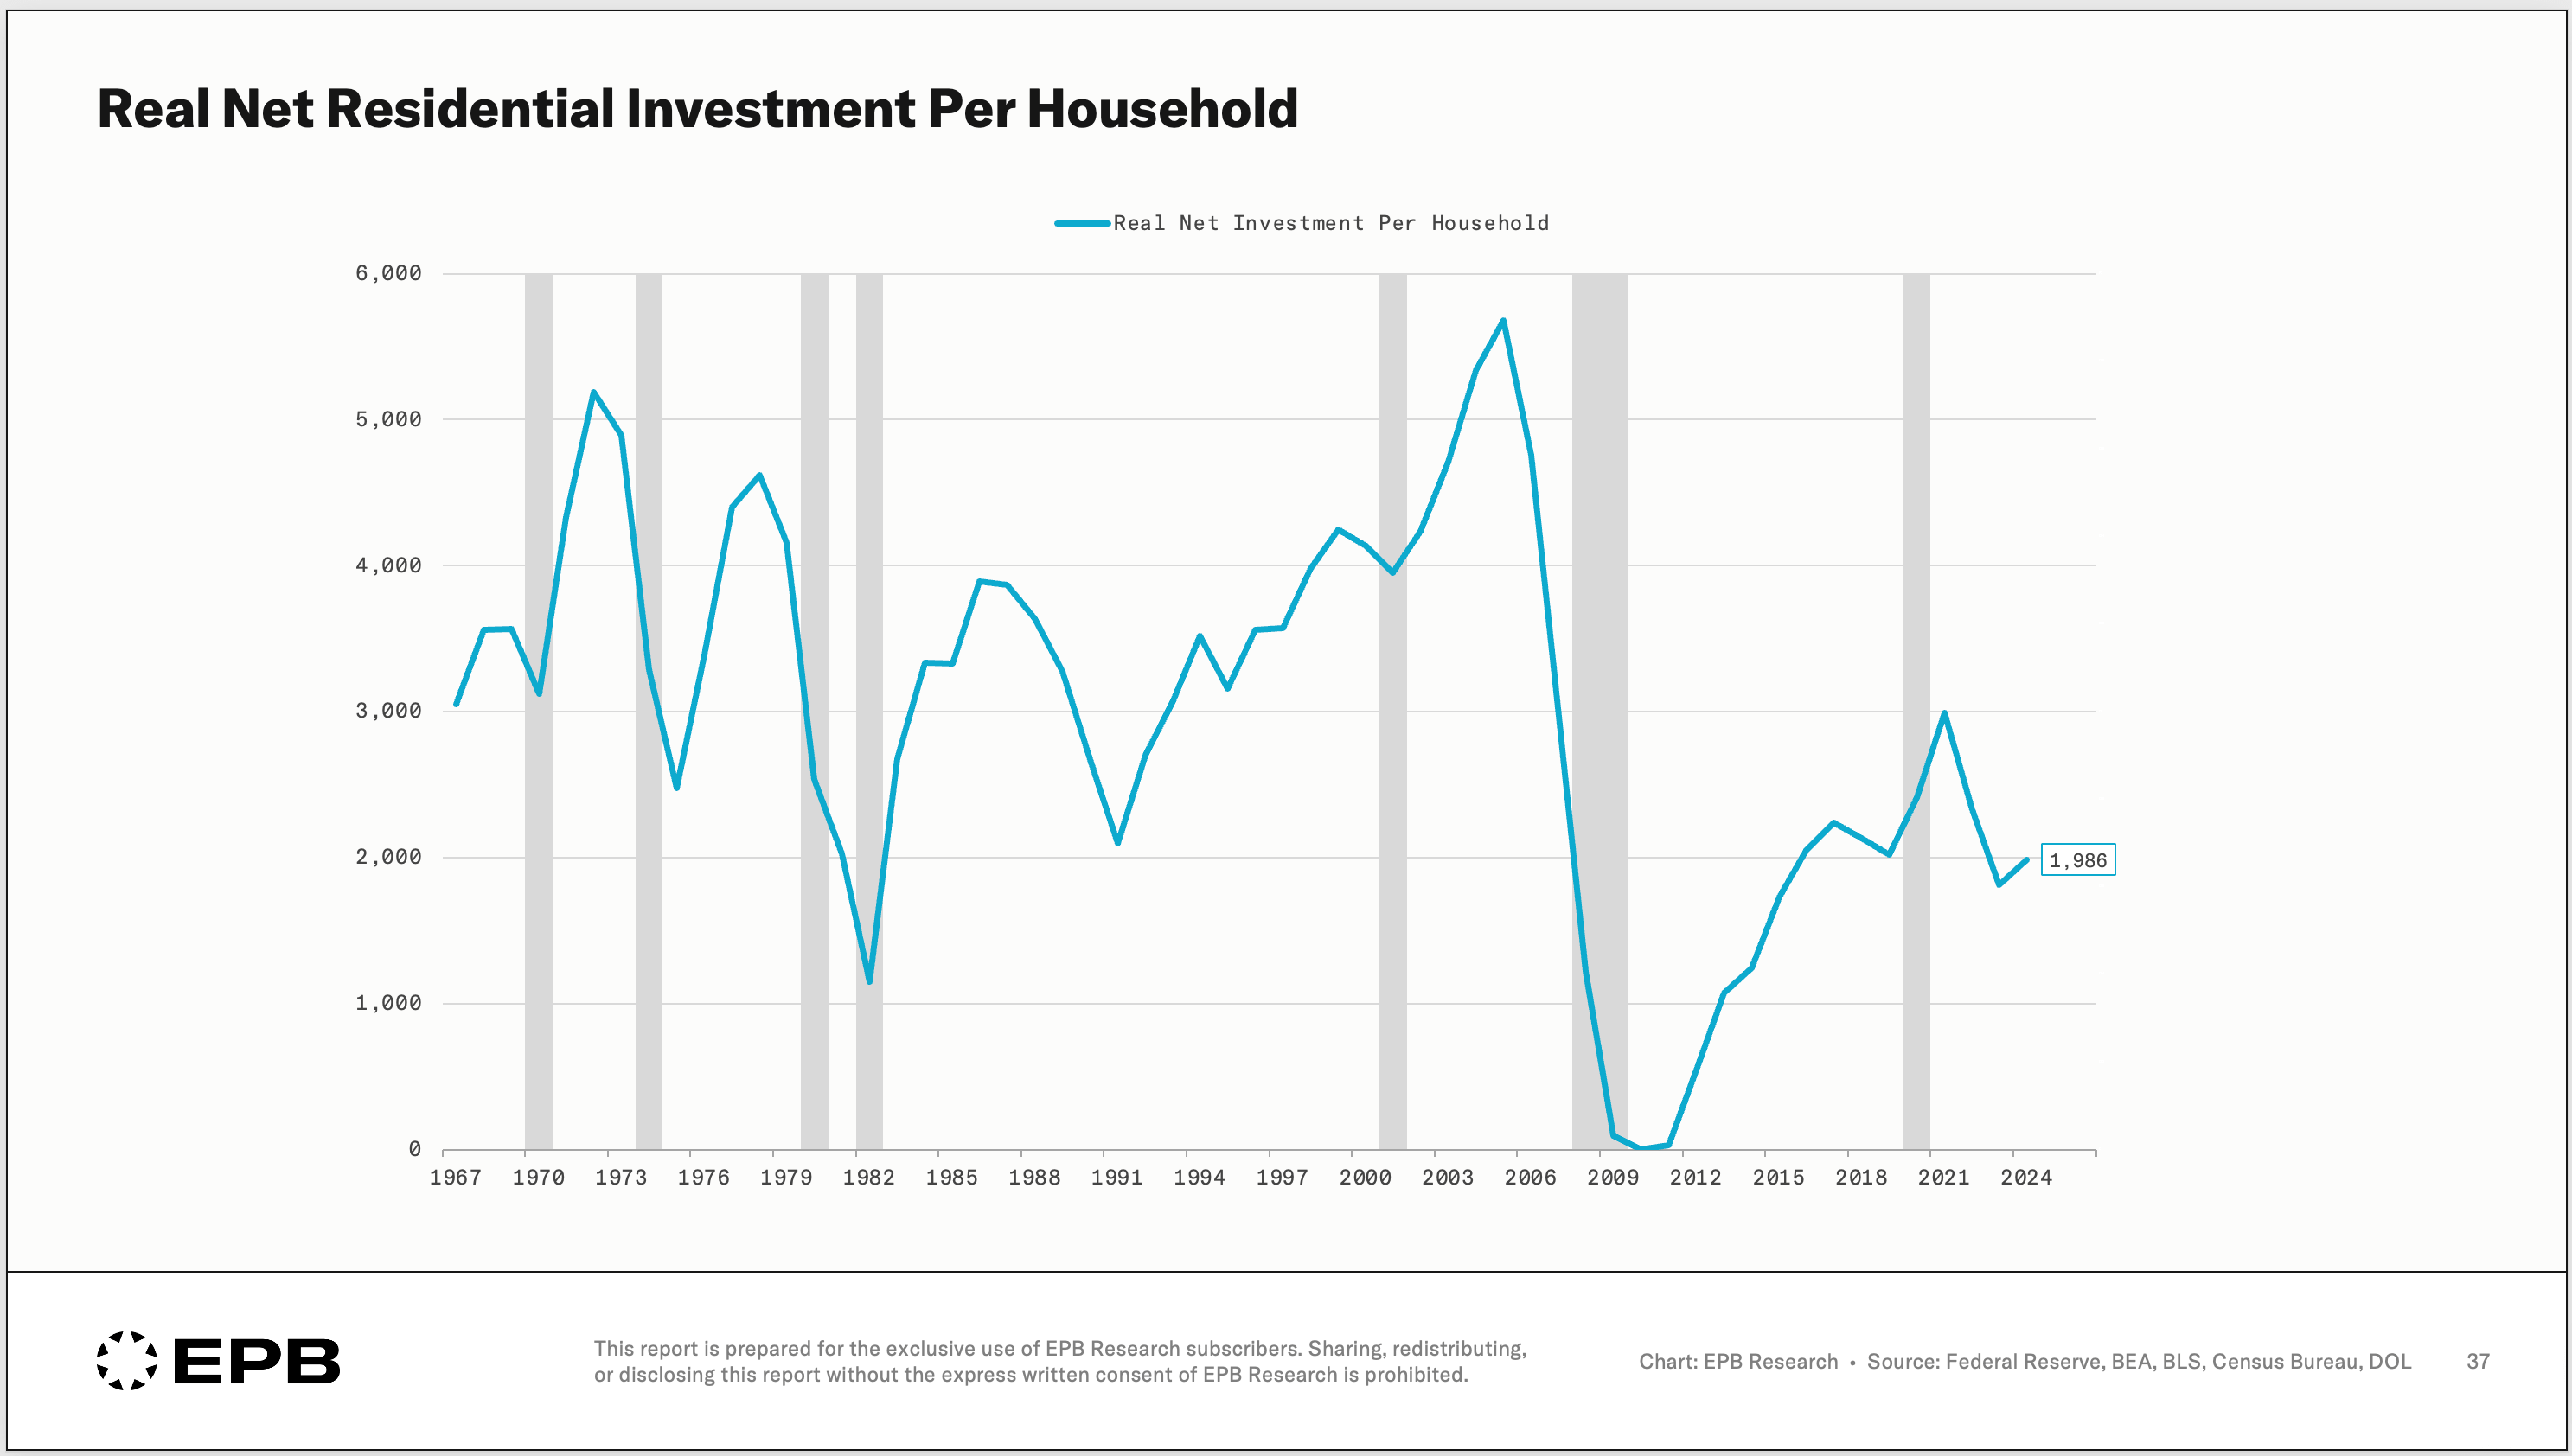
Today it’s under $2,000, and has been for most of the time since 2009.
After depreciation and inflation, the country adds less housing per household now than it did fifty-seven years ago.
Where Does This Road Lead?
It’s very easy to say, we should just invest more in housing. But it’s not that simple.
We only have about 5% of GDP that we can invest on a real net basis. There are only a few ways we can increase investment in housing, and each has trade-offs.
Shift investment away from equipment & IP (less tech progress)
Save more (lower household consumption)
Shrink the deficit (reduce entitlements)
Increase foreign inflows of capital (a bigger trade deficit)
Two parts of the economy are pulling apart.
The physical world keeps getting scarcer and more expensive: housing, structures, and the infrastructure people use every day.
The digital world keeps getting cheaper and more productive: software, equipment, the rest of the intangible economy.
These two paths have different impacts on different people.
The rising cost and worsening quality of the physical world fall disproportionately on those who pay a larger share of their income towards housing, and on workers whose capital base and productivity are seeing less investment.
The falling cost and rising productivity of the digital world accrue mostly to the owners of that intangible capital. If you mainly rely on the physical economy rather than the digital one, this shows up as a slowly rising cost of living and a declining standard of living.
Interestingly, the AI buildout presses on both of these paths at once.
It drives down the cost of producing software and ideas while raising demand for the scarce physical inputs that house and power them: electricity, the grid, and data centers.
And going back to the start of this, a growing share rests on foreign money.
We’ve held real net investment near 5% only because foreign capital funds most of it. That makes the level itself potentially fragile.
If those inflows slow, for any reason, the adjustment may be sharp.
Investment has to equal domestic saving plus foreign capital, by simple arithmetic.
With domestic savings near zero, a pullback from abroad forces the gap closed through some mix of higher interest rates, less investment, and/or squeezed consumption.
How Should You Position?
This has real implications for what’s worth owning or how you should position. If we continue on this road, physical assets keep getting more expensive to reproduce, and value tends to accrue to whoever already owns the scarce physical base.
However, the real cash flows of these assets do not benefit from the stagnation.
The cost of replacing them rises even as the real income they generate stays flat.
Of course, this rests on a bet that this regime persists.
You now understand the forces.
Whether they’re acute right now, and how to be positioned for them, isn’t something that you can hold as a static view. It’s a judgment that has to be made and remade as the data evolves.
That’s the work we do at EPB Research.
Our free Sunday newsletter is where we work through structural shifts like this one, alongside the business cycle, where the investment posture gets more direct.